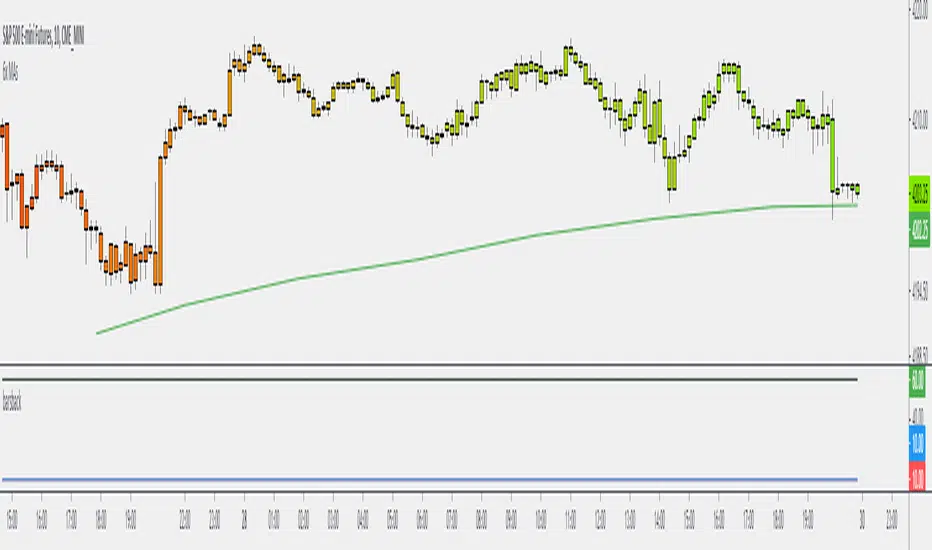
MTF Bars Back FunctionDesigning higher timeframe tools is challenging. Particularly when you want to apply the higher timeframe lookback to the viewing timeframe.
Here are the problems you run into when you want to use a higher timeframe input:
The output is a string.
On the daily, weekly, or monthly timeframes, the output of the input.resolution variable is "1D", "1W", and "1M".
The 1 minute, 1 day, 1 week, and 1 month timeframes all have an output of 1. Same for the 2m, 2d, 2w, 2m and so on.
I designed this function to automatically calculate the number of candles back that you would need to go back on the timeframe you're viewing to cover the lookback distance on the higher.
It checks if there's a letter on the end of the string and cuts it off, leaving just the number, then converts it from a string to a number.
From there it converts the viewing timeframe and higher timeframe into minutes, divides the two to determine their relationship to one another, then it multiplies the lookback distance of the higher timeframe with the factor and the output is the higher timeframe lookback distance converted into the equivalent bar count on the lower timeframe.
I tried to write it in a way that would make what the function does clear to coders and non-coders so it can be modified to suit your purpose. My initial use case was to us this as way of determining a lower timeframe offset for lines that were cast based on previous high timeframe bars. You could use it for any kind of MTF indicator where you want to know how many bars back you need on the low timeframe to achieve the higher timeframe equivalent. For example, if you wanted to create a multi-timeframe moving average, you would use the output as the length of the moving average.
I used a tuple output for the purpose of demonstration, but this can be reduced to a single relevant output.
Hope you find it useful. It's nice when you don't have to fight against multiple resolutions.
Let me know what you think. Is there a better way to go about it?
Trade well.
ค้นหาในสคริปต์สำหรับ "bar"
NSDT Heiken-Ashi Direction Bar MTFA simple script that places a bar at the bottom of the chart to indicate the direction of Heiken-Ashi candles - while still using traditional candles on the main chart. Try setting the bar on a higher timeframe to see the overall direction of the trend, while using traditional candles for entries/exits.
EMA Cross 9,21,50,80,200 + Inside barEste script faz o seguinte:
1. Plota 5 EMAs (9,21,50,80,200)
2. Faz crossover da 9x21 e 21x50
3. Colore inside bar em amarelo (é possível ainda colorir diferentemente bullish e bearish inside bar)

Past and Upcoming Forex and NYSE Start/End Bar HighlighterThis script highlights the start and end of past sessions and also for upcoming sessions of the current day. Additionally, the start/end bars of the current day can be marked with a text label.
Time zone parameters are available for all time parameters, so that local exchange times can be configured, without the need for manual time zone or daylight saving time (DST) adjustments. Tradingview’s internal time calculations take care of the conversion.
For ease of use, the script comes preconfigured with the start/end times of the Forex and NYSE trading sessions. If you need more highlighted bars, just add the script multiple times and adapt the configuration as needed.


Lookback Highlight BarSimple script to highlight a bar X bars in the past. Default lookback is 59 bars.

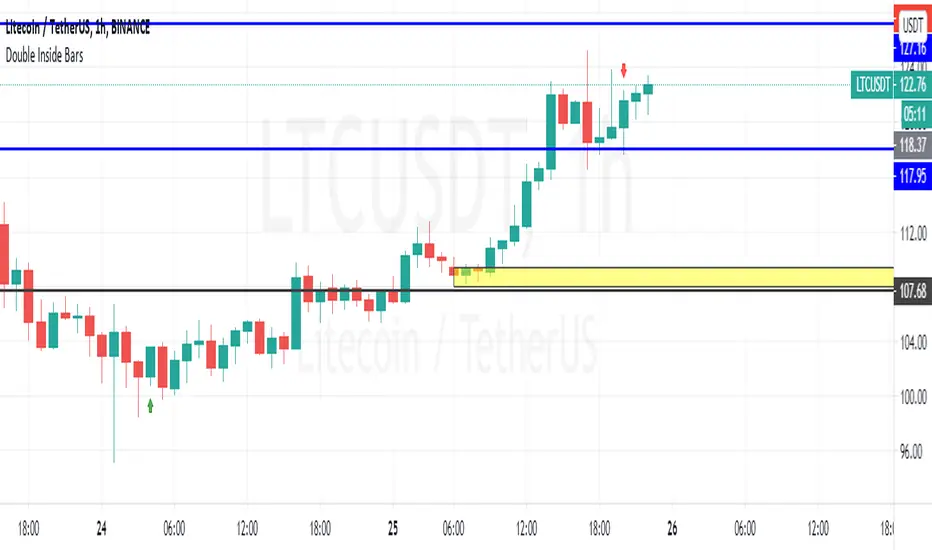
Double Inside BarsShows possible 4th bar movement direction based on 2 previous bars inside the 1st one
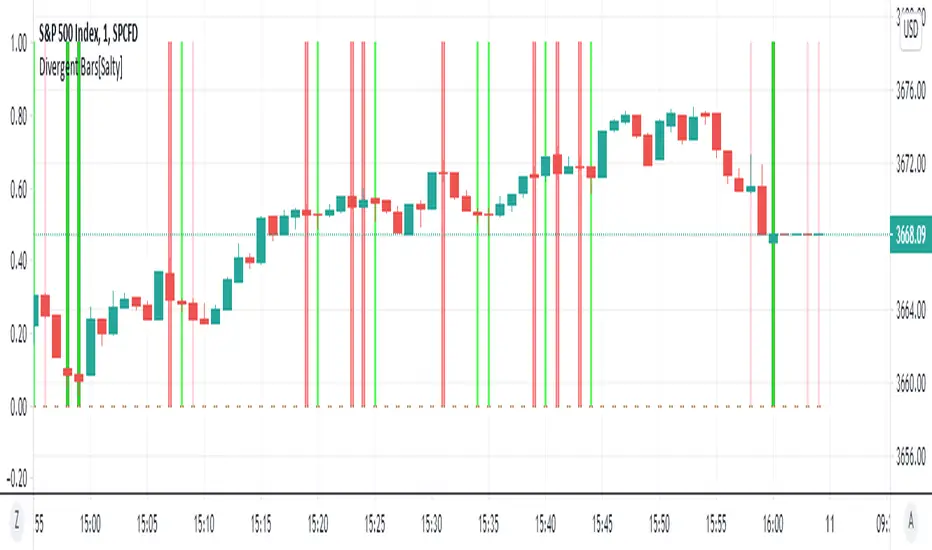
Divergent Bars[Salty]Updated an existing Divergent Bar script to be able to show all divergent bars. There are 2 set of divergent bars that can be turned on. The original one based on price and alligator lines, and a new second one that shows ALL divergent bars. The second set has lighter lines and colors to differentiate them from the filtered alligator divergent bars.
Trendy Bar Trend Color LiteLite version of the original Trendy Bar Trend Color
This will only color the candlestick body of your chart
Can be used with solid, hollow, renko, or any other chart type
Custom coloring for Highs, Lows, and consolidation is removed

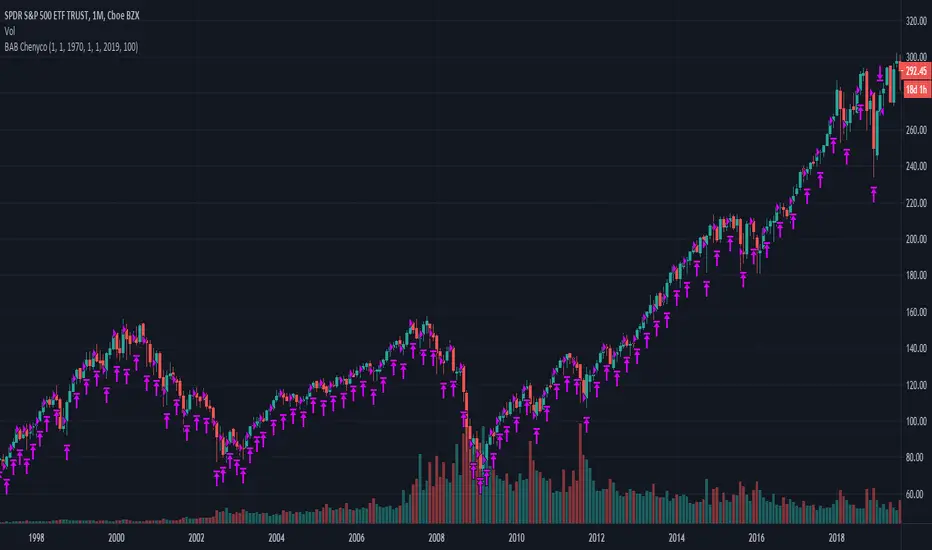
Buy Any Bar By ChenycoBuys amount of shares by bars with specified amount of money (100$ for a month bar for example).
Including commissions.
Volume on bar VSA - signalЭтот индикатор сравнивает объем со средним его значением и обозначает бар в зависимости от того какой хвост на баре, бычий или медвежий.
В настройках можно задать сигнальную линию (чувствительность) для подкрашивания объемов, если он превышает эту линию. (на графике красная линия)
Сигнальная линия задаётся в процентах от среднего объема за указанный период.
Серым цветом показан средний объем.
Google translate.
This indicator compares the volume with its average value and designates a bar depending on which tail on the bar is bullish or bearish.
In the settings, you can set a signal line (sensitivity) for tinting volumes, if it exceeds this line. (red line on the chart)
The signal line is set as a percentage of the average volume for the specified period.
Gray indicates the average volume.

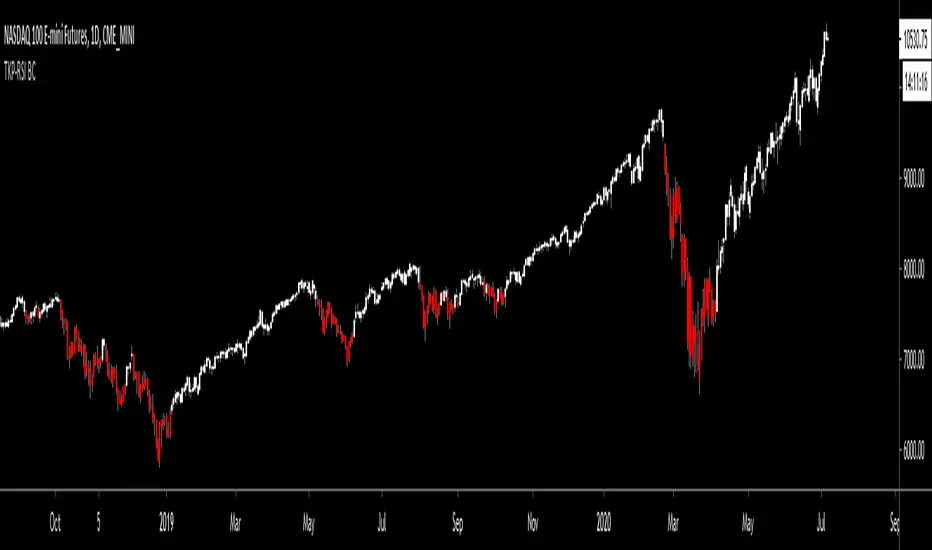
TKP RSI BAR COLORThis script was influenced by Scilentor's- "RSI Bar Colors / Scilentor". I improved upon the Idea by adding the ability to change the full range of RSI (Between 0 through 100) to any color you want within 5 point increments.
Traditional use of RSI is to use it as an "Overbought" and "Oversold" indicator. A more uncommon/unknown use, especially among new traders, is to use is as a "Momentum" indicator. I personally like to look for stocks where RSI>50
Default settings are set to color all bars red when below 50, and white when above 50, but try for your self setting different colors above 70, and below 30 to better see overbought and oversold conditions. I got a lot of requests for this script and I hope it helps you in your trading journey :-)
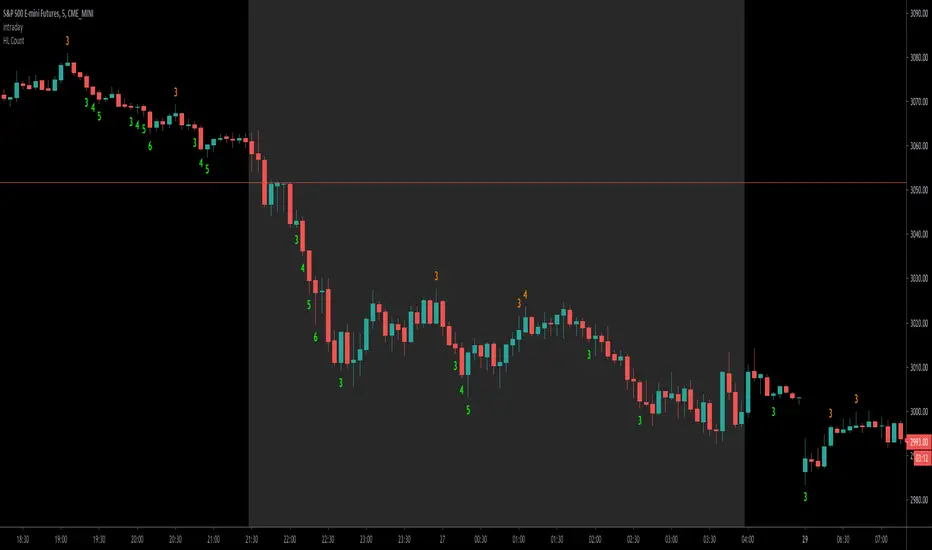
Higher High and Lower Low Bar CountThe importance of counting HH&LL is to find the possible extreme of the current leg and the potential reversal.
This script helps you count the number of bars which are constantly higher or lower than the previous ones.
I set the script to count from the first one, but only display the number from the third, in order to eliminate too much noise.
Note : I have loosened the criteria of HH and LL.
Let's take "higher high" as an example, I will count the number If the current bar's low is higher than the previous one's and its high is higher or equal to the previous one's , and vice versa.
If you prefer the strict definition of HH or LL, you can modify the code as you wish.
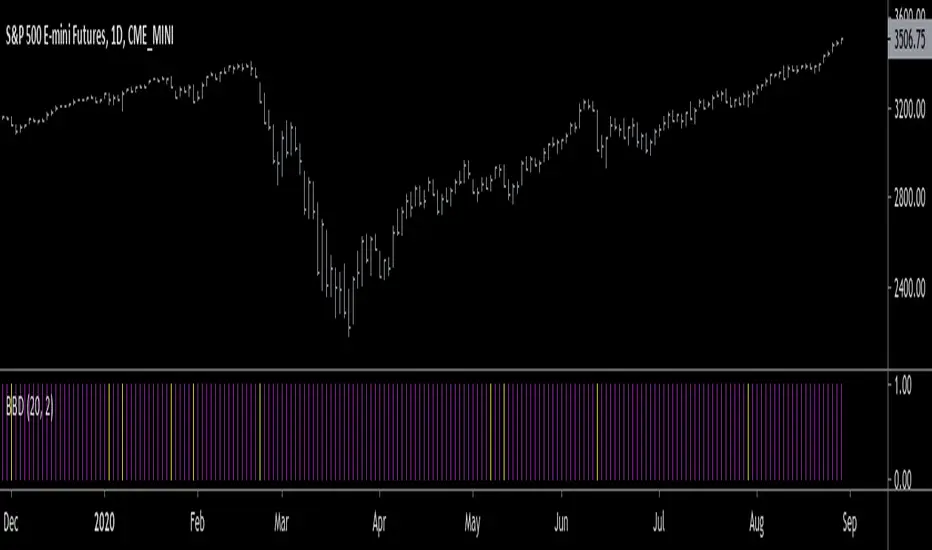
Big Bar DetectorYellow = Big Bar! (Trading is allowed)
Purple = Nothing special going on (No trading allowed)
BBD is meant to weed out all the little meaningless bars/candles that interfere with your trading.
BBD is not directionally biased, it only measures volatility.
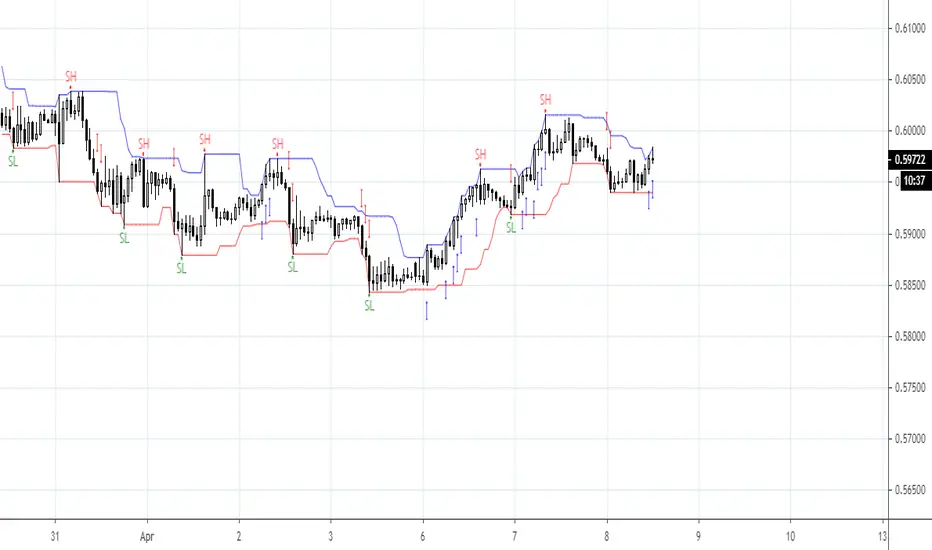
Number Bars High/Low BreakoutThis indicator is a visual representation of the price swing indicator and can be seen used alongside it. If both indicators are set at the same input settings the Swing Highs will show when there is a break of the blue line (which indicates the high of the previous "X" number of bars) and the Swing Lows will show when there is a break of the red line (which indicates the low of the previous "X" number of bars)

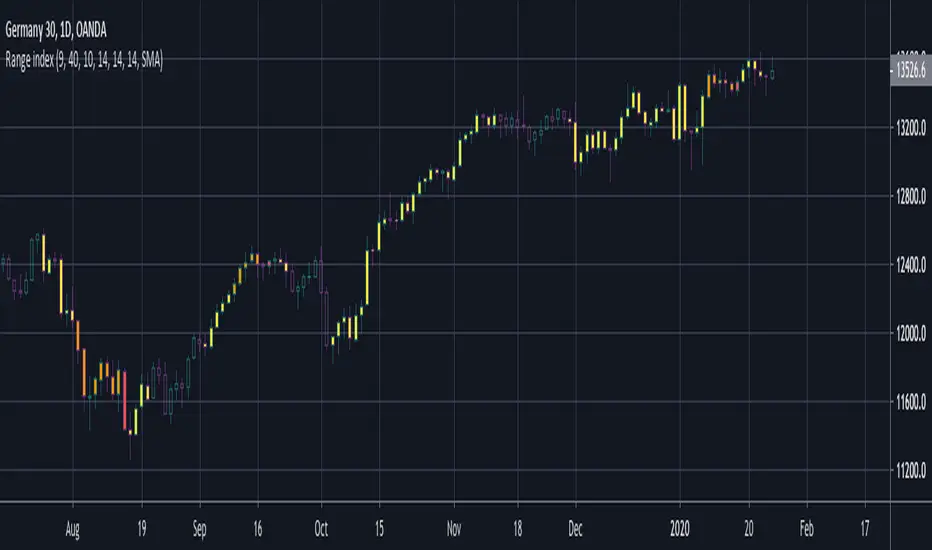
BERLIN Range Index | Bar color versionThe original problem: The choppiness index is great at finding ranging markets, but it is sometimes very slow, which means most of the time it only catches the end of a trend.
This indicator tries to solve this. It uses the choppiness index and filters it using a factor that is based on the standard deviation of the ATR.
The ATR based filter is calculated by first calculating the running standard deviation of the ATR, and then looking at that in relation to its recent low to find a filtering factor to use on the choppiness index. This makes the choppiness index more reactive to trends, but also slightly more likely to missidentify ranges.
This is the bar color version of the indicator. It changes the color of the bars when it it thinks the market is ranging and when it thinks it is trending.
Yellow = Trending
Transparent gray = Ranging
Trendy Bar Trend ColorTrendy Bar Trend Color
Inspired by trend candlestick charts on other trading platforms. Changes bar colors to stay in trend much like Heikin Ashi candles without the ATR price distortion. This is done by comparing the HL2 and/or Open-Close values of current candlestick to the prior candlestick.

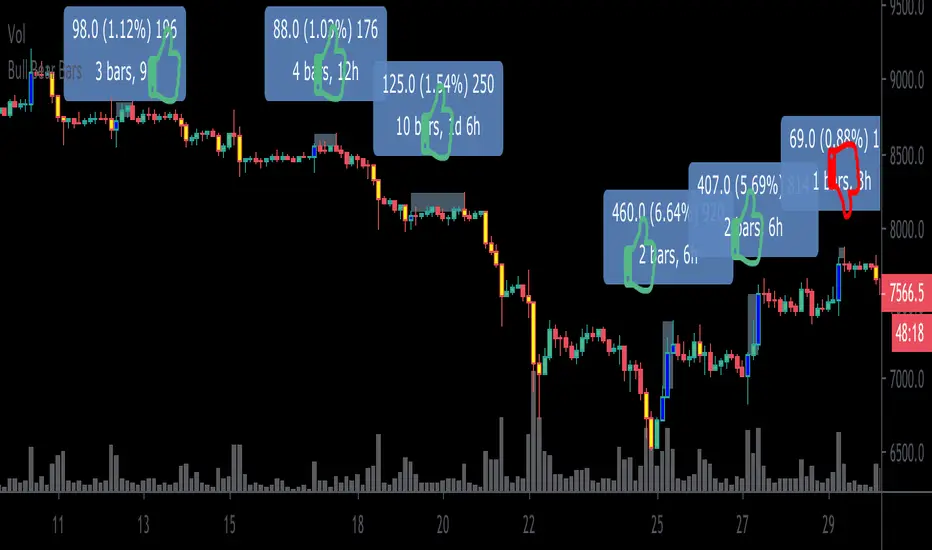
Bull Bear BarsHighlights when the movement of a candle is supported by a major increase in volume. Thus one could reasonably assume that a follow thru is likely to occur.
Blue= bullish
Yellow = bearish
I personally use this as an entry system. I enter only if the blue high or yellow low is surpassed by the very next candle , if not, then i do not enter. Thus trading with momentum and greatly avoiding choppy market conditions.
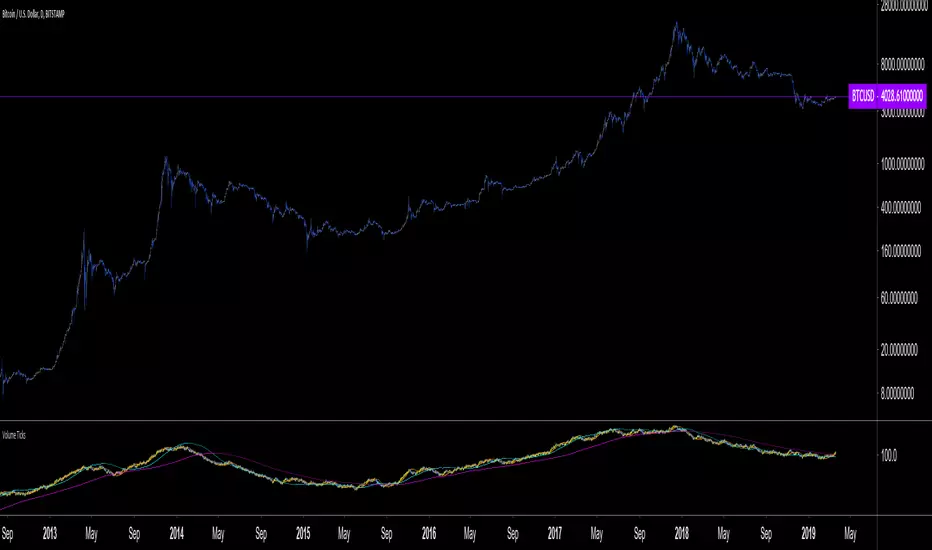
***Example*** In the chart above, during $XBT’s month long November 2019 Downtrend.. I am showing my bull long entries (without showing the obvious winning bear entries!) and found that only once did the price fail to advance less than 1% before any significant drawdown occurs (As shown on the chart by thumbs up & thumbs down symbols.)
***When using this indicator it is important to keep in mind that Blue bullish bars can and will appear at the top of upswings likewise, yellow bearish bars can and will appear at the bottom of downswings.. which could potentially signify trend reversals.
This knowledge can also can be used to ones advantage (” buy when everyone is selling, sell when everyone is buying.”)
This is a common occurrence because retail traders are often late to the party before they catch on to a trend resulting in buying heavily at the top and selling heavily at the bottom providing liquidity to earlier entrants to exit and as per usual the price then reverses on the mass of late bloomers.***
This indicator can be used in many different ways so goodluck in finding the method that best suits your style and be careful out there. Cheers
BONUS: Also has the ability to set alerts!
Combo Strategies 123 Reversal and 3-Bar-Reversal-Pattern This is combo strategies for get
a cumulative signal. Result signal will return 1 if two strategies
is long, -1 if all strategies is short and 0 if signals of strategies is not equal.
First strategy
This System was created from the Book "How I Tripled My Money In The
Futures Market" by Ulf Jensen, Page 183. This is reverse type of strategies.
The strategy buys at market, if close price is higher than the previous close
during 2 days and the meaning of 9-days Stochastic Slow Oscillator is lower than 50.
The strategy sells at market, if close price is lower than the previous close price
during 2 days and the meaning of 9-days Stochastic Fast Oscillator is higher than 50.
Secon strategy
This startegy based on 3-day pattern reversal described in "Are Three-Bar
Patterns Reliable For Stocks" article by Thomas Bulkowski, presented in
January,2000 issue of Stocks&Commodities magazine.
That pattern conforms to the following rules:
- It uses daily prices, not intraday or weekly prices;
- The middle day of the three-day pattern has the lowest low of the three days, with no ties allowed;
- The last day must have a close above the prior day's high, with no ties allowed;
- Each day must have a nonzero trading range.
WARNING:
- For purpose educate only
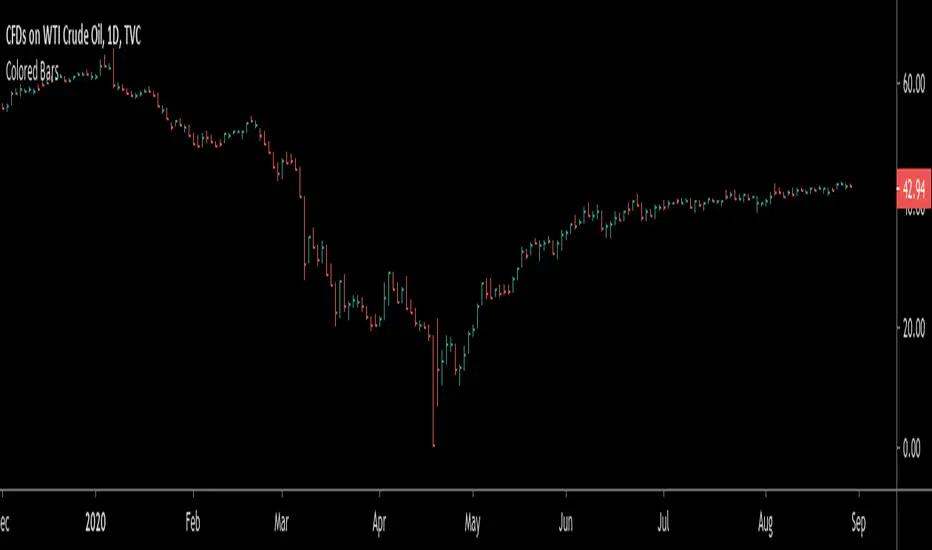
- This script to change bars colors.

Combo Strategies 123 Reversal and 3-Bar-Reversal-Pattern This is combo strategies for get
a cumulative signal. Result signal will return 1 if two strategies
is long, -1 if all strategies is short and 0 if signals of strategies is not equal.
First strategy
This System was created from the Book "How I Tripled My Money In The
Futures Market" by Ulf Jensen, Page 183. This is reverse type of strategies.
The strategy buys at market, if close price is higher than the previous close
during 2 days and the meaning of 9-days Stochastic Slow Oscillator is lower than 50.
The strategy sells at market, if close price is lower than the previous close price
during 2 days and the meaning of 9-days Stochastic Fast Oscillator is higher than 50.
Secon strategy
This startegy based on 3-day pattern reversal described in "Are Three-Bar
Patterns Reliable For Stocks" article by Thomas Bulkowski, presented in
January,2000 issue of Stocks&Commodities magazine.
That pattern conforms to the following rules:
- It uses daily prices, not intraday or weekly prices;
- The middle day of the three-day pattern has the lowest low of the three days, with no ties allowed;
- The last day must have a close above the prior day's high, with no ties allowed;
- Each day must have a nonzero trading range.
WARNING:
- This script to change bars colors.

Volume Ticks - Increasing Volume Bar Count [LucF]Volume Ticks is a zero-lag market sentiment indicator. It works by providing a cumulative count of increasing volume columns.
A one count is added for each increasing volume column where close>open, and one is subtracted on an increasing volume column if close