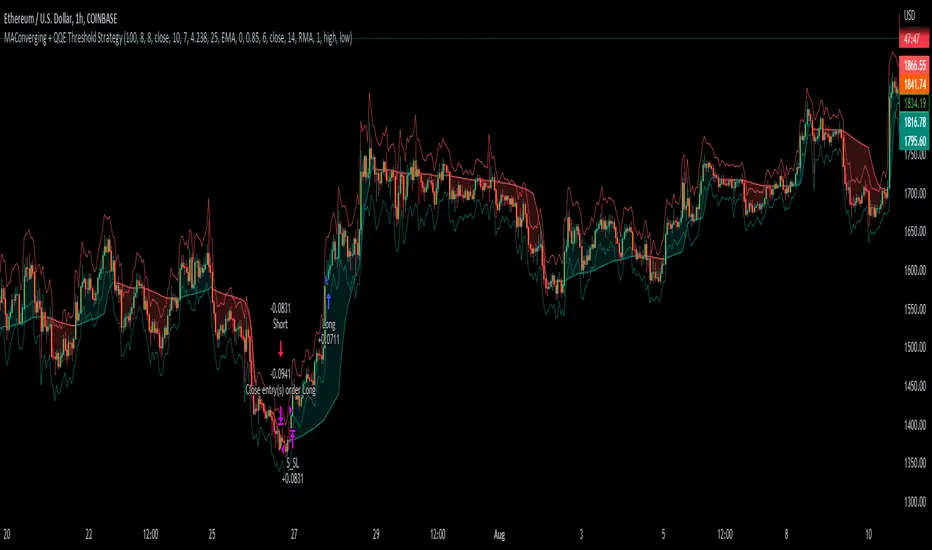
MAConverging + QQE Threshold This trading script is a trading strategy that is made up of 2 public indicators so credit goes to LuxAlgo and Jose5770. I have the 2 indicators listed below.
1) Moving Average Converging (LuxAlgo)
2) QQE Threshold (Jose5770)
This trading strategy is buying when the two indicators align, and then the take profit is the first red bar on the QQE Threshold histogram. It is not a set risk reward but instead a variable take profit strategy. I have the rules of the strategy listed below in order of how it works.
Long Position :
1. Wait for Moving Average Converging to be green
2. Candlestick is green from the QQE Threshold indicator
3. QQE Threshold histogram is green as well, then it enters the trade once we have these criteria met.
Take profit is the first red bar on the QQE Threshold histogram that appears and the trade will close.
Short Position :
1. Wait for Moving Average Converging to be red
2. Candlestick is red from the QQE Threshold indicator
3. QQE Threshold histogram is red as well, then it enters the trade once we have these criteria met.
Take profit is the first green bar on the QQE Threshold histogram that appears and the trade will close.
I hope everyone enjoys!
ค้นหาในสคริปต์สำหรับ "bar"
Martingale LOOKSUSDT 30MIN StrategyMy dear !
In the strategy itself:
The entry is made as a percentage of the deposit by price action.
The strategy will calculate the recent k-bar chart and place multiple orders according to the status of the bar。
There are additional purchases, they are set from the entry price for a given percentage in the opposite direction of the transaction.
The distance in percentage from the entry price, on which the additional purchase is exposed, is set in the Minopen parameter.
The Minopen parameter increases the initially purchased amount of the base traded cryptocurrency in each additional purchase.
The essence of the strategy is to trade a large number of pairs in order to diversify risks and obtain a stable income.
It is desirable to enter each trading pair with a small percentage of the deposit.
The optimization result shows the trading result for the period of 4800 bars (the platform does not give more history) on 5 of the deposit for the first transaction, the addition will also take place on initially bought amount of base traded cryptocurrency, multiplied by the martingale parameter, raised by the number of addition.

3C MACD & RSI Scalper no repaintThis is not a set and forget strategy. It needs constant tweaking to maintain a high winrate. Also what works on one pair can be horrible on another.
This strategy works best on the 1 min or 5 min TF but also works well on the 15 min. Haven't done any testing in higher TF's as im only interested in scalping.
If enabled you can retrive data on the MACD and RSI from any timeframe.
The strategy do not repaint.
You can filter on sessions as well as days. Often trading during say only the EU times and not trading during weekends yields better results. This is because weekeds and eg. the Asia Sessions are alot less volatile.
You do not need a 3c subscription to run this strategy as the bot turns on and off the bot itself.
Instructions for the 3commas connector:
1. First, you need to prepare 3commas Long/Short bots that will only listen to custom TV signals.
2. Inputs for the 3commas bot can be found at the end of the user inputs.
3. Once you have entered the required details into the inputs, turn on 3commas comments. They should appear on the chart (looks messy).
4. Now you can add the alert where you should paste the 3commas Webhook URL: 3commas.io
5. For the alert message text insert the placeholder {{strategy.order.comment}} and delete the rest. 6. Once the alert is saved, you can turn off those 3commas comments to have a clearer chart.
7. With a new alert, the bot and trade should launch.
Long or Short trades are determined with a crossing of the fast MA over the slow MA for Long and the opposite for Short. Trades should only happen close to the crossovers.
You can select from various different MA's and of course lenghts. I often find that using HEMA as the fast MA and DEMA as the slow give more trades while also maintaining a high winrate.
Then for Long we use the MACD indicator where we look for high peaks in negative values for Long and vice versa for Shorts. These should be significantly higher than other peaks (or if you will lower peaks for a Long).
The key is to detect high peaks on the histogram, which we will try to achieve by checking if the last 2 values were higher than X bars back. If you want to make it even more specific, then you can turn on the additional checkbox which compares the current value to the average value of X bars back, and if it is greater than, say, 72% the value of the average then it's ok to enter the trade.
The RSI filter, sets the maximum RSI threshold for a long position and the minimum for a short. By default and what i recomend is that you enter Longs when RSI is above 50 and shorts when RSI are below 50.
-You can set confirmation of the trade direction with RSI, i.e. for Long the RSI must rise a specified number of bars back, vice versa for Short.
Enabling the pullback filter is great to avoid Longing tops and Shorting bottoms.
Whats ahead. I really want to incorporate RSI divergencies, but haven't figured out how yet. Any other ideas would be greatly appreciated.
Have a look at my other strategies. They are similar to this but works abit differently.
The 3 strike line and the engulfing candles are not something that has an impact on the script yet, and might never be. But i do like to turn them on for a visual to see if the trade the strategy opened is a good one.

Market First - Relative Strength/Weakness (the ZenBot strategy)This market-first trading strategy gives BUY, SHORT, and CLOSE signals based on volume, trend, and relative strength or weakness to the market (SPY by default, can be customized). This indicator is useful for signaling day-trade entries and exits for tickers that are strong (or weak) against the market.
Stocks that are showing relative strength (or weakness) to the market, are trending, and have decent movement generate a buy (or short) signal. When the trend runs out, a CLOSE signal is fired.
Potential profit (based on ATR) and actual profit is calculated, predicting the type of move expected
Unique 'stay in trade' logic helps prevent unnecessary CLOSE signals if a trend is likely to continue
A colored plot indicates the strength of the current trend and turns orange/red when the strength is weakened.
Crypto traders can uncheck 'Trade during market hours' for 24-hour trading, and should change the comparison ticker from SPY to BTCUSD or something similar for their market.
Enjoy!
KEY CONCEPTS
The three- and five-minute timeframes are used to establish and verify trend ( ADX /DI with custom logic)
Entries and exits are based on Parabolic SAR and confirmed on multiple timeframes, trend, and relative volume
Relative strength /weakness to the market compares ticker to SPY
Chop is avoided at all costs. I've experimented with choppiness indicator below 38, but found that the ADX DI+/- readings work even better.
Trend is established using ADX DI+/- readings over 20, confirmed by EMA 5/13 crossover and EMA5 slope
Signals will fire only if the average volume for the current 5-min bar is above normal
Only tickers with a five-bar / 13 period ATR of 1% the ticker's price generate signal.
Only longs above daily-anchored VWAP , shorts below daily-anchored VWAP
Signals fire on bar close to prevent repainting / look-ahead bias
Indicator labels and alerts generated
SIGNALS
BUY: up-trending tickers showing relative strength are bought on the three-minute PSAR
SELL: when the close price falls below the 1, 3, and 5-minute PSAR, or the ADX DI- falls below 20
SHORT: down-trending tickers with relative weakness are shorted on the three-minute PSAR
COVER: when the close price moves above the 1, 3, and 5-minute PSAR, or the ADX DI- falls below 20
ALERTS
Alerts are generated on BUY, SELL, SHORT, and COVER signals, as well as optional LOST RELATIVE STRENGTH and LOST RELATIVE WEAKNESS
INPUTS
Use relative strength /weakness comparison with the market : trigger trades based on the ticker's strength or weakness to the selected comparison ticker (usually SPY for equities or BTCUSD for crypto)
[* ]Comparison Ticker for relative strength /weakness : Ticker to compare against for relative strength /weakness
Trade during market hours only : Take buy/sells during specified hours. Disable this for crypto trading.
[* ]Market hours (market time) : Customize market hours - defaults to 9:30 to 16:00 EST
[* ]"Only trade very strong trends" : take trades only if an established trend is very strong ( ADX over 40 ) (DEFAULT = ON)
"Limit trade direction to VWAP" : Long trades only above VWAP , shorts below (DEFAULT = ON)
"Limit trade direction to Market direction" : Long trades only if SPY (or selected comparison ticker) is up, shorts if the market is down. (DEFAULT= ON)
"Limit trades based on a ticker's green/red status for the day" : Long trades if the ticker is green for the day, shorts if red. (DEFAULT = ON)

Buy/Sell on the levelsThis script is generally
My describe is:
There are a lot of levels we would like to buy some crypto.
When the price has crossed the level-line - we buy, but only if we have the permission in array(2)
When we have bought the crypto - we lose the permission for buy for now(till we will sell it on the next higher level)
When we sell some crypto(on the buying level + 1) we have the permission again.
There also are 2 protect indicators. We can buy if these indicators both green only(super trend and PIVOT )
Jun 12
Release Notes: Hello there,
Uncomment this section before use for real trade:
if array.get(price_to_sellBue, i) >= open and array.get(price_to_sellBue, i) <= close// and
//direction < 0 and permission_for_buy != 0
Here is my script.
In general - this is incredible simple script to use and understand.
First of all You can see this script working with only long orders, it means we going to get money if crypto grows only. Short orders we need to close the position on time.
In this script we buy crypto and sell with step 1% upper.
You can simply change the step by changing the price arrays.
Please note, if You want to see where the levels of this script is You Have to copy the next my indicator called LEVEL 1%
In general - if the price has across the price-level we buy some crypto and loose permission for buying for this level till we sell some crypto. There is ''count_of_orders" array field with value 2. When we bought some crypto the value turns to 0. 0 means not allowed to by on this level!!! The script buy if the bar is green only(last tick).
The script check every level(those we can see in "price_to_sellBue" array).
If the price across one of them - full script runs. After buying(if it possible) we check is there any crypto for sell on the level.
We check all levels below actual level( of actual level - ''i'' than we check all levels from 0 to i-1).
If there is any order that has value 0 in count of orders and index <= i-1 - we count it to var SELL amount and in the end of loop sell all of it.
Pay attention - it sells only if price across the level with red bar AND HAS ORDERS TO SELL WHICH WAS BOUGHT BELOW!!!
In Strategy tester it shows not-profitables orders sometimes, because if You have old Long position - it sells it first. First in - first out.
If the price goes down for a long time and You sell after 5 buys You sell the first of it with the highest value.
There is 2 protection from horrible buying in this strategy. The first one - Supertrend. If the supertrend is red - there is no permission for buy.
The second one - something between PIVOT and supertrend but with switcher.
If the price across last minimum - switcher is red - no permission for buy and the actual price becomes last minimum . The last maximum calculated for last 100 bars.
When the price across last maximum - switcher is green, we can buy. The last minimum calculation for last 100 bars, last maximum is actual price.
This two protections will save You from buying if price get crash down.
Enjoy my script.
Should You need the code or explanation, You have any ideas how to improve this crypt, contact me.
Vladyslav.
Jun 12
Release Notes: Here has been uncommented the protection for buy in case of price get down.
5 hours ago
Release Notes: Changed rages up to actual price to make it work

Customizable Non-Repainting HTF MACD MFI Scalper Bot Strategy v2Customizable Non-Repainting HTF MACD MFI Scalper Bot Strategy v2
This script was originally shared by Wunderbit as a free open source script for the community to work with. This is my second published iteration of this idea.
WHAT THIS SCRIPT DOES:
It is intended for use on an algorithmic bot trading platform but can be used for scalping and manual trading.
This strategy is based on the trend-following momentum indicator . It includes the Money Flow index as an additional point for entry.
This is a new and improved version geared for lower timeframes (15-5 minutes), but can be run on larger ones as well. I am testing it live as my high frequency trader.
HOW IT DOES IT:
It uses a combination of MACD and MFI indicators to create entry signals. Parameters for each indicator have been surfaced for user configurability.
Take profits are now trailing profits, and the stop loss is now fixed. Why? I found that the trailing stop loss with ATR in the previous version yields very good results for back tests but becomes very difficult to deploy live due to transaction fees. As you can see the average trade is a higher profit percentage than the previous version.
HOW IS MY VERSION ORIGINAL:
Now instead of using ATR stop loss, we have a fixed stop loss - counter intuitively to what some may believe this performs better in live trading scenarios since it gives the strategy room to move. I noticed that the ATR trailing stop was stopping out too fast and was eating away balance due to transaction fees.
The take profit on the other hand is now a trailing profit with a customizable deviation. This ensures that you can have a minimum profit you want to take in order to exit.
I have depracated the old ATR trailing stop as it became too confusing to have those as different options. I kept the old version for others that want to experiment with it. The source code still requires some cleanup, but its fully functional.
I added in a way to show RSI values and ATR values with a checkbox so that you can use the new an improved ATR Filter (and grab the right RSI values for the RSI filter). This will help to filter out times of very low volatility where we are unlikely to find a profitable trade. Use the "Show Data" checkbox to see what the values are on the indicator pane, then use those values to gauge what you want to filter out.
Both versions
Delayed Signals : The script has been refactored to use a time frame drop down. The higher time frame can be run on a faster chart (recommended on one minute chart for fastest signal confirmation and relay to algotrading platform.)
Repainting Issues : All indicators have been recoded to use the security function that checks to see if the current calculation is in realtime, if it is, then it uses the previous bar for calculation. If you are still experiencing repainting issues based on intended (or non intended use), please provide a report with screenshot and explanation so I can try to address.
Filtering : I have added to additional filters an ABOVE EMA Filter and a BELOW RSI Filter (both can be turned on and off)
Customizable Long and Close Messages : This allows someone to use the script for algorithmic trading without having to alter code. It also means you can use one indicator for all of your different alterts required for your bots.
HOW TO USE IT:
It is intended to be used in the 5-30 minute time frames, but you might be able to get a good configuration for higher time frames. I welcome feedback from other users on what they have found.
Find a pair with high volatility (example KUCOIN:ETH3LUSDT ) - I have found it works particularly well with 3L and 3S tokens for crypto. although it the limitation is that confrigurations I have found to work typically have low R/R ratio, but very high win rate and profit factor.
Ideally set one minute chart for bots, but you can use other charts for manual trading. The signal will be delayed by one bar but I have found configurations that still test well.
Select a time frame in configuration for your indicator calculations.
Select the strategy config for time frame (resolution). I like to use 5 and 15 minutes for scalping scenarios, but I am interested in hearing back from other community memebers.
Optimize your indicator without filters : customize your settings for MACD and MFI that are profitable with your chart and selected time frame calculation. Try different Take Profits (try about 2-5%) and stop loss (try about 5-8%). See if your back test is profitable and continue to optimize.
Use the Trend, RSI, ATR Filter to further refine your signals for entry. You will get less entries but you can increase your win ratio.
You can use the open and close messages for a platform integration, but I choose to set mine up on the destination platform and let the platform close it. With certain platforms you cannot be sure what your entry point actually was compared to Trading View due to slippage and timing, so I let the platform decide when it is actually profitable.
Limitations: this works rather well for short term, and does some good forward testing but back testing large data sets is a problem when switching from very small time frame to large time frame. For instance, finding a configuration that works on a one minute chart but then changing to a 1 hour chart means you lose some of your intra bar calclulations. There are some new features in pine script which might be able to address, this, but I have not had a chance to work on that issue.

Customizable Non-Repainting HTF MACD MFI Scalper Bot StrategyThis script was originally shared by Wunderbit as a free open source script for the community to work with.
WHAT THIS SCRIPT DOES:
It is intended for use on an algorithmic bot trading platform but can be used for scalping and manual trading.
This strategy is based on the trend-following momentum indicator . It includes the Money Flow index as an additional point for entry.
HOW IT DOES IT:
It uses a combination of MACD and MFI indicators to create entry signals. Parameters for each indicator have been surfaced for user configurability.
Take profits are fixed, but stop loss uses ATR configuration to minimize losses and close profitably.
HOW IS MY VERSION ORIGINAL:
I started trying to deploy this script myself in my algorithmic trading but ran into some issues which I have tried to address in this version.
Delayed Signals : The script has been refactored to use a time frame drop down. The higher time frame can be run on a faster chart (recommended on one minute chart for fastest signal confirmation and relay to algotrading platform.)
Repainting Issues : All indicators have been recoded to use the security function that checks to see if the current calculation is in realtime, if it is, then it uses the previous bar for calculation. If you are still experiencing repainting issues based on intended (or non intended use), please provide a report with screenshot and explanation so I can try to address.
Filtering : I have added to additional filters an ABOVE EMA Filter and a BELOW RSI Filter (both can be turned on and off)
Customizable Long and Close Messages : This allows someone to use the script for algorithmic trading without having to alter code. It also means you can use one indicator for all of your different alterts required for your bots.
HOW TO USE IT:
It is intended to be used in the 5-30 minute time frames, but you might be able to get a good configuration for higher time frames. I welcome feedback from other users on what they have found.
Find a pair with high volatility (example KUCOIN:ETH3LUSDT ) - I have found it works particularly well with 3L and 3S tokens for crypto. although it the limitation is that confrigurations I have found to work typically have low R/R ratio, but very high win rate and profit factor.
Ideally set one minute chart for bots, but you can use other charts for manual trading. The signal will be delayed by one bar but I have found configurations that still test well.
Select a time frame in configuration for your indicator calculations.
Select the strategy config for time frame. I like to use 5 and 15 minutes for scalping scenarios, but I am interested in hearing back from other community memebers.
Optimize your indicator without filters (trendFilter and RSI Filter)
Use the TrendFilter and RSI Filter to further refine your signals for entry. You will get less entries but you can increase your win ratio.
I will add screenshots and possibly a video provided that it passes community standards.
Limitations: this works rather well for short term, and does some good forward testing but back testing large data sets is a problem when switching from very small time frame to large time frame. For instance, finding a configuration that works on a one minute chart but then changing to a 1 hour chart means you lose some of your intra bar calclulations. There are some new features in pine script which might be able to address, this, but I have not had a chance to work on that issue.

"NoSKi Hammer/Star /w angle of ema Backtester % Applied the angle of ema filter to stars formed in an uptrend, and hammers in a downtrend to try to pick good trading entries
Uses the average angle of the ema over the last 20 bars
(Please note: the angle calculation default value is calibrated for BTCUSD . There is no way currently to code it to be used across multiple pairs. The price to bar ratio has to be adjusted for other trading pairs. Please research price to bar ratio if unfamiliar). I have used a rough calculation so it can be used on other charts but won't be 100% accurate
Strategy uses % take profit and stop loss settings, and only enters one trade at a time (wont show entry if already in a position).
Separate ATR settings for filtering the size of hammer and star candles. (can filter out candles which are too large or small)
Red background colour is for when ema is at or below the set -ve angle slope. Green is for positive angle. Default is set at -45 and 45 degrees.
Big thankyou to ZenAndTheArtOfTrading for hammer and star coding, and Cosmic Angle - by cosmic_indicators for calculating the angle of emas.
Code was borrowed and used directly from these scripts.

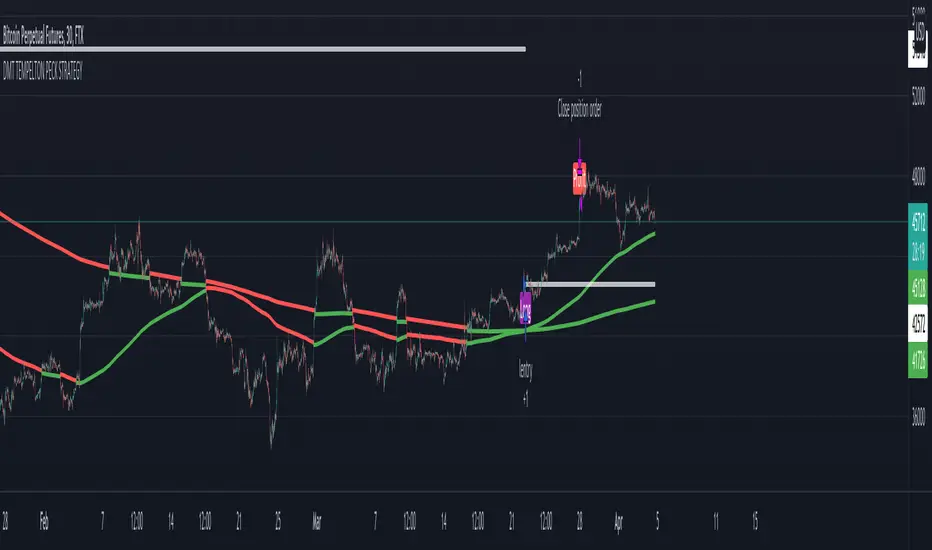
DMT TEMPELTON PECK STRATEGYIntroduction Templeton Peck Strategy Version .
Bring your A-game to the market in A-Team style with DMT Templeton Peck – you’ll love it when this plan comes together!
Using customized standard deviations between historic price action ranges and volume metrics, DMT Templeton Peck enables traders to never miss a change in trend.
In its default state, the DMT Templeton Peck Strategy displays key information, such as:
• Small trend line
• Large trend line
• Position entry prices
• Take profit levels
• Stop levels
• Buy and sell trend signals
In addition to providing core functionality for the indicator’s strategy signals, traders can use this data to enter or exit trades.
When price crosses both trend lines and consolidates there is a high probability that price will continue to move in the same direction. The most profitable results are achieved when trading in the direction of the current large time frame trend.
When small and large trend lines cross a trading signal is generated which can be used to automate trades. Please see the ‘TradingView Alerts’ section of this document for further details.
The Small & Large trend line’s display can be toggled, and their colors modified in the indicator’s style options as shown below.
Basic Strategy
In its simplest form, the strategy is to buy when the price crosses and consolidates above both trend lines and sell when the price crosses and consolidates below both trend lines.
Set amount of first entry to the inputs data.
You can add a commission fee.
Adjust initial capital for your needs.
How to Trade
Confident traders may choose to enter a long position at the point
#1 when the price passes above both trend lines and begins to consolidate.
However, the safer trade is to wait for the trend lines to cross at a point
#2 and then look for an entry in the direction of the local trend.
One price action begins to reverse to the downside the strategy reverses. Confident traders may choose to enter point
#3 when the price passes both trend lines and begins to consolidate once again under the previous price action structure that is now acting as resistance.
A sell signal is generated at the point
#4 which produced a small profit; however, a new short position could have been opened when the price retraced to resistance at a point
#5 and experienced a repeated number of strong rejections.
Do not worry if you miss a trade as there is often more than a single opportunity to enter – like at position #5 when price action retests the previous local price structure as resistance.
The indicator can be used on smaller time frames to scalp or find an entry after a larger time frame has signaled, however smaller time frames will also be “choppy” and should only be traded with a paper-tested strategy.
Traders should take profit on positions at resistance & support levels and look to have fully exited the trade by the time the price crosses back over both trend lines and/or loses a previously established price level.
Indicator Tuning
In its default state, the indicator is tuned for swing trades using 30 minute & 1 hour time frames, however, you are encouraged to experiment with the indicator options.
The input also allows you to set separately longs and shorts for a better view of the trend and to avoid hunts.
Large & Small Length options define how many historic candles are used for the calculation of the relevant trend line.
As a rule of thumb, larger time frames would use smaller values and smaller time frames would use larger values, ie. On a daily chart, a large and small length could be defined as 400 and 100 respectively.
Please be aware that there are limits to the amount of historical data for any intraday level based on your TradingView subscription level:
• Basic – 5000 bars/candles
• Pro & Pro+ - 10000 bars/candles
• Premium – 20000 bars/cables
TradingView Backtest
By utilizing TradingView backtest you can set a specific date for your analysis.
Template Trailing Strategy (Backtester)💭 Overview
+ Title: Template Trailing Strategy (Backtester)
+ Author: Iason Nikolas (jason5480)
+ License: CC BY-NC-SA 4.0
💢 What is the "Template Trailing Strategy (Backtester)" ❓
The "Template Trailing Strategy (Backtester)" (TTS) is a back-tester orchestration framework. It supercharges the implementation-test-evaluation lifecycle of new trading strategies, by making it possible to plug in your own trading idea.
While TTS offers a vast number of configuration settings, it primarily allows the trader to:
Test and evaluate your own trading logic that is described in terms of entry, exit, and cancellation conditions.
Define the entry and exit order types as well as their target prices when the limit, stop, or stop-limit order types are used.
Utilize a variety of options regarding the placement of the stop-loss and take-profit target(s) prices and support for well-known techniques like moving to breakeven and trailing.
Provide well-known quantity calculation methods to properly handle risk management and easily evaluate trading strategies and compare them.
Alert on each trading event or any related change through a robust and fully customizable messaging system.
All of the above makes TTS a practical toolkit: once you learn it, many repetitive tasks that strategy authors usually re-implement are eliminated. Using TradingView’s built-in backtesting engine makes testing and comparing ideas straightforward.
By utilizing the TTS one can easily swap "trading logic" by testing, evaluating, and comparing each trading idea and/or individual component of a strategy.
Finally, TTS, through its per-event alert management (and debugging) system, provides an automated solution that supports live trading with brokers via webhooks.
NOTE: The "Template Trailing Strategy (Backtester)" does not dictate how you can combine different indicator types. Thus, it should not be confused as a "Trading System", because it gives its user full flexibility on that end (for better or worse).
💢 What is a "Signal Indicator" ❓
"Signal Indicator" (SI) is an indicator that can output a "signal" that follows a specific convention so that the "Template Trailing Strategy (Backtester)" can "understand" and execute the orders accordingly. The SI realizes the core trading logic signaling to the TTS when to enter, exit, or cancel an order. A SI instructs the TTS "when" to enter or exit, and the TTS determines "how" to enter and exit the position once the Signal Indicator generates a signal.
A very simple example of a Signal Indicator might be a 200-day Simple Moving Average Signal. When the price of the security closes above the 200-day SMA, a SI would provide TTS with a "long entry signal". Once TTS receives the "long entry signal", the TTS will open a long position and send an alert or automated trade message via webhook to a broker, based on the Entry settings defined in TTS. If the TTS Entry settings specify a "Market" order type, then the open long position will be executed by TTS immediately. But if the TTS Entry settings specify a "Stop" order type with a 1% Stop Distance, then when the price of the security rises by 1% after the "long entry signal" occurs, the TTS will open a long position and the Long Entry alert or webhook to the broker will be sent.
🤔 How to Guide
💢 How to connect a "signal" from a "Signal Indicator" ❓
The "Template Trailing Strategy (Backtester)" was designed to receive external signals from a "Signal Indicator". In this way, a "new trading idea" can be developed, configured, and evaluated separately from the TTS. Similarly, the SI can be held constant, and the trading mechanics can change in the TTS settings and back-tested to answer questions such as, "Am I better with a different stop loss placement method, what if I used a limit order instead of a stop order to enter, what if I used 25% margin instead of trading spot market?"
To make that possible by connecting an external signal indicator to TTS, you should:
Add both your SI (e.g. "Two MA Signal Indicator" , "Click Signal Indicator" , "Signal Adapter" , "Signal Composer" ) and the TTS script to the same chart.
Open the script's Settings / Inputs dialog for the TTS.
In the 🛠️ STRATEGY group set 𝐃𝐞𝐚𝐥 𝐂𝐨𝐧𝐝𝐢𝐨𝐧𝐬 𝐌𝐨𝐝𝐞 to 🔨External (this makes TTS listen to an external signal source).
Still inside 🛠️ STRATEGY locate the 🔌𝐒𝐢𝐠𝐧𝐚𝐥 🛈 input and choose the plotted output of your SI. The option should look like: "<SI short title>:🔌Signal to TTS" .
Verbose troubleshooting & tips
If the SI does not appear in the 🔌Signal 🛈 selector, confirm both scripts are added to the same chart and the SI exposes a plotted series (title often "🔌Signal to TTS").
When using multiple SIs, pick the SI instance that actually outputs the "🔌Signal to TTS" plotted series.
Validate on the chart: when your SI changes state, the plotted "🔌Signal" series in the TTS (visible in the data window) should change accordingly.
The TTS accepts only signals that follow the tts_convention DealConditions structure. Do not attempt to feed arbitrary scalar series without using conv.getDealConditions / conv.DealConditions.
Make sure your SI composes a DealConditions value following the TTS convention (startLong, endLong, startShort, endShort — optional cancel fields). See the template below.
If the plot is present but TTS does not react, ensure the SI plot is non-repainting (or accept realtime/backtest limitations). Test on historical bars first.
Create alerts on the strategy (see the Alerts section). Use the {{strategy.order.alert_message}} placeholder in the Create Alert dialog to forward TTS messages.
💢 How to create a custom trading logic ❓
The "Template Trailing Strategy (Backtester)" provides two ways to plug in your custom trading logic. Both of them have their advantages and disadvantages.
✍️ Develop your own Customized "Signal Indicator" 💥
The first approach is meant to be used for relatively more complex trading logic. The advantages of this approach are the full control and customization you have over the trading logic and the relatively simple configuration setup by having two scripts only. The downsides are that you have to have some experience with pinescript or you are willing to learn and experiment. You should also know the exact formula for every indicator you will use since you have to write it by yourself. Copy-pasting from existing open-source indicators will get you started quite fast though.
The idea here is either to create a new indicator script from scratch or to copy an existing non-signal indicator and make it a "Signal Indicator". To create a new script, press the "Pine Editor" button below the chart to open the "Pine Editor" and then press the "Open" button to open the drop-down menu with the templates. Select the "New Indicator" option. Add it to your chart to copy an existing indicator and press the source code {} button. Its source code will be shown in the "Pine Editor" with a warning on top stating that this is a read-only script. Press the "create a working copy". Now you can give a descriptive title and a short title to your script, and you can work on (or copy-paste) the (other) indicators of your interest. Once you have the information needed to decide, define a DealConditions object and plot it like this:
import jason5480/tts_convention/ as conv
// Calculate the start, end, cancel start, cancel end conditions
dealConditions = conv.DealConditions.new(
startLongDeal = ,
startShortDeal = ,
endLongDeal = ,
endShortDeal = ,
cnlStartLongDeal = ,
cnlStartShortDeal = ,
cnlEndLongDeal = ,
cnlEndShortDeal = )
// Use this signal in scripts like "Template Trailing Strategy (Backtester)" and "Signal Composer" that can utilize its value
// Emit the current signal value according to the TTS framework convention
plot(series = conv.getSignal(dealConditions), title = '🔌Signal to TTS', color = #808000, editable = false, display = display.data_window + display.status_line, precision = 0)
You should import the latest version of the tts_convention library and write your deal conditions appropriately based on your trading logic and put them in the code section shown above by replacing the "…" part after "=". You can omit the conditions that are not relevant to your logic. For example, if you use only market orders for entering and exiting your positions the cnlStartLongDeal, cnlStartShortDeal, cnlEndLongDeal, and cnlEndShortDeal are irrelevant to your case and can be safely omitted from the DealConditions object. After successfully compiling your new custom SI script add it to the same chart with the TTS by pressing the "Add to chart" button. If all goes well, you will be able to connect your "signal" to the TTS as described in the "How to connect a "signal" from a "Signal Indicator"?" guide.
🧩 Adapt and Combine existing non-signal indicators 💥
The second approach is meant to be used for relatively simple trading logic. The advantages of this approach are the lack of pine script and coding experience needed and the fact that it can be used with closed-source indicators as long as the decision-making part is displayed as a line in the chart. The drawback is that you have to have a subscription that supports the "indicator on indicator" feature so you can connect the output of one indicator as an input to another indicator. Please check if your plan supports that feature here
To plug in your own logic that way you have to add your indicator(s) of preference in the chart and then add the "Signal Adapter" script in the same chart as well. This script is a "Signal Indicator" that can be used as a proxy to define your custom logic in the CONDITIONS group of the "Settings/Inputs" tab after defining your inputs from your preferred indicators in the VARIABLES group. Then a "signal" will be produced, if your logic is simple enough it can be directly connected to the TTS that is also added to the same chart for execution. Check the "How to connect a "signal" from a "Signal Indicator"?" in the "🤔 How to Guide" for more information.
If your logic is slightly more complicated, you can add a second "Signal Adapter" in your chart. Then you should add the "Signal Composer" in the same chart, go to the SIGNALS group of the "Settings/Inputs" tab, and connect the "signals" from the "Signal Adapters". "Signal Composer" is also a SI so its composed "signal" can be connected to the TTS the same way it is described in the "How to connect a "signal" from a "Signal Indicator"?" guide.
At this point, due to the composability of the framework, you can add an arbitrary number (bounded by your subscription of course) of "Signal Adapters" and "Signal Composers" before connecting the final "signal" to the TTS.
💢 How to set up ⏰Alerts ❓
The "Template Trailing Strategy (Backtester)" provides a fully customizable per-event alert mechanism. This means that you may have an entirely different message for entering and exiting into a position, hitting a stop-loss or a take-profit target, changing trailing targets, etc. There are no restrictions, and this gives you great flexibility.
First enable the events you want under the "🔔 ALERT MESSAGES" module. Each enabled event exposes a text area where you can craft the message using placeholders that TTS replaces with actual values when the event occurs.
The placeholder categories (exact names used by the script) are:
Chart & instrument:
{{ticker}}
{{base_currency}}
{{quote_currency}}
Entry / exit / stop / TP prices & offsets:
{{entry_price}}
{{exit_price}}
{{stop_loss_price}}
{{take_profit_price_1}} ... {{take_profit_price_5}}
{{entry+_price}}, {{entry-_price}}, {{exit+_price}}, {{exit-_price}} — Optional offset helpers (computed using "Offset Ticks")
Quantities, percents & derived quantities:
{{entry_base_quantity}} — base units at entry (e.g. BTC)
{{entry_quote_quantity}} — quote amount at entry (e.g. USD)
{{risk_perc}} — % of capital risked for that entry (multiplied by 100 when "Percentage Range " is enabled)
{{remaining_quantity_perc}} — % of the initial position remaining at close/SL
{{remaining_base_quantity}} — remaining base units at close/SL
{{take_profit_quantity_perc_1}} ... {{take_profit_quantity_perc_5}} — % sold/bought at each TP
{{take_profit_base_quantity_1}} ... {{take_profit_base_quantity_5}} — base units closed at each TP
❗ Important: the per-event alert text is injected into the Create Alert dialog using TradingView's strategy placeholder:
{{strategy.order.alert_message}}
During the creation of a strategy alert, make sure the placeholder {{strategy.order.alert_message}} exists in the "Message" box. TradingView will substitute the per-event text you configured and enabled in TTS Settings/Inputs before sending it via webhook/notification.
Tip: For webhook/broker execution, set the proper "Condition" in the Create Alert dialog (for changing-entry/exit/SL notifications use "Order fills and alert() function calls" or "alert() function calls only" as appropriate).
💢 How to execute my orders in a broker ❓
To execute your orders in a broker that supports webhook integration, you should enable the appropriate alerts in the "Template Trailing Strategy (Backtester)" first (see the "How to set up Alerts?" guide above). Then you should go to the "Create Alert/Notifications" tab check the "Webhook URL" and paste the URL provided by your broker. You have to read the documentation of your broker for more information on what messages are expected.
Keep in mind that some brokers have deep integration with TradingView so a per-event alert approach might be overkill.
📑 Definitions
This section tries to give some definitions in terms that appear in the "Settings/Inputs" tab of the "Template Trailing Strategy (Backtester)"
💢 What is Trailing ❓
Trailing is a technique where a price target follows another "barrier" price (usually high or low) by trying to keep a maximum distance from the "barrier" when it moves in only one direction (up or down). When the "barrier" moves in the other direction the price target will not change. There are as many types of trailing as price targets, which means that there are entry trailing, exit trailing, stop-loss trailing, and take-profit trailing techniques.
💢 What is a Moonbag ❓
A Moonbag in a trade is the quantity of the position that is reserved and will not be exited even if all take-profit targets defined in the strategy are hit, the quantity will be exited only if the stop-loss is hit or a close signal is received. This makes the stop-loss trailing technique in a trend-following strategy a good candidate to take advantage of a Moonbag.
💢 What is Distance ❓
Distance is the difference between two prices.
💢 What is Bias ❓
Bias is a psychological phenomenon where you make decisions based on market sentiment. For example, when you want to enter a long position you have a long bias, and when you want to exit from the long position you have a short bias. It is the other way around for the short position.
💢 What is the Bias Distance of a price target ❓
The Bias Distance of a price target is the distance that the target will deviate from its initial price. The direction of this deviation depends on the bias of the market. For example, suppose you are in a long position, and you set a take-profit target to the local highest high. In that case, adding a bias distance of five ticks will place your take-profit target 5 ticks below this local highest high because you have a short bias when exiting a long position. When the bias is long the bias distance will be added resulting in a higher target price and when you have a short bias the bias distance will be subtracted.
⚙️ Settings
In the "Settings/Inputs" tab of the "Template Trailing Strategy (Backtester)", you can find all the customizable settings that are provided by the framework. The variety of those settings is vast; hence we will only scratch the surface here. However, for every setting, there is an information icon 🛈 where you can learn more if you mouse over it. The "Settings/Inputs" tab is divided into ten main groups. Each one of them is responsible for one module of the framework. Every setting is part of a group that is named after the module it represents. So, to spot the module of a setting find the title that appears above it comes with an emoji and uppercase letters. Some settings might have the same name but belong to different modules e.g. "Tgt Dist Mtd" (Target Distance Method). Some settings are indented, which means that they are closely related to the non-indented setting above. Usually, indented settings provide further configuration for one or more options of the non-indented setting above. The groups that correspond to each module of the framework are the following:
🗺️ Quick Module Cross-Reference (use emojis to jump to setting groups)
📆 FILTERS — session, date & weekday filters
🛠️ STRATEGY — internal vs external deal-conditions; pick the signal source
🔧 STRATEGY – INTERNAL — built-in Two MA logic for demonstration purposes
🎢 VOLATILITY — ATR / StDev update modes
🔷 ENTRY — entry order types & trailing
🎯 TAKE PROFIT — multi-step TP and trailing rules
🛑 STOP LOSS — stop placement, move-to-breakeven, trailing
🟪 EXIT — exit order types & cancel logic
💰 QUANTITY/RISK MANAGEMENT — position sizing, moonbag, limits
📊 ANALYTICS — stats, streaks, seasonal tables
🔔 ALERT MESSAGES — per-event alert templates & placeholders
😲 Caveats
💢 Does "Template Trailing Strategy (Backtester)" have repainting behavior? ❓
The answer is that the "Template Trailing Strategy (Backtester)" does not repaint as long as the "Signal Indicator" that is connected also does not repaint. If you developed your own SI make sure that you understand and know how to prevent this behavior. The publication by @PineCoders here will give you a good idea on how to avoid most of the repainting cases.
⚠️ There is an exception though, when the "Enable Trail⚠️💹" checkbox is checked, the Take Profit trailing feature is enabled, and a tick-based approach is used, meaning that after a while, when the TradingView discards all the real-time data, assumptions will be made by the backtesting engine that will cause a form of repainting. To avoid making false assumptions please disable this feature in the early stages and evaluate its usefulness in your strategy later on, after first confirming the success of the logic without this feature. In this case, consider turning on the bar magnifier feature. This way you will get more accurate backtest results when the Take Profit trailing feature is enabled.
💢 Can "Template Trailing Strategy (Backtester)" satisfy all my trading strategies ❓
While this framework can satisfy quite a large number of trading strategies there are cases where it cannot do so. For example, if you have a custom logic for your stop-loss or take-profit placement, or if you want to dollar cost average, then it might be better to start a new strategy script from scratch.
⚠️ It is not recommended to copy the official TTS code and start developing unless you are a Pine wizard! Even in that case, there is a stiff learning curve that might not be worth your time. Last, you must consider that I do not offer support for customized versions of the TTS script and if something goes wrong in the process you are all alone.
💝 Support & Feedback
For feedback, bug reports, or feature requests, contact me via TradingView PM or use the script comments.
Note: The author's personal links and contact are available on the TradingView profile.
🤗 Thanks
Special thanks to the welcoming community members, who regularly gave feedback all those years and helped me to shape the framework as it is today! Thanks everyone who contributed by either filing a "defect report" or asking questions that helped me to understand what improvements were necessary to help traders.
Enjoy!
Jason

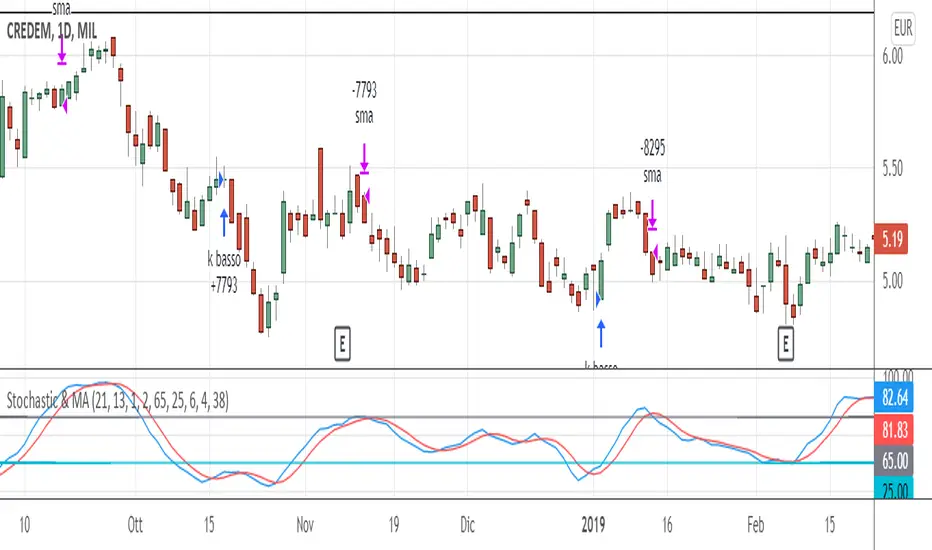
Stochastic & MAThis trading system comes from the experience of having a "fast" signal for entry at low prices (such as the stoscastic) and then "following" the stock with a "slower" indicator such as the exponential moving average. Both the input and output signals are filtered.
The use of the trading system only carries out long operations and has been tested on shares and ETFs, including indices, on daily bases (End Of Day).
ENTRY CONDITION: when stochastic's k is higher than d (on the default value of 21 periods) we enter the lower part of the oversold, to which we apply a filter or the confirmation that the closing of the day of the crossing is higher than that of the n -th previous bar (the 2nd previous bar recommended).
Other default settings are k = 6 and d = 4; the oversold level is also customizable (recommended = 25).
EXIT CONDITIONS: once the entry has "gone well", we follow the upward trend of the stock not with a stochastic oscillator - which tends to exit too soon, especially in case of strong trends - but with a simple moving average exponential (by default at 38 periods). Also in this case a filter is added, that is, k must be> to a filter threshold (recommended = 65) which is used to distinguish the decline between a "physiological" tracking. "(k drops" slowly "together with the approach of prices to the moving average) from a more" violent "tracking (prices are below the moving average and k consequently fall" suddenly ", in a few bars).
MONEY MANAGEMENT: 13% stop loss inserted (the physiological level of tracking of the shares is generally max 8-12% so we also consider a 1% margin due to trading). For more volatile stocks, the level can be extended to 20%.
LEVERAGE: the default value is equal to 1, but it is advisable, for simulations on shares, to use higher levers (x2, x3, ...) if you trade the relative CFD or on the index in case of buying and selling of Leveraged ETFs (e.g. LEVMIB which is 2x leveraged ETFs on Italian index).
Titan EMA Averaging Strategy - (DYOR) By MrCryptoTitan EMA Averaging Strategy (VIP Only) Enable Longs or Shorts only Works With Crypto + Forex with correct back tested settings This is not set and forget. This requires you to back test and have relevant Risk Management in place.
The Strategy: The script uses 3EMA with engulfing candle to enter a trade in either short or long direction.
You will need to test the settings and adjust them so there isn't too many - re-entries and make sure you take profit big enough to not trigger on same candle.
When setting alerts you can use once per bar however this may trigger multiple alerts if the candle is moving very fast so this is not recommended. So doing once per bar close will mean entry is confirmed as bar is closed. You will need to select this in drop down menu.
- Max Trade Limit.
- All in one Alert. - Basically add syntax for example- Long/Take Profit/Re-entry/Emergency Stop. Then add one alert and select "Alert() function calls Only" Change Alert name to custom. That's it.
-Built-in Strategy tester.
- Trade Filter - Multi-MA Filters. - MA", "EMA", "WMA", "HullMA", "VWMA", "RMA", "DEMA", "TEMA", VWAP
- ADX Filter based on Level.
Please note when running this strategy you can only trade longs only or shorts only for this setup to be potentially profitable. Also note that setting unrealistic profit targets will make a loss. So it is very important to back test everything.
This Script does not use any Security functions. All indicators which are used part of the strategy are obtained from Trading View indicator Library and have source code has been changed to make this into Strategy.
Please Do Your Own Research before using this.
Anymore information please DM me directly

ReversionStrategyThis strategy aims to identify condition of exhaustion to trade market reversal. It uses multiple indicators to enter a position. It uses following indicator:
1. RSI
2. ATR
Functionality of the Multi-Indicator:
1. RSI:
If RSI value is more then 70(input parameter) then market is over-brought. When less than 30 (input parameter) then market is over sold. Over brought or over sold market are good to play reversal.
2. ATR:
If current bar atr is more than 20 period (input) atr then it indicates over extended move.
3. Candle structure:
If a big candle closes near (within 10%) to its high then it indicates exhaustion. Same when big candle closes near to lows.
The combination of above 3 identifies buy or sell condition. Stop loss is 1.5 times atr. These parameter are input.
Sell condition:
1. RSI is more than 70
2. Current bar ATR is more than 20 perios ATR
3. Candle closes within 10% of its high.
If above 3 conditions are met on a candle then it indicates exhaustion of up move and sell order should be opened on next candle.
Buy condition:
1. RSI is less than 30
2. Current bar ATR is more than 20 perios ATR
3. Candle closes within 10% of its lows.
If above 3 conditions are met on a candle then it indicates exhaustion of down move and buy order should be opened on next candle.

action zone - ATR stop reverse order strategy v0.1 by 9nckACTION ZONE-ATR MOD v0.1 DOCUMENTATION
Overview
This tradingview pine script strategy is mainly created to enrich my coding skill. It is a combination of “CDC-ACTIONZONE” and my personal studies of trading techniques in various sources e.g.book, course or blog. This strategy purposefully built to connect with my automatic trading bot. However, It will be very useful to aid your trading routine by diminishing mental distraction which possibly leads to bad trades.
How does it work?
This strategy will do a basic simple thing that most traders do by creating entry signals on both sides long/short and also set the stop loss. Furthermore, It will also reverse the order (from long to short and vice versa (if long/short conditions are met). Finally, it will recalculate the stop loss/take profit price in every complete bar to increase the chance of winning and limit our loss.
Entry rules(Long/Short)
If you have no open order, an order will be created when a fast EMA crosses(up(long)/down(short) the slow EMA(It’s as simple as that).
If you have an open order, the current order will be (sold if long, covered if short) and the opposite side order will be created.
Exit and Reverse rules(Long/Short)
If fast EMA cross (DOWN(long), UP(short)), the current order will be closed, THE OPPOSITE SIDE ORDER WILL ALSO BE CREATED.
Risk management
FLEX STOP PRICE : initial value will be set at the bar which order created. It is a fast ema (+/-) MIDDLE ATR value.
If MIDDLE ATR value rises, it will be our new stop price.
If MIDDLE ATR value falls, stop price unchanged
If Price OVERBOUGHT(long)/SOLD(short), LOW of that bar will be a new stop price.
Minimum position hold period
In order to eliminate risk of repeatedly open, close orders in sideway trends. Minimum hold period must be passed to start exit our position. However, It always respects stop loss prices. The value refers to the number of bars.
MUST READ!!!
This strategy uses only MARKET ORDER. If you trade with a bot, make sure you choose only enormous market cap tokens.
This strategy is bi-direction strategy. It will work best in the DERIVATIVE market.
It was initially designed to compete in the cryptocurrency market which has very high volume and volatility.
I only use this strategy in 1HR (acceptable change rate, optimum trade frequency)
How (should) we use it?
Choose crypto future pairs (recommend only top 10-15 market volume pairs in Binance, let’s say 1000M+ trade value)
Choose your time frame (1H is strongly recommended)
Setup your portfolio profile (Setting->Properties) such as Initial cap, order size, commission. DO NOT USE CAL ON EVERY TICK IT WILL CAUSE REPAINTING AND YOUR CAPITAL IS BLEEDING !!!
BACKTEST FIRST!! Back test is a combination of art, math and statis(and a bit of luck). You can apply to train and test methods or whatever you are familiar with. In my opinion, your test period should include UPTREND, SIDEWAY, DOWNTREND. Fine tune fast, slow ema first(my best ema length of 1H timeframe around 7-10, 17-22). Try to eliminate fault breakout trade and use other options only necessary. Hopefully we can use automatic optimization on Pine Script soon.
Don’t forget to turn off using a specific backtest date option to start your strategy.A
THIS IS NOT A PERFECT (OR EVEN PROFITABLE) STRATEGY. USE AT YOUR OWN RISK AND TRADE RESPONSIBLY. DYOR DUDE.

Holyscalp v.3 A MACD 15 min trading strategy,
I set two macd trends that must match in trend direction to be traded,
along with that they must follow the moving average trend set in place
the trades trigger with an atr stop loss indicator "atr+" by zedartoftrading to be exact
It automates fully through autoview/oanda broker
the ma breach settings look back however many bars set in place and see if the bars are closing in opposite trend to the moving average
*TIP get another chart with same forex pair and take and change the candle sticks to heikin candles and set chart to 1D and trade only with that trend for the 15min settings, you can disable short trades by setting the threshold limit to 1 and to disable long trades set threshold to -1
Dec 31, 2021
Release Notes: for my use only
an hour ago
Release Notes: It trades based on these parameters I set in place.
1. The long term macd trend and the short term macd trend must match
2. The atr+ can not be more than 3x the previous atr.
3. It must trade with the trend set in place, I have two moving averages to choose from, to disable the second moving average set it to 1.
4. Don't touch the hammer and star fib level leave at zero, need to code that separately
5. the MA breach looks back a certain amount of bars to try and stop trading while its consolidating. I set at 1:0
an hour ago
Release Notes: Just updated the default settings, Remember they are set for optimization for 15mins but the same rules and parameters still apply to longer time frames, just change the moving averages to your liking if you want to move up timeframes.

Combo 2/20 EMA & 3 Day Pattern This is combo strategies for get a cumulative signal.
First strategy
This indicator plots 2/20 exponential moving average. For the Mov
Avg X 2/20 Indicator, the EMA bar will be painted when the Alert criteria is met.
Second strategy
This startegy based on 3-day pattern reversal described in "Are Three-Bar
Patterns Reliable For Stocks" article by Thomas Bulkowski, presented in
January,2000 issue of Stocks&Commodities magazine.
That pattern conforms to the following rules:
- It uses daily prices, not intraday or weekly prices;
- The middle day of the three-day pattern has the lowest low of the three days, with no ties allowed;
- The last day must have a close above the prior day's high, with no ties allowed;
- Each day must have a nonzero trading range.
WARNING:
- For purpose educate only
- This script to change bars colors.
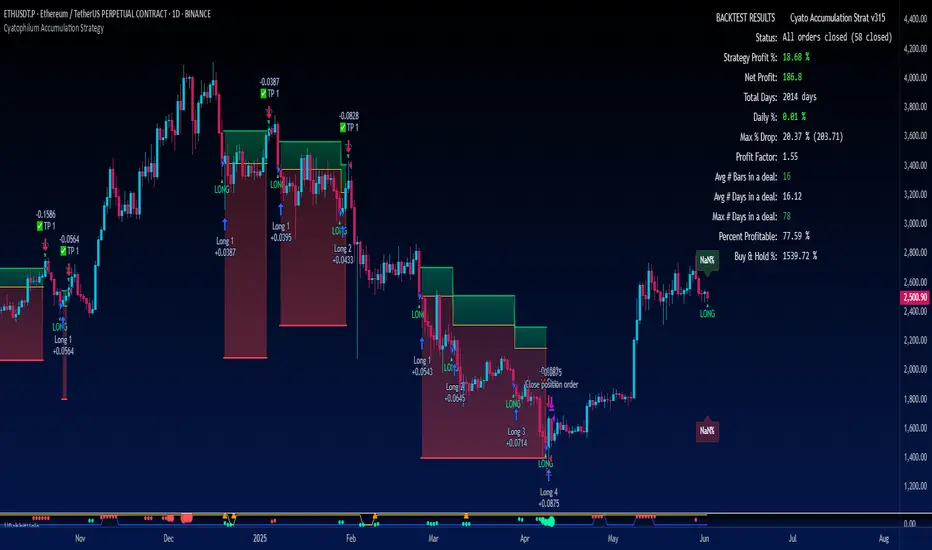
Cyatophilum Accumulation StrategyAn indicator to backtest and automate accumulation/pyramiding custom strategies.
The goal of the strategy is to buy several times when the price is low and sell all when the position is in profit.
Configure your strategy using the entry options and entry filters, then set your Take Profit and StopLoss.
═════════════════════════════════════════════════════════════════════════
█ HOW IT WORKS
The strategy has pyramiding enabled, which means it can open several deals in a row.
It will keep buying until the Take Profit target is reached.
The indicator plots the Take Profit and Break Even line which are recalculated at each new deal.
The target corresponds to the average entry price plus a configurable percentage.
We can see the average entry price line drop lower at each Long Entry.
█ HOW TO USE
Choose a pair that you want to hold/invest in.
Pick a chart time frame that you like, according to how often you want the strategy to place orders. A benefit of this strategy is that it can work on low time frames as well as high time frames. Just keep in mind that the smaller the time frame, the bigger the impact of fees and slippage will be on the strategy results.
Configure your entry condition . You can combine several technical indicators to trigger an entry, such as Top & Bottom, Higher Lows and RSI divergences.
Example with double bottoms:
Filter your entry signal . Add filters to strengthen your entry signal.
Configure your profit target
Use the Take Profit feature to set a target in percentage of price. You can also make it trail.
There is a Trailing Stop Loss feature but the goal of the strategy is to never sell in loss, so it is turned off by default.
Check your backtest parameters
Make sure that the initial capital and order size make sense. Since it is a pyramiding strategy, the sum of all deals should not be bigger than the initial capital.
In this example: Initial capital is 10 k, max active deals is 10, so the max order size is 1 k.
If you use % equity as order size, please note that it will create compounding.
Check the fees, by default they are set to 0.1%.
I also recommend to set a slippage that corresponds to your exchange's spread.
Note: the pyramiding parameter has to be equal to the "Max Active deals" input.
█ FEATURES
• Entry settings
Configure wether to go long or short, or both.
Choose the Max Active deals : the maximum number of deals that you want to open at once.
The Minimum bar delay between deals parameter will help putting space between deals.
• Trend Filter
The trend filter will fitler off long deals when the trend is bearish, and short deals when it is bullish.
Choose a trend line from a list, or any external trend line you can find.
The Trend condition allows to choose wether the trend should switch from slope change or price cross.
• MTF Trend Filter
A secondary trend line, Multi Time Frame.
• Volume Filter
The volume filter will check the bar volume and prevent the entry if it is too low.
• Stop Loss and Take Profit
Configure your stop loss and take profit for long and short trades.
You can also make a trailing stoploss and a trailing take profit.
• Backtest Settings
Choose a backtest period, longs or shorts, wether to use limit orders or not.
An option to close open orders at the current bar if you have multiple open orders and are wondering what it would result to close them now.
Graphics
A Configuration panel with all the indicator settings, useful for sharing/saving a strategy.
A Backtest Results panel with additional information from the strategy tester.
█ ALERTS
The indicator is using the alert() calls: it only uses 1 alert slot to send order messages for each event. This means free TV plans can create 1 complete strategy.
To set your alert messages, open the indicator settings and scroll to the bottom of the "inputs" tab.
Create your alert after you set the messages in the indicator settings, and make sure "Any alert() function call" is set in the alert option.
█ LIMITATIONS
Things to keep in mind when using this strategy.
• No Stop loss
When trading without stop loss, your equity can drop without limit, and it can take a while until price recovers.
This is why when backtesting I recommend to keep an eye on the "Max # Days in trades" statistic which tells the maximum days a trade took to close in profit.
• Spot markets only
Obviously, trading without stop loss means no leverage.
█ BACKTEST RESULTS
The backtest settings used in this snapshot are the following:
Initial Capital: 10 000€
Order size: 1 000 €
Commission: 0.1€ per order
Slippage : 10 ticks
Please read the author instructions below for access and automation.
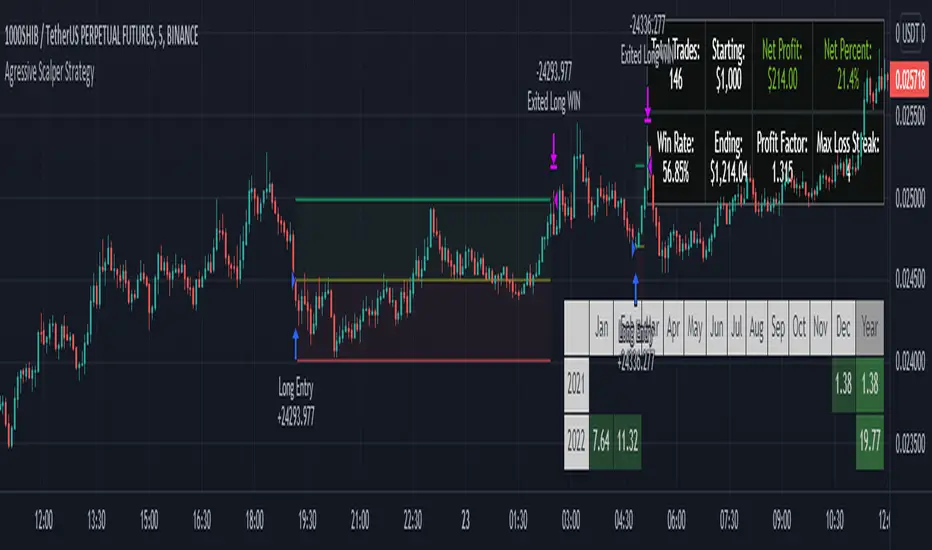
Agressive Scalper StrategyAfter many different tests and tries we found a strategy which is suited for people that likes to trade in shorter time frames. It uses multiple indications for entries. Entries include indications like Double ATR, Consolidation Detection, Dynamic RSI Calculation with Overbought and Oversold lines and also previous bars highs and lows. Although this strategy has been coded and tested on short time frames, after many additions it turns out it can be very profitable in every time frame if you play with the settings. Also it has some helpers for people that likes to optimize and see how their choices affects the outcome.
The strategy calculates the entry with the rules below:
LONG ENTRY RULES
- Price must be in consolidation zone
- Fast ATR Must be higher than Slow ATR
- Dynamic RSI must be below the oversold line (Green Line as Default)
- The Signal lookback must allow entry. (For example if you set signal lookback to 5, if the LOW of current price is LOWEST point of last 5 bars it is okay to enter LONG) If you check the lookback helper it will show you as green arrow at the bottom.
SHORT ENTRY RULES
- Price must be in consolidation zone
- Fast ATR Must be higher than Slow ATR
- Dynamic RSI must be above the overbought line (Red Line as Default)
- The Signal lookback must allow entry. (For example if you set signal lookback to 5, if the HIGHEST of current price is HIGHEST point of last 5 bars it is okay to enter SHORT) If you check the lookback helper it will show you as red arrow at the top.
This strategy has additional settings that are not available in indicator version that is previously released so i suggest everyone to use this instead.
Happy trading everyone!
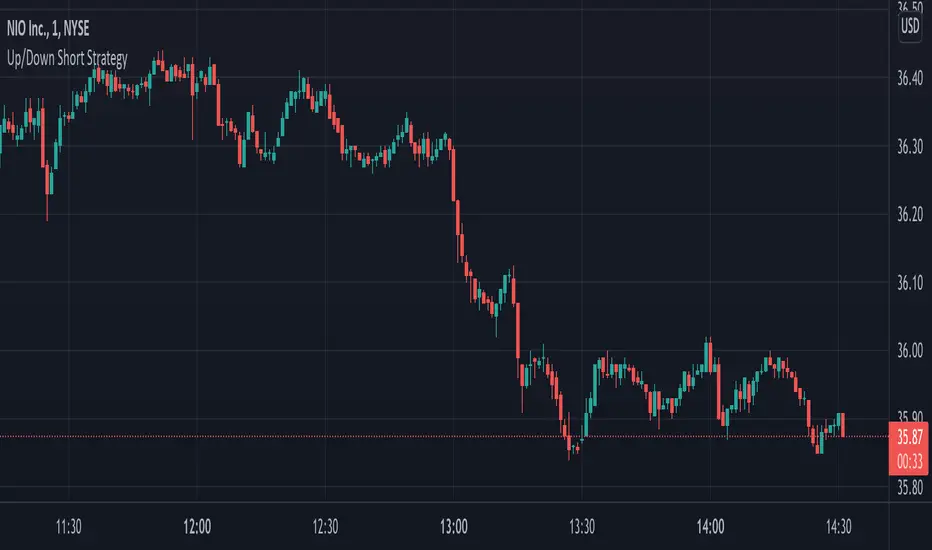
Up/Down Strategy - ContrarianThis is a consecutive bar up/down strategy for going long when the short condition is met or going short when the long condition is met. This is known in trading as taking contrarian signals and is helpful when an asset can provide only losses with a given strategy. In theory taking the opposing trade should produce a profit. With this strategy you can specify how many bars down to enter long and how many bars up to enter short. It also has code to check and make sure the condition is still true when launching the official alert, which helps back testing and live results line up, however be sure to enter commission and slippage into the properties to accurately reflect profits. I added back testing date ranges to this so you can easily pull up and see back tested results for a certain date range. I also added a buy and sell messages, close messages and take profit/stop loss message fields in the properties so you can launch alerts that will work with automated trading services. Simply enter your messages into those fields in the properties and then when you create an alert enter {{strategy.order.alert_message}} into the alert body and it will dynamically pull in your buy and sell messages when it fires alerts. I also added time restriction so you can enter trades only during the time frame specified. You can change it to any time frame, such at 0930-1600. Set the time restriction field to empty by default since otherwise the strategy won't take all trades like normal. So to enable time restriction enter a time frame in the format 0000-0000. I also added the ability to check off a box that will close the open trade at the end of the time restriction. So if you set the time frame to 0930-1600 and check off to enable close trade at end of time frame then it will look to exit the trade at the close of the next bar.

Orion Algo Strategy v2.0Hi everyone.
I decided to make the latest Orion Algo open to people. I don't have enough time to work on it lately, so I figured it would be best that everyone can have it to work on it. I took out some stuff from the original but it should give an idea on how things work. I made two strategies with this so far so you can use that to come up with your own. I recommend the DCA strategy because it gives you the most bang for Orion Algo's buck. It's pretty good at finding long entries.
Overall I hope you guys like this one. Also, Banano is the best crypto currency :)
-INFO-
Orion Algo is a trading algorithm designed to help traders find the highs and lows of the market before, during, and after they happen. We wanted to give an indicator to people that was simple to use. In fact we created the algorithm in such a way that it currently only needs a single input from the user. Since no indicator can predict the market perfectly, Orion should be used as just another tool (although quite a sharp one) for you to trade with. Fundamental knowledge of price action and TA should be used with Orion Algo.
Being an oscillator, Orion currently has a bias towards market volatility . So you will want to be trading markets over 30% volatility . We have plans to develop future versions that take this into account and adjust automatically for dead conditions. Also, while there are some similarities across all oscillators, what sets ours apart is the prediction curve. The prediction curve looks at the current signal values and gives it a relative score to approximate tops and bottoms 1-2 bars ahead of the signal curve. We also designed a velocity curve that attempts to predict the signal curve 2+ bars ahead. You can find the relative change in velocity in the Info panel. The bottom momentum wave is based on the signal curve and helps find overall market direction of higher time-frames while in a lower one.
Settings and How to Use them:
User Agreement – Orion Algo is a tool for you to use while trading. We aren’t responsible for losses OR the gains you make with it. By clicking the checkbox on the left you are agreeing to the terms.
Super Smooth – Smooths the main signal line based on the value inside the box. Lower values shift the pivot points to the left but also make things more noisy. Higher values move things to the right making it lag a bit more while creating a smoother signal. 8 is a good value to start with.
Theme – Changes the color scheme of Orion.
Dashboard – Turns on a dashboard with useful stats, such as Delta v, Volatility , Rsi , etc. Changing the value box will move the dashboard left and right.
Prediction – A secondary prediction model that attempts to predict a reversal before it happens (0-2bars). This can be noisy some times so make your best judgement. Curve will toggle a curve view of the prediction. Pivots will toggle bull/bear dots.
∆v – Delta v (change in velocity). This shows momentum of the signal. Crossing 0 signals a reversal. If you see the delta v changing direction, it may signify a reversal in the several bars depending on the overall momentum of the market.
Momentum Wave – Uses the signal as a macro trend indicator. Changes in direction of the wave can signify macro changes in the market. Average will toggle an averaging algorithm of the momentum waves and makes it easy to understand.
-STRATEGIES-
Simple - Just buy and sell on the dots
DCA - Uses the settings in the script for entries. If a buy dot appears then it will buy, if the price goes below the percentage it will wait for another dot before entering. This drastically improves DCA potential.

Up/Down Short StrategyThis is a consecutive bar up/down strategy for going short only where you can specify how many bars down to enter and how many bars up to exit. It also has code to check and make sure the condition is still true when launching the official alert, which helps back testing and live results line up, however be sure to enter commission and slippage into the properties to accurately reflect profits. I added back testing date ranges to this so you can easily pull up and see back tested results for a certain date range. I also added a buy and sell messages, close messages and take profit/stop loss message fields in the properties so you can launch alerts that will work with automated trading services. Simply enter your messages into those fields in the properties and then when you create an alert enter {{strategy.order.alert_message}} into the alert body and it will dynamically pull in your buy and sell messages when it fires alerts. I also added time restriction so you can enter trades only during the time frame specified. You can change it to any time frame, such at 0930-1600. Set the time restriction field to empty by default since otherwise the strategy won't take all trades like normal. So to enable time restriction enter a time frame in the format 0000-0000. I also added the ability to check off a box that will close the open trade at the end of the time restriction. So if you set the time frame to 0930-1600 and check off to enable close trade at end of time frame then it will look to exit the trade at the close of the next bar.
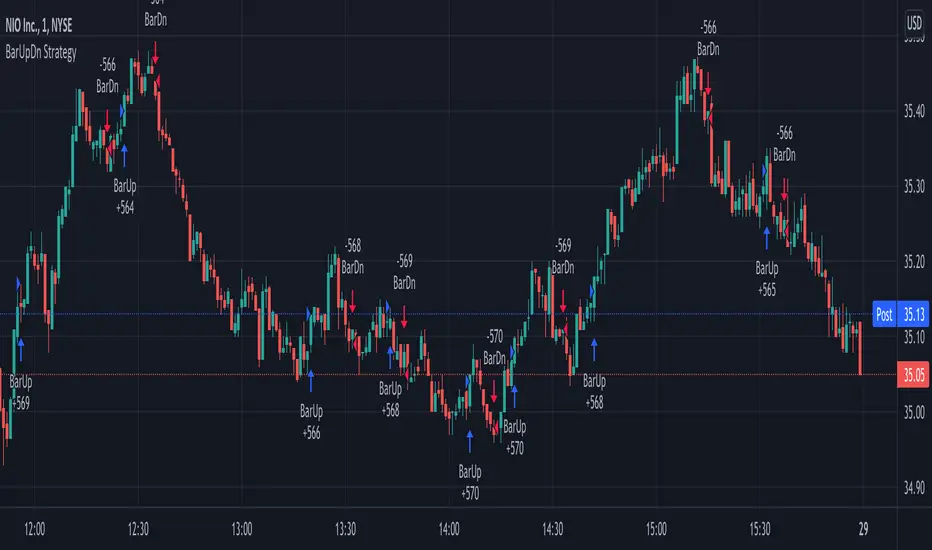
BarUpDn Long StrategyThis is a bar up/down strategy for going long only where you can specify how many bars up to buy and how many bars down to sell. It also has code to check and make sure the condition is still true when launching the official alert, which helps back testing and live results line up, however be sure to enter commission and slippage into the properties to accurately reflect profits. I added back testing date ranges to this so you can easily pull up and see back tested results for a certain date range. I also added a buy and sell message fields in the properties so you can launch alerts that will work with automated trading services. Simply enter your buy message and sell message into those fields in the properties and then when you create an alert enter {{strategy.order.alert_message}} into the alert body and it will dynamically pull in your buy and sell messages when it fires alerts.

BarUpDn StrategyThis is a bar up/down strategy where you can specify how many bars up to buy and how many bars down to sell. It also has code to check and make sure the condition is still true when launching the official alert, which helps back testing and live results line up, however be sure to enter commission and slippage into the properties to accurately reflect profits. I added back testing date ranges to this so you can easily pull up and see back tested results for a certain date range. I also added a buy and sell message fields in the properties so you can launch alerts that will work with automated trading services. Simply enter your buy message and sell message into those fields in the properties and then when you create an alert enter {{strategy.order.alert_message}} into the alert body and it will dynamically pull in your buy and sell messages when it fires alerts.