EMA Velocity Dual TF Momentum 1h (v2)BINANCE:SOLUSDT
The result is calculated on futures x10
### EMA Velocity Dual TF Momentum (v2) – Public Description
**Overview**
EMA Velocity Dual TF Momentum (v1) is a trend-following momentum strategy that uses the *speed of change* of Exponential Moving Averages (EMA) on two timeframes: the chart timeframe 1h.
The strategy looks for moments when both timeframes point in the same direction and the short‑term momentum is significantly stronger than usual, then manages trades with configurable ATR filtering, stop‑loss / take‑profit and early exit logic.
---
### Core Idea (high level, without formulas)
- On the **lower timeframe** (LTF), the strategy tracks how fast the EMA is moving (its “velocity”) and detects **impulse bars** where this velocity is unusually strong compared to its recent history.
- On the **higher timeframe** (HTF), it also measures EMA velocity and requires that the HTF trend direction is **aligned** with the LTF (both bullish or both bearish), if enabled.
- A **long trade** is opened when:
- LTF EMA velocity is positive (upward momentum),
- LTF momentum is strong enough (impulse),
- HTF EMA velocity is also upwards (if HTF filter is enabled),
- and ATR‑based volatility is above the minimum threshold.
- A **short trade** is opened in the symmetric situation (downward momentum on both timeframes).
- Positions are closed using configurable stop‑loss and take‑profit, and can be partially exited, moved to break‑even and trailed using early‑exit options.
---
### Inputs and Parameters
#### Trend & Momentum (Lower Timeframe)
- **`LTF EMA length (emaLenLTF)`**
Length of the EMA on the chart timeframe used to measure short‑term trend and momentum. Smaller values react faster; larger values are smoother and slower.
- **`LTF velocity lookback (velKLTF)`**
Lookback for computing EMA “velocity” on LTF. Controls how sensitive the momentum calculation is to recent price changes.
- **`LTF impulse lookback bars (impLookback)`**
Window size used to estimate the “normal” average absolute velocity. The strategy compares current momentum against this baseline to detect strong impulse moves.
- **`LTF |velocity| multiplier vs average (impMult)`**
Multiplier for defining what counts as a strong impulse. Higher values = fewer but stronger signals; lower values = more frequent, weaker impulses.
#### Trend & Momentum (Higher Timeframe)
- **`Use higher timeframe alignment (useHTF)`**
If enabled, trades are only taken when the higher‑timeframe EMA velocity confirms the same direction as the lower timeframe.
- **`HTF timeframe (htf_tf)`**
Higher timeframe used for confirmation (e.g. 60 minutes). Defines the “macro” context above the chart timeframe.
- **`HTF EMA length (emaLenHTF)`**
Length of the EMA on the higher timeframe. Controls how smooth and slow the higher‑timeframe trend filter is.
- **`HTF velocity lookback (velKHTF)`**
Lookback for the EMA velocity on HTF. Smaller values react quicker to changes in the higher‑timeframe trend.
#### Volatility / ATR Filter
- **`Use ATR filter (useAtrFilter)`**
Enables a volatility filter based on Average True Range. When active, trades are allowed only if market volatility is not too low.
- **`ATR Period (atrPeriod)`**
Lookback period for ATR calculation. Shorter periods react faster to recent volatility shifts; longer ones are more stable.
- **`ATR Min % for trading (atrMinPerc)`**
Minimum ATR as a percentage of price required to trade. Filters out very quiet, choppy periods where the strategy is more likely to be whipsawed.
#### Risk Management
- **`Use stops (SL/TP) (useStops)`**
Enables fixed stop‑loss and take‑profit exits. If disabled, positions are managed only by early exit logic and manual closing.
- **`Stop Loss % (stopLossPerc)`**
Distance of the protective stop from entry, in percent. Higher values give trades more room but increase risk per trade.
- **`Take Profit % (takeProfitPerc)`**
Distance of the primary profit target from entry, in percent. Controls the reward‑to‑risk profile of each trade.
#### Early Exit / Break‑Even / Trailing
- **`Enable early exit module (useEarlyExit)`**
Master switch for all early exit features: partial profit taking, break‑even stops and trailing exits.
- **`Take partial profit at +% (close 50%) (partialTP)`**
Profit level (in %) at which the strategy closes a partial portion of the position (e.g. 50%), locking in gains while leaving a runner.
- **`Trailing TP distance (%) (trailTP)`**
Distance (in %) for dynamic trailing stop after entry. When positive, the strategy trails the price to protect profits as the move extends.
- **`Break-even stop after +% profit (useBreakEven)`**
Enables automatic move of the stop to the entry price once a certain profit threshold is reached.
- **`Break-even activation (+%) (breakEvenPerc)`**
Profit level (in %) at which the stop is moved to break‑even. Higher values require a larger unrealized profit before break‑even protection kicks in.
#### Visuals
- **`Show labels (showLabels)`**
Toggles on‑chart labels that mark long and short entry signals for easier visual analysis.
- **`Label offset (labelOffset)`**
Horizontal offset (in bars) for placing labels relative to the signal bar. Used only for visual clarity; does not affect trading logic.
---
Если нужно, могу на основе этого текста сразу подготовить компактную версию (ограниченную по символам) специально под поле описания публичного скрипта в TradingView.
ค้นหาในสคริปต์สำหรับ "bar"

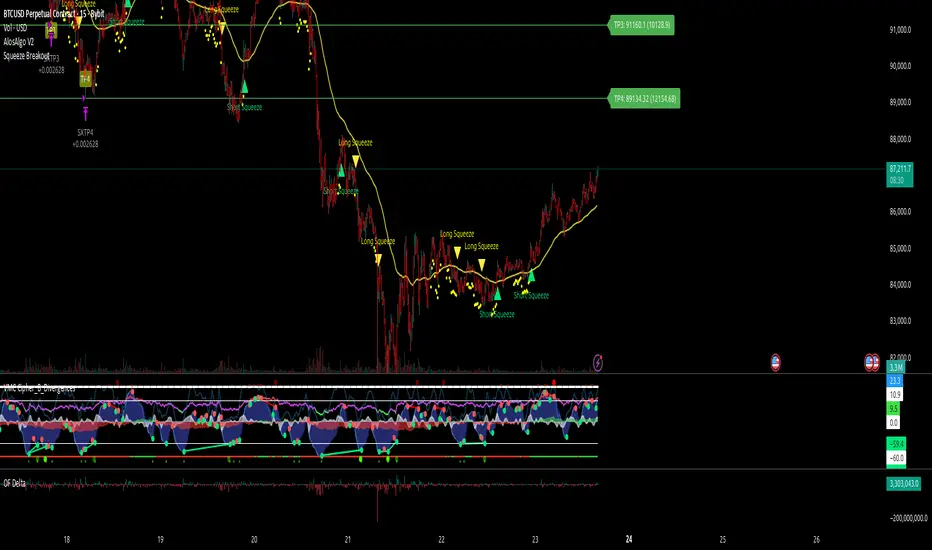
AlosAlgo V2 (BETA)— V2 BETA —
V2 – 2025-11-21 (Update)
• Rebuilt the core signal engine to remove repainting – higher-timeframe Heikin Ashi / Renko now use confirmed bars only for more stable signals & alerts.
• Added Trend Filter MA so longs are only taken above the MA and shorts only below (optional).
• Added MACD momentum filter and Price Action filter (Higher Low for longs, Lower High for shorts) to cut a lot of chop.
• Introduced a loss-streak “circuit breaker” – after X consecutive losing trades the strategy pauses for a set number of bars.
• New TP/SL engine with 2 modes: ATR-based or Fixed % moves, with 4 staged TPs plus an optional runner and break-even SL after TP2.
• Cleaned up TP/SL lines & labels so levels are fixed per trade and easier to read.
• General refactor for more realistic backtests, better live behaviour and easier parameter tuning compared to V1.
ABOUT
AlosAlgo V2 is a multi-timeframe trend + momentum strategy designed for BTC and other high-liquidity markets. It takes directional bias from a higher timeframe, then filters that bias with volatility, momentum and simple price-action structure before it ever opens a trade.
Purely rule-based, no AI / Bayesian / ML.
Core idea
– Use higher-timeframe structure for direction.
– Only trade when trend, momentum and basic price action agree.
– Manage exits with multiple TPs, an optional runner and a hard SL so risk is defined from the start.
Setups
Two main engines:
• Open/Close – Higher-timeframe Heikin Ashi body direction (close vs open) as the core trend signal.
• Renko – ATR-based Renko feed with EMA cross (fast vs slow) as the core trend signal.
Classic sideways filters (ATR + RSI) can be layered on top if you want to only trade in trending or ranging conditions.
Filters added in V2
• Trend Filter MA – Longs only above the MA, shorts only below (length configurable).
• Momentum Filter – Optional MACD filter; only takes longs when MACD is bullish and shorts when MACD is bearish.
• Price Action Filter – Optional HL/LH logic using pivots: longs after a Higher Low, shorts after a Lower High.
• Loss-Streak Circuit Breaker – After N losing trades in a row, the strategy pauses entries for a set number of bars to avoid bad regimes / tilt.
Risk & exits
Two TP/SL modes:
• ATR mode – SL and TP1–TP4 based on ATR at entry (stopFactor / profitFactor).
• Fixed % mode – SL and TP1–TP4 defined as % moves from entry.
On entry the strategy:
• Opens a single position.
• Places 4 staged TPs (TP1–TP4) with user-defined % sizing.
• Optionally leaves a “runner” managed only by SL and trend changes.
• Can move SL to break-even automatically after TP2 (toggle).
All TP/SL levels are locked at entry and drawn on the chart with labels so you can see exactly what the trade is trying to do.
Non-repainting behaviour
V2 is refactored to avoid the repainting behaviour that V1 used. Higher-timeframe and Renko data are taken from confirmed bars only, and entries are based on state (e.g. > / <) instead of repaint-prone crosses. Backtests are much closer to what you’ll see live, and alerts line up with executed trades more reliably.
How to use (suggested defaults)
• Setup: Open/Close
• TPSType: Fixed %
• Trend Filter: ON
• Momentum Filter: ON
• Price Action Filter: ON
• Sideways Filter: No Filtering
Then tweak TP/SL distances and filters per asset + timeframe, and forward-test before sizing up.
Disclaimer
This is not financial advice, not a guarantee of profit and not a “set and forget” money printer. Always forward-test, paper trade and tune risk before using real capital or automation. Markets change – this is a tool, not a promise.
V15.0 Adaptive Chameleon [Pro]
# **V15.0 Adaptive Chameleon – Strategy Description**
**Adaptive Chameleon** is a fully automated TradingView strategy powered by a signal engine based on multi-timeframe trend analysis, adaptive moving averages, and a volatility filter. The goal is to trade in the direction of a strong and confirmed trend, avoid opening trades in weak or manipulative price zones, and establish positions with a clearly defined risk/reward ratio.
---
## **1. General Logic and Philosophy**
The strategy divides tasks between two timeframes:
* **4-Hour Chart → Trend Manager (Boss)**
Determines the direction and strength of the trend.
* **4-Minute Chart → Entry Trigger (Operating Unit)**
Generates the ideal entry signal in the direction of the trend.
Thanks to this structure, the strategy both follows the long-term main direction and finds clear entries with low lag on smaller timeframes.
---
## **2. Trend Detection (4H)**
The strategy uses **KAMA (Kaufman Adaptive Moving Average)** and **ADX** to identify trends on the higher timeframe.
### **KAMA – Adaptive Trend Line**
* The KAMA is much more "smart" than traditional moving averages.
* It accelerates during price movements and decelerates during sideways movements.
* This allows for much clearer detection of trend direction.
### **ADX – Trend Strength Meter**
The strategy only opens trades when **trend strength** is rising (above the ADX average).
This prevents unnecessary trades when the trend is weak.
### **Trend Rules**
* Price above the KAMA → **Uptrend**
* Price below the KAMA → **Downtrend**
* ADX widening → **Trend strong**
The entry trigger is activated when these three conditions are met together.
---
## **3. Entry Engine (45m)**
On the 45-minute timeframe, the system uses the following components:
### **AlphaTrend (MFI + ATR-Based Adaptive Line)**
* Measures market flow direction with MFI (Money Flow Index),
* Measures price level breakouts with ATR (Volatility).
AlphaTrend detects whether the price is likely to reverse upwards or downwards.
### **Entry Signal**
* **Buy signal:** If the AlphaTrend has reversed upwards based on recent bars
* **Sell signal:** If the AlphaTrend has broken downwards
### **Pivot Points (For Stop)**
* The **pivotLow** and **pivotHigh** levels of the last 10 bars are calculated.
* These are used to determine the most logical stop distance.
---
## **4. Protection Shields**
The strategy uses two main filters to protect against the most dangerous conditions in the crypto market:
### **1. Pump/Dump Filter**
* A candlestick length greater than 4% is considered a "pump bar."
* Never open a trade on these bars.
The goal: to avoid sudden manipulation candlesticks.
### **2. RSI Filter**
* Long trades: RSI > 45 (open long on weak momentum)
* Short trades: RSI < 55 (open short on extremely strong momentum)
These filters provide more balanced entries.
---
## **5. Final Entry Conditions**
### **All conditions are required simultaneously for long:**
1. 4H trend up
2. ADX trend strength increasing
3. 45m AlphaTrend issued a "buy" signal
4. RSI > 45
5. No candlestick pump
6. Date range is suitable
### **All conditions apply in the opposite direction for short.**
---
## **6. Exit Mechanism (Stop, TP, Trailing)**
The strategy uses a three-layer structure on the exit side:
### **1. Pivot-Based Stop**
* Stop distance = Entry price − Pivot Low (for long)
* Minimum stop distance = **1% of the price**
Provides both structural and mathematical security.
### **2. Fixed R:R (Default 1:2)**
* TP = Entry + Stop Distance × R:R
The default 2R target is ideal for trend systems.
### **3. Optional Trailing Stop**
* Dynamic trailing stop that follows the price by a certain percentage.
* Allows trend trades to yield greater profits.
---
## **7. Chart Displays**
* Purple line:** 4H WEDGE (main trend line)
* Yellow background:** Pump protection is active (trades will not be opened on that bar)
---
## **8. Practical Effect of the Strategy**
This system has an adaptive structure based on trend variations.
**Strengths:**
* Very high accuracy (76–80% in SOL and ETH tests)
* Low drawdown (approximately 6–7%)
* Safe entries thanks to pump/dump and extreme momentum filters
* Clearly defined stop and target structure
* Low noise thanks to multi-timeframe compatibility
**Weaknesses:**
* Performance may decrease in sideways markets without trends
* Overtrading may occur if the ADX filter is closed
* Very small stops can sometimes cause unnecessary triggers
---
## **9. Conclusion**
**Adaptive Chameleon** is a trend-based and highly stable strategy with well-established risk management, manipulation filtering, and entry into lower timeframes with clear trend direction detection and low-latency signals.
SOL and ETH demonstrated strong and balanced performance in backtests with metrics such as:
* **600+ trades**
* **30–37% profit**
* **76–80% win rate**
* **Low max drawdown**

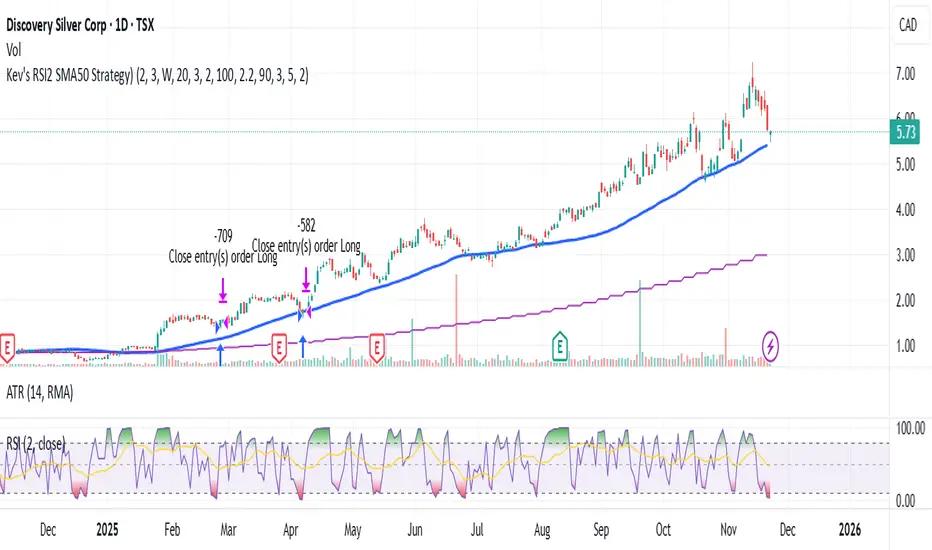
Kev's RSI2 SMA50 Strategy⭐ Kev’s RSI2 SMA50 Strategy — Institutional Edition (TSX Optimized + RR Filter)
A professional swing-trading system based on Larry Connors’ RSI(2) mean-reversion framework, optimized for TSX equities. Designed for Daily timeframe trading with institutional trend alignment, volatility filtering, and strict risk-reward controls.
📌 Overview
This strategy enhances the classic RSI(2) setup with:
• Strong trend confirmation (SMA50 + Weekly SMA50)
• Deep pullback detection (RSI2 < 3)
• Structural swing-based stop-loss
• Fixed 2R profit target (non-repainting)
• Optional Connors RSI (CRSI) confirmation
• Volatility filtering via ATR range
• Mechanical, deterministic, no-discretion rules
Works best on TSX large & mid-caps, ETFs, and liquid equities.
🔍 Core Philosophy
Buy strong stocks on pullbacks → Price must be above SMA50 + Weekly SMA50.
Pullback must be statistically meaningful → RSI(2) < 3.
R:R must justify the trade → Swing-low SL + 2R target with structural room to hit TP.
🧠 Entry Conditions (Non-Repainting)
• RSI(2) < 3 → Identifies extreme short-term oversold dips.
• SMA50 Filter → Ensures uptrend alignment.
• Weekly HTF Filter (Default = 1W) → Confirms broader trend direction.
• ATR Filter → Rejects volatile bars (range < ATR(14) × 2.2).
• Optional:
– SMA50 Slope (positive trend strength)
– Bullish Reversal Candle
– Connors RSI < 20 (deep pullback confirmation)
🎯 Risk Management
All levels are locked at entry and never repaint.
• Swing-Low SL (last 5 bars)
• 2R Profit Target = Entry + (Risk × 2)
• R:R Feasibility Filter → Only enters if recent swing high is above TP.
• Optional RSI Exit → Exit when RSI2 > 90 (enabled by default).
• Optional SMA Exit (disabled by default) → Conservative early exit.
📈 Visuals
The script plots:
• SMA50
• Weekly SMA50
• Swing-Low SL (fixed)
• 2R TP (fixed)
• Optional SMA exit line
All are non-repainting and update only on confirmed bars.
🔔 Alerts
Buy Signal → All entry filters aligned (RSI2, SMA50, HTF, ATR, RR check).
Exit Signal → 2R hit, SL hit, RSI exit, or SMA exit (if enabled).
🧭 Recommended Usage
• Timeframe: Daily
• HTF: Weekly (default)
• Best For: TSX equities, mid/large-cap stocks, ETFs
• Style: Short-term swing trading (1–10 bars)
• Avoid: Low-volume tickers, microcaps, crypto, biotech, news-driven spikes.
🛑 Notes
• All HTF data uses lookahead_off → non-repainting.
• Rules are fully mechanical and deterministic.
• Position sizing uses % equity by default.
• This script is for educational purposes only and not financial advice.
• Always forward-test before using live capital.
Final Scalping Strategy - RELAXED ENTRY, jangan gopoh braderEMA Scalping System (MTF) Guide (1HR direction, 15 min entry)
Objective
To capture small, consistent profits by entering trades when 15-minute momentum aligns with the 1-hour trend.
Trades are executed only during high-liquidity London and New York sessions to increase the probability of execution and success.
Strategy Setup
Chart Timeframe (Execution): 15-Minute (M15).
Trend Filter (HTF): 1-Hour (H1) chart data is used for the long-term EMA.
Long-Term Trend Filter: 50-Period EMA (based on H1 data).
Short-Term Momentum Signal: 20-Period EMA (based on M15 data).
Risk
Metric: 14-period ATR for dynamic Stop Loss calculation.
✅ Trading Rules🟢
Long (Buy) Entry Conditions
Session: Must be within the London (0800-1700 GMT) or New York (1300-2200 GMT) sessions.
HTF Trend: Current price must be above the 1-Hour EMA 50.
Momentum Signal: Price crosses above the 15-Minute EMA 20.
Confirmation: The bar immediately following the crossover must close above the 15-Minute EMA 20.
Ent
ry: A market order is executed on the close of the confirmation candle.
🔴 Short (Sell) Entry Conditions
Session: Must be within the London (0800-1700 GMT) or New York (1300-2200 GMT) sessions.
HTF Trend: Current price must be below the 1-Hour EMA 50.
Momentum Signal: Price crosses below the 15-Minute EMA 20.
Confirmation: The bar immediately following the crossover must close below the 15-Minute EMA 20.
Entry: A market order is executed on the close of the confirmation candle.
🛑 Trade Management & Exits
Stop Loss (SL): Placed dynamically at 2.0 times the 14-period ATR distance from the entry candle's low (for Buys) or high (for Sells).
Take Profit (TP): Placed dynamically to achieve a 1.5 Risk-Reward Ratio (RR) (TP distance = 1.5 x SL d
istance).
📊 On-Chart Visuals
Detailed Labels: A box appears on the entry bar showing the action, SL/TP prices, Risk/Reward in Pips, and the exact R:R ratio.
Horizontal Lines: Dashed lines display the calculated SL (Red) and TP (Green) levels while the trade is active.
Background: The chart background is shaded to highlight the active London and New York tradi
ng sessions.

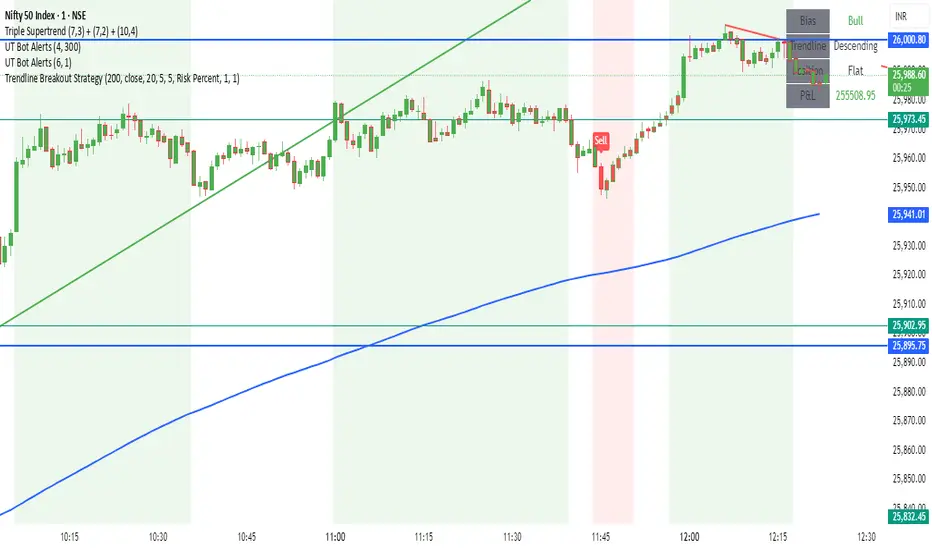
Trendline Breakout Strategy Strategy should place entries & exits so that it can be backtested (use strategy.entry and strategy.exit with explicit stop and limit prices). Include an option for fixed percent position sizing and an option for fixed contract size. Draw the trendline on the chart (with option to hide/show) and add labels that show: bias (Bull/Bear), trendline slope, entry price, SL, TP and the reason (e.g., "Trendline Breakout"). Provide user inputs for: EMA length (default 200), lookback for pivot detection, pivot sensitivity (left/right bars), quantity mode (percent / contracts), risk percent or fixed size, enable/disable backtest prints, and enable alerts. Avoid repainting: use confirmed pivot logic (pivot detection must use completed bars) and only take entry after breakout confirmed on close. Document any limitations (for example, trendline using two highest/highest bars inside lookback is approximate). Add clear comments, helpful variable names, and include example alertcondition lines for entry and exit signals.
One For All Strategy by Anson🏆 Exclusive Indicator: One For All Strategy
.
📈 Works for stocks, forex, crypto, indices
📈 Easy to use, real-time alerts, no repaint
📈 No grid, no martingale, no hedging
📈 One position at a time
.
One For All Strategy by Anson
A multi-indicator TradingView strategy designed to identify long and short trading opportunities by combining trend-following and momentum signals, paired with risk management rules to guide entries and exits.
.
Core Logic & Key Indicator:
X Moving Average: A proprietary adaptive moving average that adjusts its responsiveness to price changes based on market volatility. It uses an efficiency ratio to modify its smoothing behavior—adapting to whether the market is trending or ranging. Users can toggle a setting to let this ratio dynamically adjust the indicator’s sensitivity or use a fixed smoothing factor.
.
Entry Conditions:
.
Long Entry: Triggered when momentum signals strength, price action aligns with a broader upward trend, the X MA indicates short-term upward momentum, and a minimum number of bars have passed since the last trade (to prevent overtrading).
.
Short Entry: Triggered when momentum signals weakness, price action aligns with a broader downward trend, the X MA indicates short-term downward momentum, and a minimum number of bars have passed since the last trade.
.
Exit Conditions:
.
Trailing Stop: Activates after a position has been open for a set number of bars (to avoid premature exits). A trailing stop—based on a percentage of the entry price—locks in profits as the trade moves favorably, adjusting dynamically to protect gains.
.
Additional Features:
Visualisation: Overlays the X MA (orange line) and price (semi-transparent blue) on the chart for clear signal tracking.
.
See the author's instructions on the right to learn how to get access to the strategy.

Zero Lag Trend Signals (MTF) [Quant Trading] V7Overview
The Zero Lag Trend Signals (MTF) V7 is a comprehensive trend-following strategy that combines Zero Lag Exponential Moving Average (ZLEMA) with volatility-based bands to identify high-probability trade entries and exits. This strategy is designed to reduce lag inherent in traditional moving averages while incorporating dynamic risk management through ATR-based stops and multiple exit mechanisms.
This is a longer term horizon strategy that takes limited trades. It is not a high frequency trading and therefore will also have limited data and not > 100 trades.
How It Works
Core Signal Generation:
The strategy uses a Zero Lag EMA (ZLEMA) calculated by applying an EMA to price data that has been adjusted for lag:
Calculate lag period: floor((length - 1) / 2)
Apply lag correction: src + (src - src )
Calculate ZLEMA: EMA of lag-corrected price
Volatility bands are created using the highest ATR over a lookback period multiplied by a band multiplier. These bands are added to and subtracted from the ZLEMA line to create upper and lower boundaries.
Trend Detection:
The strategy maintains a trend variable that switches between bullish (1) and bearish (-1):
Long Signal: Triggers when price crosses above ZLEMA + volatility band
Short Signal: Triggers when price crosses below ZLEMA - volatility band
Optional ZLEMA Trend Confirmation:
When enabled, this filter requires ZLEMA to show directional momentum before entry:
Bullish Confirmation: ZLEMA must increase for 4 consecutive bars
Bearish Confirmation: ZLEMA must decrease for 4 consecutive bars
This additional filter helps avoid false signals in choppy or ranging markets.
Risk Management Features:
The strategy includes multiple stop-loss and take-profit mechanisms:
Volatility-Based Stops: Default stop-loss is placed at ZLEMA ± volatility band
ATR-Based Stops: Dynamic stop-loss calculated as entry price ± (ATR × multiplier)
ATR Trailing Stop: Ratcheting stop-loss that follows price but never moves against position
Risk-Reward Profit Target: Take-profit level set as a multiple of stop distance
Break-Even Stop: Moves stop to entry price after reaching specified R:R ratio
Trend-Based Exit: Closes position when price crosses EMA in opposite direction
Performance Tracking:
The strategy includes optional features for monitoring and analyzing trades:
Floating Statistics Table: Displays key metrics including win rate, GOA (Gain on Account), net P&L, and max drawdown
Trade Log Labels: Shows entry/exit prices, P&L, bars held, and exit reason for each closed trade
CSV Export Fields: Outputs trade data for external analysis
Default Strategy Settings
Commission & Slippage:
Commission: 0.1% per trade
Slippage: 3 ticks
Initial Capital: $1,000
Position Size: 100% of equity per trade
Main Calculation Parameters:
Length: 70 (range: 70-7000) - Controls ZLEMA calculation period
Band Multiplier: 1.2 - Adjusts width of volatility bands
Entry Conditions (All Disabled by Default):
Use ZLEMA Trend Confirmation: OFF - Requires ZLEMA directional momentum
Re-Enter on Long Trend: OFF - Allows multiple entries during sustained trends
Short Trades:
Allow Short Trades: OFF - Strategy is long-only by default
Performance Settings (All Disabled by Default):
Use Profit Target: OFF
Profit Target Risk-Reward Ratio: 2.0 (when enabled)
Dynamic TP/SL (All Disabled by Default):
Use ATR-Based Stop-Loss & Take-Profit: OFF
ATR Length: 14
Stop-Loss ATR Multiplier: 1.5
Profit Target ATR Multiplier: 2.5
Use ATR Trailing Stop: OFF
Trailing Stop ATR Multiplier: 1.5
Use Break-Even Stop-Loss: OFF
Move SL to Break-Even After RR: 1.5
Use Trend-Based Take Profit: OFF
EMA Exit Length: 9
Trade Data Display (All Disabled by Default):
Show Floating Stats Table: OFF
Show Trade Log Labels: OFF
Enable CSV Export: OFF
Trade Label Vertical Offset: 0.5
Backtesting Date Range:
Start Date: January 1, 2018
End Date: December 31, 2069
Important Usage Notes
Default Configuration: The strategy operates in its most basic form with default settings - using only ZLEMA crossovers with volatility bands and volatility-based stop-losses. All advanced features must be manually enabled.
Stop-Loss Priority: If multiple stop-loss methods are enabled simultaneously, the strategy will use whichever condition is hit first. ATR-based stops override volatility-based stops when enabled.
Long-Only by Default: Short trading is disabled by default. Enable "Allow Short Trades" to trade both directions.
Performance Monitoring: Enable the floating stats table and trade log labels to visualize strategy performance during backtesting.
Exit Mechanisms: The strategy can exit trades through multiple methods: stop-loss hit, take-profit reached, trend reversal, or trailing stop activation. The trade log identifies which exit method was used.
Re-Entry Logic: When "Re-Enter on Long Trend" is enabled with ZLEMA trend confirmation, the strategy can take multiple long positions during extended uptrends as long as all entry conditions remain valid.
Capital Efficiency: Default setting uses 100% of equity per trade. Adjust "default_qty_value" to manage position sizing based on risk tolerance.
Realistic Backtesting: Strategy includes commission (0.1%) and slippage (3 ticks) to provide realistic performance expectations. These values should be adjusted based on your broker and market conditions.
Recommended Use Cases
Trending Markets: Best suited for markets with clear directional moves where trend-following strategies excel
Medium to Long-Term Trading: The default length of 70 makes this strategy more appropriate for swing trading rather than scalping
Risk-Conscious Traders: Multiple stop-loss options allow traders to customize risk management to their comfort level
Backtesting & Optimization: Comprehensive performance tracking features make this strategy ideal for testing different parameter combinations
Limitations & Considerations
Like all trend-following strategies, performance may suffer in choppy or ranging markets
Default 100% position sizing means full capital exposure per trade - consider reducing for conservative risk management
Higher length values (70+) reduce signal frequency but may improve signal quality
Multiple simultaneous risk management features may create conflicting exit signals
Past performance shown in backtests does not guarantee future results
Customization Tips
For more aggressive trading:
Reduce length parameter (minimum 70)
Decrease band multiplier for tighter bands
Enable short trades
Use lower profit target R:R ratios
For more conservative trading:
Increase length parameter
Enable ZLEMA trend confirmation
Use wider ATR stop-loss multipliers
Enable break-even stop-loss
Reduce position size from 100% default
For optimal choppy market performance:
Enable ZLEMA trend confirmation
Increase band multiplier
Use tighter profit targets
Avoid re-entry on trend continuation
Visual Elements
The strategy plots several elements on the chart:
ZLEMA line (color-coded by trend direction)
Upper and lower volatility bands
Long entry markers (green triangles)
Short entry markers (red triangles, when enabled)
Stop-loss levels (when positions are open)
Take-profit levels (when enabled and positions are open)
Trailing stop lines (when enabled and positions are open)
Optional ZLEMA trend markers (triangles at highs/lows)
Optional trade log labels showing complete trade information
Exit Reason Codes (for CSV Export)
When CSV export is enabled, exit reasons are coded as:
0 = Manual/Other
1 = Trailing Stop-Loss
2 = Profit Target
3 = ATR Stop-Loss
4 = Trend Change
Conclusion
Zero Lag Trend Signals V7 provides a robust framework for trend-following with extensive customization options. The strategy balances simplicity in its core logic with sophisticated risk management features, making it suitable for both beginner and advanced traders. By reducing moving average lag while incorporating volatility-based signals, it aims to capture trends earlier while managing risk through multiple configurable exit mechanisms.
The modular design allows traders to start with basic trend-following and progressively add complexity through ZLEMA confirmation, multiple stop-loss methods, and advanced exit strategies. Comprehensive performance tracking and export capabilities make this strategy an excellent tool for systematic testing and optimization.
Note: This strategy is provided for educational and backtesting purposes. All trading involves risk. Past performance does not guarantee future results. Always test thoroughly with paper trading before risking real capital, and adjust position sizing and risk parameters according to your risk tolerance and account size.
================================================================================
TAGS:
================================================================================
trend following, ZLEMA, zero lag, volatility bands, ATR stops, risk management, swing trading, momentum, trend confirmation, backtesting
================================================================================
CATEGORY:
================================================================================
Strategies
================================================================================
CHART SETUP RECOMMENDATIONS:
================================================================================
For optimal visualization when publishing:
Use a clean chart with no other indicators overlaid
Select a timeframe that shows multiple trade signals (4H or Daily recommended)
Choose a trending asset (crypto, forex major pairs, or trending stocks work well)
Show at least 6-12 months of data to demonstrate strategy across different market conditions
Enable the floating stats table to display key performance metrics
Ensure all indicator lines (ZLEMA, bands, stops) are clearly visible
Use the default chart type (candlesticks) - avoid Heikin Ashi, Renko, etc.
Make sure symbol information and timeframe are clearly visible
================================================================================
COMPLIANCE NOTES:
================================================================================
✅ Open-source publication with complete code visibility
✅ English-only title and description
✅ Detailed explanation of methodology and calculations
✅ Realistic commission (0.1%) and slippage (3 ticks) included
✅ All default parameters clearly documented
✅ Performance limitations and risks disclosed
✅ No unrealistic claims about performance
✅ No guaranteed results promised
✅ Appropriate for public library (original trend-following implementation with ZLEMA)
✅ Educational disclaimers included
✅ All features explained in detail
================================================================================

Solana 4H RSI->MACD — Counter-Trend By TetradTetrad RSI→RSI Cross→MACD (Sequenced) — Counter-Trend (SL-Only)
Category: Market-neutral, counter-trend, sequenced entries
Timeframe default: Works on any TF; designed around 4H On Solana
Markets: Any (spot, perp, futures); parameterize to your asset
What it does
This strategy hunts reversals using a 3-step sequence on RSI and MACD, then optionally restricts entries by market regime and a price gate. It shows stop-loss lines only when hit (clean chart), and paints a Donchian glow for quick read of backdrop conditions.
Entry logic (sequenced)
1. RSI Extreme:
Long path activates when RSI < Oversold (default 27.5).
Short path activates when RSI > Overbought (default 74).
2. RSI Cross confirmation:
Long path: RSI crosses up back above the oversold level.
Short path: RSI crosses down back below the overbought level.
Each step has a max bar lookback so stale signals time out.
3. MACD Cross trigger:
Long: MACD line crosses above Signal.
Short: MACD line crosses below Signal.
→ When step 3 fires and gates are satisfied, a trade is entered.
Optional gates & filters
Regime Filter (Counter-Trend):
Longs allowed in **Range / Short Trend / Short Parabolic** regimes.
Shorts allowed in **Range / Long Trend / Long Parabolic** regimes.
Based on ADX/DI and ATR% intensity.
* Price Gate (Long Ceiling):
Toggle to **disable new longs above a chosen price (default 209.0 For SOL).
Useful for assets like SOL where you want longs only below a cap.
Exits / Risk
* Stop-Loss (% of entry):** default **14%**, toggleable.
* SL visualization:** plots a **thin dashed red line only on the bar it’s hit**.
* (No take-profit or time-based exit in this version—keep it pure to the sequence and regime. Add TP/time exits if desired.)
Visuals
* Donchian Glow (50): background band only (upper/lower lines hidden).
* Regime HUD: compact table (top-right) highlighting the active regime.
* Minimal marks: no entry/exit “arms” clutter; only SL-hit lines render.
Inputs (key)
* Core: RSI Length, Oversold/Overbought, MACD Fast/Slow/Signal.
* Sequence: Max bars from Extreme→RSI Cross and RSI Cross→MACD Cross.
* Regime: ADX Length, Trend/Parabolic thresholds, ATR length & floor.
* Stops: Enable/disable; SL %.
* Price Gate: Enable; Long ceiling price.
Alerts
Sequenced Long (CT): RSIhigh → RSI cross down → MACD bear cross.
## Notes & Tips
Designed for counter-trend fades that become trend rides. The regime filter helps avoid fading true parabolics and aligns entries with safer contexts.
The sequence is stateful (steps must occur in order). If a step times out, the path resets.
Works on lower TFs, but the 4H baseline reduces noise and over-trading.
Consider pairing with volume or structure filters if you want fewer but higher-conviction entries.
Past performance ≠ future results. **Educational use only. Not financial advice.

Larry Williams Oops StrategyThis strategy is a modern take on Larry Williams’ classic Oops setup. It trades intraday while referencing daily bars to detect opening gaps and align entries with the prior day’s direction. Risk is managed with day-based stops, and—unlike the original—all positions are closed at the end of the session (or at the last bar’s close), not at a fixed profit target or the first profitable open.
Entry Rules
Long setup (bullish reversion): Today opens below yesterday’s low (down gap) and yesterday’s candle was bearish. Place a buy stop at yesterday’s low + Filter (ticks).
Short setup (bearish reversion): Today opens above yesterday’s high (up gap) and yesterday’s candle was bullish. Place a sell stop at yesterday’s high − Filter (ticks).
Longs are only taken on down-gap days; shorts only on up-gap days.
Protective Stop
If long, stop loss trails the current day’s low.
If short, stop loss trails the current day’s high.
Exit Logic
Positions are force-closed at the end of the session (in the last bar), ensuring no overnight exposure. There is no take-profit; only stop loss or end-of-day flat.
Notes
This strategy is designed for intraday charts (minutes/seconds) using daily data for gaps and prior-day direction.
Longs/shorts can be enabled or disabled independently.

Larry Williams Bonus Track PatternThis strategy trades the day immediately following an Inside Day, under specific directional and timing conditions. It is designed for daily-based setups but executed on intraday charts to ensure orders are placed exactly at the open of the following day, rather than at the daily bar close.
Entry Conditions
Only trades on Monday, Thursday, or Friday.
The previous day must be an Inside Day (its high is lower than the prior high and its low is higher than the prior low).
The bar before the Inside Day must be bullish (close > open).
On the following day (t):
The daily open must be below both the Inside Day’s high and the highest high of the two days before that.
A buy stop is placed at the highest high of the three previous days (Inside Day and the two days before it).
If the new day’s open is already above that level (gap up), the strategy enters long immediately at the open.
Exit Rules
Stop Loss: Fixed, defined in points or percentage (user input).
FPO (First Profitable Open): the position is closed at the first daily open after the entry day where the open price is above the average entry price (the first profitable open).
Notes
The script must be applied on an intraday timeframe (e.g., 15-minute or 1-hour) so that the strategy can:
Detect the Inside Day pattern using daily data (request.security).
Execute orders in real time at the next day’s open.
Running it directly on the daily timeframe will delay executions by one bar due to Pine Script’s evaluation model.

DCA with the Money Supply Index DCA with the Money Supply Index (MSI) by zdmre
This strategy is based on the Money Supply Index (MSI) by zdmre and enhances it with two functional options for users: a DCA (Dollar-Cost Averaging) approach and a signal-based buy/sell mode. It’s designed to help traders and investors make data-driven, disciplined entry decisions based on monetary supply trends.
🧠 Concept Overview
The Money Supply Index (MSI) provides insight into how liquidity (money supply) influences market movements. This strategy builds upon that foundation by allowing users to either:
Accumulate positions over time using DCA, based on favorable MSI conditions.
Execute a single buy and sell trade, optimized for bull market conditions.
⚙️ Inputs Explained
General Parameters
Start Bar Index / Stop Bar Index
Defines the range of bars (historical data) for backtesting or strategy visualization.
Long DCA
Activates the DCA mode. If unchecked, the strategy operates in single-entry/single-exit signal mode.
Trading Signal
Enables signal-based entries and exits when the MSI reaches predefined thresholds.
DCA Parameters
Entry Value
The MSI value that triggers a DCA buy event. When the MSI crosses below this value, the strategy considers it a favorable moment to deploy the saved capital.
Saved Amount
The amount of money set aside regularly (e.g., monthly) for investment. This simulates the DCA effect by accumulating capital and deploying it when conditions are optimal.
Data Inputs
Money Supply
The data source for the Money Supply Index (default: ECONOMICS:USM2).
Relational Symbol
The market instrument to compare against the money supply (default: NASDAQ_DLY:NDX). This allows the strategy to measure liquidity impact on a specific market.
Chart Display Options
You can toggle these metrics on the chart for better visualization:
Entry Price (green) – The price level of executed buys.
Cash Balance (yellow) – Remaining uninvested capital.
Invested Capital (red) – Total amount currently invested.
Current Value (blue) – The current valuation of the investment.
Profit (purple) – The total realized and unrealized profit.
Trades on Chart / Signal Labels / Quantity – Enables trade markers, signal text, and position size visualization.
📈 How the Strategy Works
1️⃣ DCA Mode
In DCA mode, the strategy simulates periodic savings and only invests when the MSI indicates favorable liquidity conditions (based on the Entry Value).
This approach aims to achieve the best possible average entry price over time — a powerful strategy for long-term investors seeking stable accumulation with reduced emotional bias.
2️⃣ Signal-Based Mode
In signal mode (with DCA disabled), the strategy performs one buy and one sell trade based on MSI turning points.
It’s most effective during bull markets, where liquidity expansion supports upward momentum.
This mode helps identify high-probability entry and exit zones rather than averaging in continuously.
💡 Additional Notes
This strategy includes helpful metrics to monitor your personal investment performance — showing invested capital, cash reserves, and profit in real-time.
The goal is to combine macroeconomic insight (money supply) with disciplined execution and capital management.
⚠️ Disclaimer
This strategy is for educational and research purposes only. It does not constitute financial advice. Always conduct your own analysis before making investment decisions.

AstraAlgo BacktesterOVERVIEW
The AstraAlgo Backtester allows traders to simulate and evaluate trading strategies directly on TradingView. By simulating trades across different timeframes and markets, it provides valuable insights into win rates, drawdowns, and overall strategy effectiveness.
SIGNAL MODES
Signal Modes generate proprietary trade signals based on live price data. Users can choose between Off, Basic, Advanced, or Custom modes to evaluate strategies under different conditions and refine their trading approach.
ADJUSTABLE BACKTESTING
Parameters for historical simulations can be customized to test different market conditions and trading scenarios. This allows traders to measure strategy performance, including win rate, profit/loss, and risk/reward ratios, helping refine and optimize strategies before live execution.
BAR COLORING
Bar Coloring highlights bullish and bearish bars on historical charts, allowing traders to visually assess trend direction and trade outcomes during backtesting. This makes it easier to analyze momentum and strategy effectiveness at a glance.
ASTRA CLOUD
Astra Cloud overlays dynamic support and resistance levels on live price data. These zones adapt automatically to past market movements, helping traders identify areas where trades would have reacted, aiding strategy evaluation and optimization.

BBAWE 事件合約This is a paid version. Please contact me or follow me.
✅ Key Features
Strict 1-bar confirmation for cleaner entries.
Fast EMA filter to avoid false breakouts.
Cooldown system to reduce overtrading.
Visual markers for Key Bars and trade entries.
Fully customizable parameters (BB period, EMA length, cooldown bars).
📈 Best Suited For
Short-term scalping or intraday setups.
Catching quick reversals or momentum continuation.
Traders who need stricter signal validation to filter noise.

event contract boll 事件合約Bollinger Bands (BB)
Strict t1 Confirmation
Only the very next candle (t1) is checked:
Long
Short
Prevents rapid-fire entries in choppy markets.✅ Key Features
Strict 1-bar confirmation for cleaner entries.
Fast EMA filter to avoid false breakouts.
Cooldown system to reduce overtrading.
Visual markers for Key Bars and trade entries.
Fully customizable parameters (BB period, EMA length, cooldown bars).
📈 Best Suited For
Short-term scalping or intraday setups.
Catching quick reversals or momentum continuation.
Traders who need stricter signal validation to filter noise.

Ramen & OJ V1Ramen & OJ V1 — Strategy Overview
Ramen & OJ V1 is a mechanical price-action system built around two entry archetypes—Engulfing and Momentum—with trend gates, session controls, risk rails, and optional interval take-profits. It’s designed to behave the same way you’d trade it manually: wait for a qualified impulse, enter with discipline (optionally on a measured retracement), and manage the position with clear, rules-based exits.
Core Idea (What the engine does)
At its heart, the strategy looks for a decisive candle, then trades in alignment with your defined trend gates and flattens when that bias is no longer valid.
Entry Candle Type
Engulfing: The body of the current candle swallows the prior candle’s body (classic momentum shift).
Momentum: A simple directional body (close > open for longs, close < open for shorts).
Body Filter (lookback): Optional guard that requires the current body to be at least as large as the max body from the last N bars. This keeps you from chasing weak signals.
Primary MA (Entry/Exit Role):
Gate (optional): Require price to be above the Primary MA for longs / below for shorts.
Exit (always): Base exit occurs when price closes back across the Primary MA against your position.
Longs: qualifying bullish candle + pass all enabled filters.
Shorts: mirror logic.
Entries (Impulse vs. Pullback)
You choose how aggressive to be:
Market/Bars-Close Entry: Fire on the bar that confirms the signal (respecting filters and sessions).
Retracement Entry (optional): Instead of chasing the close, place a limit around a configurable % of the signal candle’s range (e.g., 50%). This buys the dip/sells the pop with structure, often improving average entry and risk.
Flip logic is handled: when an opposite, fully-qualified signal appears while in a position, the strategy closes first and then opens the new direction per rules.
Exits & Trade Management
Primary Exit: Price closing back across the Primary MA against your position.
Interval Take-Profit (optional):
Pre-Placed (native): Automatically lays out laddered limit targets every X ticks with OCO behavior. Each rung can carry its own stop (per-rung risk). Clean, broker-like behavior in backtests.
Manual (legacy): Closes slices as price steps through the ladder levels intrabar. Useful for platforms/brokers that need incremental closes rather than bracketed OCOs.
Per-Trade Stop: Choose ticks or dollars, and whether the $ stop is per position or per contract. When pre-placed TP is on, each rung uses a coordinated OCO stop; otherwise a single hard stop is attached.
Risk Rails (Session P&L Controls)
Session Soft Lock: When a session profit target or loss limit is hit, the strategy stops taking new trades but does not force-close open positions.
Session Hard Lock: On reaching your session P&L limit, all orders are canceled and the strategy flattens immediately. No new orders until the next session.
These rails help keep good days good and bad days survivable.
Filters & How They Work Together
1) Trend & Bias
Primary MA Gate (optional): Only long above / only short below. This keeps signals aligned with your primary bias.
Primary MA Slope Filter (optional): Require a minimum up/down slope (in degrees over a defined bar span). It’s a simple way to force impulse alignment—green light only when the MA is actually moving up for longs (or down for shorts).
Secondary MA Filter (optional): An additional trend gate (SMA/EMA, often a 200). Price must be on the correct side of this higher-timeframe proxy to trade. Great for avoiding countertrend picks.
How to combine:
Use Secondary MA as the “big picture” bias, Primary MA gate as your local regime check, and Slope to ensure momentum in that regime. That three-layer stack cuts a lot of chop.
2) Volatility/Exhaustion
CCI Dead Zone Filter (optional): Trades only when CCI is inside a specified band (default ±200). This avoids entries when price is extremely stretched; think of it as a no-chase rule.
TTM Squeeze Filter (optional): When enabled, the strategy avoids entries during a squeeze (Bollinger Bands inside Keltner Channels). You’re effectively waiting for the release, not the compression itself. This plays nicely with momentum entries and the slope gate.
How to combine:
If you want only the clean breaks, enable Slope + Squeeze; if you want structure but fewer chases, add CCI Dead Zone. You’ll filter out a lot of low-quality “wiggle” trades.
3) Time & Market Calendar
Sessions: Up to two session windows (America/Chicago by default), with background highlights.
Good-Till-Close (GTC): When ON, trades can close outside the session window; when OFF, all positions are flattened at session end and pending orders canceled.
Market-Day Filters: Skip US listed holidays and known non-full Globex days (e.g., Black Friday, certain eves). Cleaner logs and fewer backtest artifacts.
How to combine:
Run your A-setup window (e.g., cash open hour) with GTC ON if you want exits to obey system rules even after the window, or GTC OFF if you want the book flat at the bell, no exceptions.
Practical Profiles (mix-and-match presets)
Trend Rider: Primary MA gate ON, Slope filter ON, Secondary MA ON, Retracement ON (50%).
Goal: Only take momentum that’s already moving, buy the dip/sell the pop back into trend.
Structure-First Pullback: Primary MA gate ON, Secondary MA ON, CCI Dead Zone ON, Retracement 38–62%.
Goal: Filter extremes, use measured pullbacks for better R:R.
Break-Only Mode: Slope ON + Squeeze filter ON (avoid compression), Body filter ON with short lookback.
Goal: Only catch clean post-compression impulses.
Session Scalper: Tight session window, GTC OFF, Interval TP ON (small slices, short rungs), per-trade tick stop.
Goal: Quick hits in a well-defined window, always flat after.
Automation Notes
The system is built with intrabar awareness (calc_on_every_tick=true) and supports bracket-style behavior via pre-placed interval TP rungs. For webhook automation (e.g., TradersPost), keep chart(s) open and ensure alerts are tied to your order events or signal conditions as implemented in your alert templates. Always validate live routing with a small-size shakedown before scaling.
Tips, Caveats & Good Hygiene
Intrabar vs. Close: Backtests can fill intrabar where your broker might not. The pre-placed mode helps emulate OCO behavior but still depends on feed granularity.
Slippage & Fees: Set realistic slippage/commission in Strategy Properties to avoid fantasy equity curves.
Session Consistency: Use the correct timezone and verify that your broker’s session aligns with your chart session settings.
Don’t Over-stack Filters: More filters ≠ better performance. Start with trend gates, then add one volatility filter if needed.
Disclosure
This script is for educational purposes only and is not financial advice. Markets carry risk; only trade capital you can afford to lose. Test thoroughly on replay and paper before using any automated routing.
TL;DR
Identify a decisive candle → pass trend/vol filters → (optionally) pull back to a measured limit → scale out on pre-planned rungs → exit on Primary MA break or session rule. Clear, mechanical, repeatable.

Trendline Breakout Strategy [KedArc Quant] Description
A single, rule-based system that builds two trendlines from confirmed swing pivots and trades their breakouts, with optional retest, trend-regime gates (EMA / HTF EMA), and ATR-based risk. All parts serve one decision flow: structure → breakout → gated entry → managed risk.
What it does (for traders)
Draws Up line (teal) through the last two Higher Lows and Down line (red) through the last two Lower Highs, then extends them forward.
Long when price breaks above red; Short when price breaks below teal.
Optional Retest entry: after a break, wait for a pullback toward the broken line within an ATR-scaled buffer.
Uses ATR stop and R-multiple target so risk is consistent across symbols/timeframes.
Labels HL1/HL2/LH1/LH2 so non-coders can verify which pivots built each line.
Why these components are combined
Pure breakout systems on trendlines suffer from three practical issues:
False breaks in chop → solved by trend-regime gates (EMA / HTF EMA) that only allow trades aligned with the prevailing trend.
Uneven volatility across markets/timeframes → solved by ATR-based stop/target, normalizing distance so R-multiples are comparable.
First break whipsaws near wedge apices → mitigated by the optional retest rule that demands a pullback/hold before entry.
These modules are not separate indicators with their own signals. They are support roles inside one method.
The pivot engine defines structure, the breakout detector defines signal, the regime gates decide if we’re allowed to take that signal, and the ATR module sizes risk.
Together they make the trendline breakout usable, testable, and explainable.
How it works (mechanism; each component explained)
1) Pivot engine (structure, non-repainting)
Swings are confirmed with ta.pivotlow/high(L, R). A pivot only exists after R bars (no look-ahead), so once plotted, the line built from those pivots will not repaint.
2) Trendline builder (geometry)
Teal line updates when two consecutive pivot lows satisfy HL2.price > HL1.price (and HL2 occurs after HL1).
Red line updates when two consecutive pivot highs satisfy LH2.price < LH1.price.
Lines are extended right and their current value is read every bar via line.get_price().
3) Breakout detector (signal)
On every bar, compute:
crossover(close, redLine) ⇒ Long breakout
crossunder(close, tealLine) ⇒ Short breakdown
4) Regime gates (trend filters, not separate signals)
EMA gate: allow longs only if close > EMA(len), shorts only if close < EMA(len).
HTF EMA gate (optional): same rule on a higher timeframe to avoid fighting the larger trend.
These do not create entries; they simply permit or block the breakout signal.
5) Retest module (optional confirmation)
After a breakout, record the line price. A valid retest occurs if price pulls back within an ATR-scaled buffer toward that broken line and then closes back in the breakout direction.
This reduces first-tick fakeouts.
6) Risk module (position exit)
Initial stop = ATR(len) × atrMult from entry.
Target = tpR × (ATR × atrMult) (e.g., 2R).
This keeps results consistent across instruments/timeframes.
Entries & exits
Long entry
Base: close breaks above red and passes EMA/HTF gates.
Retest (if enabled): after the break, price pulls back near the broken red line (within the ATR buffer) and holds; then enter.
Short entry
Mirror logic with teal (break below & gates), optionally with a retest.
Exit
strategy.exit places ATR stop & R-multiple target automatically.
Optional “flip”: close if the opposite base signal triggers.
How to use it (step-by-step)
Timeframe: 1–15m for intraday, 1–4h for swing.
Start defaults: Pivot L/R = 5, EMA len = 200, ATR len = 14, ATR mult = 2, TP = 2R, Retest = ON.
Tune sensitivity:
Faster lines (more trades): set L/R = 3–4.
Fewer counter-trend trades: enable HTF EMA (e.g., 60-min or Daily).
Visual audit: labels HL1/HL2 & LH1/LH2 show which pivots built each line—verify by eye.
Alerts: use Long breakout, Short breakdown, and Retest alerts to automate.
Originality (why it merits publication)
Trades the visualization: many “auto-trendline” tools only draw lines; this one turns them into testable, alertable rules.
Integrated design: each component has a defined role in the same pipeline—no unrelated indicators bolted together.
Transparent & non-repainting: pivot confirmation removes look-ahead; labels let non-coders understand the setup that produced each signal.
Notes & limitations
Lines update only after pivot confirmation; that lag is intentional to avoid repainting.
Breakouts near an apex can whipsaw; prefer Retest and/or HTF gate in choppy regimes.
Backtests are idealized; forward-test and size risk appropriately.
⚠️ Disclaimer
This script is provided for educational purposes only.
Past performance does not guarantee future results.
Trading involves risk, and users should exercise caution and use proper risk management when applying this strategy.

Killzones SMT + IFVG detectorKillzones SMT + IFVG Detector
Summary
This strategy implements a specific intraday workflow inspired by ICT-style concepts.
It combines:
Killzone session levels (recording untouched highs/lows)
SMT divergence between NQ and ES (exclusive sweep logic)
IFVG confirmation (3-bar imbalance + width filter + inversion guard)
and an optional smart exit engine
The components are not simply mashed together: they interact in sequence.
A setup only confirms if all conditions line up (time window → untouched level sweep → divergence → valid IFVG → confirmation candle → risk filter).
Workflow
Killzones & session levels
Tracks highs/lows inside default killzones (19:00–23:00, 01:00–04:00, 08:30–10:00, 11:00–12:00, 12:30–15:00, chart timezone).
Stores untouched levels forward; sweeps trigger candidate signals.
SMT divergence (exclusive sweep)
Bullish SMT : one index sweeps its low while the other remains above its session low.
Bearish SMT : one index sweeps its high while the other remains below its session high.
Detection supports “Sweep (Cross)” or “Exact Tick.”
Session IDs are tracked so once a side has fired, later re-touches can’t re-trigger .
IFVG confirmation
Locks the first valid 3-bar IFVG after SMT.
Confirmation requires a candle close beyond the IFVG boundary in the direction of the close.
IFVGs must meet a minimum width filter (default 1.0 point).
Inversion guard: ignores IFVGs already inverted before SMT.
Optional “re-lock” keeps tracking the latest IFVG until confirmation/expiry.
Smart exit engine
Initial stop from opposite wick (+ buffer).
Fixed TP (default 40 points).
Dynamic stop escalation at progress thresholds (BE → 50% → 80% of target).
Safety gates
Weekend lockout (Fri 16:40 → Sun 18:00).
Same-bar sweep of high & low cancels setups.
Max initial stop filter skips oversized setups.
Optional cooldown bars.
Alerts
SMT Bullish/Bearish : divergence detected this bar.
Confirm Long/Short : IFVG confirmation triggered.
Default Strategy Properties (used in screenshots/backtests)
Initial capital: $25,000
Order size: 1 contract
Commission: $1.25 per contract per side
Slippage: 2 ticks
Backtest window: Jun 16, 2025 – Sep 14, 2025
These settings are intentionally conservative. If you change them, your results will differ.
How to use
Apply on an NQ or ES futures chart (1–5 min).
Choose your killzones and detection mode.
Select confirmation symbol (NQ, ES, or “Sweeper”).
Enable/disable IFVG re-lock.
Review signals and use alerts for automation if desired.
Limitations
Strict filters reduce trade count; extend backtest window for more samples.
Works best on NQ/ES; not validated elsewhere.
Past performance is not indicative of future results.
This is an educational tool ; not financial advice.

Hazel nut BB Strategy, volume base- lite versionHazel nut BB Strategy, volume base — lite version
Having knowledge and information in financial markets is only useful when a trader operates with a well-defined trading strategy. Trading strategies assist in capital management, profit-taking, and reducing potential losses.
This strategy is built upon the core principle of supply and demand dynamics. Alongside this foundation, one of the widely used technical tools — the Bollinger Bands — is employed to structure a framework for profit management and risk control.
In this strategy, the interaction of these tools is explained in detail. A key point to note is that for calculating buy and sell volumes, a lower timeframe function is used. When applied with a tick-level resolution, this provides the most precise measurement of buyer/seller flows. However, this comes with a limitation of reduced historical depth. Users should be aware of this trade-off: if precise tick-level data is required, shorter timeframes should be considered to extend historical coverage .
The strategy offers multiple configuration options. Nevertheless, it should be treated strictly as a supportive tool rather than a standalone trading system. Decisions must integrate personal analysis and other instruments. For example, in highly volatile assets with narrow ranges, it is recommended to adjust profit-taking and stop-loss percentages to smaller values.
◉ Volume Settings
• Buyer and seller volume (up/down volume) are requested from a lower timeframe, with an option to override the automatic resolution.
• A global lookback period is applied to calculate moving averages and cumulative sums of buy/sell/delta volumes.
• Ratios of buyers/sellers to total volume are derived both on the current bar and across the lookback window.
◉ Bollinger Band
• Bands are computed using configurable moving averages (SMA, EMA, RMA, WMA, VWMA).
• Inputs allow control of length, standard deviation multiplier, and offset.
• The basis, upper, and lower bands are plotted, with a shaded background between them.
◉ Progress & Proximity
• Relative position of the price to the Bollinger basis is expressed as percentages (qPlus/qMinus).
• “Near band” conditions are triggered when price progress toward the upper or lower band exceeds a user-defined threshold (%).
• A signed score (sScore) represents how far the close has moved above or below the basis relative to band width.
◉ Info Table
• Optional compact table summarizing:
• - Upper/lower band margins
• - Buyer/seller volumes with moving averages
• - Delta and cumulative delta
• - Buyer/seller ratios per bar and across the window
• - Money flow values (buy/sell/delta × price) for bar-level and summed periods
• The table is neutral-colored and resizable for different chart layouts.
◉ Zone Event Gate
• Tracks entry into and exit from “near band” zones.
• Arming logic: a side is armed when price enters a band proximity zone.
• Trigger logic: on exit, a trade event is generated if cumulative buyer or seller volume dominates over a configurable window.
◉ Trading Logic
• Orders are placed only on zone-exit events, conditional on volume dominance.
• Position sizing is defined as a fixed percentage of strategy equity.
• Long entries occur when leaving the lower zone with buyer dominance; short entries occur when leaving the upper zone with seller dominance.
◉ Exit Rules
• Open positions are managed by a strict priority sequence:
• 1. Stop-loss (% of entry price)
• 2. Take-profit (% of entry price)
• 3. Opposite-side event (zone exit with dominance in the other direction)
• Stop-loss and take-profit levels are configurable
◉ Notes
• This lite version is intended to demonstrate the interaction of Bollinger Bands and volume-based dominance logic.
• It provides a framework to observe how price reacts at band boundaries under varying buy/sell pressure, and how zone exits can be systematically converted into entry/exit signals.
When configuring this strategy, it is essential to carefully review the settings within the Strategy Tester. Ensure that the chosen parameters and historical data options are correctly aligned with the intended use. Accurate back testing depends on applying proper configurations for historical reference. The figure below illustrates sample result and configuration type.

LP Sweep / Reclaim & Breakout Grading: Long-onlySignals
1) LP Sweep & Reclaim (mean-reversion entry)
Compute LP bounds from prior-bar window extremes:
lpLL_prev = lowest low of the last N bars (offset 1).
lpHH_prev = highest high of the last N bars (offset 1).
Sweep long trigger: current low dips below lpLL_prev and closes back above it.
Real-time quality grading (A/B/C) for sweep:
Trend filter & slope via EMA(88).
BOS bonus: close > last confirmed swing high.
Body size vs ATR, location above a long EMA, headroom to swing high (penalty if too close), and multi-sweep count bonus.
Sum → score → grade A/B/C; A or B required for sweep entry.
2) Trend Breakout (momentum entry)
Core trigger: close > previous Donchian high (length boLen) + ATR buffer.
Optional filter: close must be above the default EMA.
Breakout grading (A/B/C) in real time combining:
Trend up (price > EMA and EMA rising),
Body/ATR, Gap above breakout level (in ATR),
Volume vs MA,
Upper-wick penalty,
Position-in-Score: headroom to last swing high (penalty if too near) + EMA slope bonus.
Sum → score → A or B required if grading enabled.

Optimized ADX DI CCI Strategy### Key Features:
- Combines ADX, DI+/-, CCI, and RSI for signal generation.
- Supports customizable timeframes for indicators.
- Offers multiple exit conditions (Moving Average cross, ADX change, performance-based stop-loss).
- Tracks and displays trade statistics (e.g., win rate, capital growth, profit factor).
- Visualizes trades with labels and optional background coloring.
- Allows countertrading (opening an opposite trade after closing one).
1. **Indicator Calculation**:
- **ADX and DI+/-**: Calculated using the `ta.dmi` function with user-defined lengths for DI and ADX smoothing.
- **CCI**: Computed using the `ta.cci` function with a configurable source (default: `hlc3`) and length.
- **RSI (optional)**: Calculated using the `ta.rsi` function to filter overbought/oversold conditions.
- **Moving Averages**: Used for CCI signal smoothing and trade exits, with support for SMA, EMA, SMMA (RMA), WMA, and VWMA.
2. **Signal Generation**:
- **Buy Signal**: Triggered when DI+ > DI- (or DI+ crosses over DI-), CCI > MA (or CCI crosses over MA), and optional ADX/RSI filters are satisfied.
- **Sell Signal**: Triggered when DI+ < DI- (or DI- crosses over DI+), CCI < MA (or CCI crosses under MA), and optional ADX/RSI filters are satisfied.
3. **Trade Execution**:
- **Entry**: Long or short trades are opened using `strategy.entry` when signals are detected, provided trading is allowed (`allow_long`/`allow_short`) and equity is positive.
- **Exit**: Trades can be closed based on:
- Opposite signal (if no other exit conditions are used).
- MA cross (price crossing below/above the exit MA for long/short trades).
- ADX percentage change exceeding a threshold.
- Performance-based stop-loss (trade loss exceeding a percentage).
- **Countertrading**: If enabled, closing a trade triggers an opposite trade (e.g., closing a long opens a short).
4. **Visualization**:
- Labels are plotted at trade entries/exits (e.g., "BUY," "SELL," arrows).
- Optional background coloring highlights open trades (green for long, red for short).
- A statistics table displays real-time metrics (e.g., capital, win rates).
5. **Trade Tracking**:
- Tracks the number of long/short trades, wins, and overall performance.
- Monitors equity to prevent trading if it falls to zero.
### 2.3 Key Components
- **Indicator Calculations**: Uses `request.security` to fetch indicator data for the specified timeframe.
- **MA Function**: A custom `ma_func` handles different MA types for CCI and exit conditions.
- **Signal Logic**: Combines crossover/under checks with recent bar windows for flexibility.
- **Exit Conditions**: Multiple configurable exit strategies for risk management.
- **Statistics Table**: Updates dynamically with trade and capital metrics.
## 3. Configuration Options
The script provides extensive customization through input parameters, grouped for clarity in the TradingView settings panel. Below is a detailed breakdown of each setting and its impact.
### 3.1 Strategy Settings (Global)
- **Initial Capital**: Default `10000`. Sets the starting capital for backtesting.
- **Effect**: Determines the base equity for calculating position sizes and performance metrics.
- **Default Quantity Type**: `strategy.percent_of_equity` (50% of equity).
- **Effect**: Controls the size of each trade as a percentage of available equity.
- **Pyramiding**: Default `2`. Allows up to 2 simultaneous trades in the same direction.
- **Effect**: Enables multiple entries if conditions are met, increasing exposure.
- **Commission**: 0.2% per trade.
- **Effect**: Simulates trading fees, reducing net profit in backtesting.
- **Margin**: 100% for long and short trades.
- **Effect**: Assumes no leverage; adjust for margin trading simulations.
- **Calc on Every Tick**: `true`.
- **Effect**: Ensures real-time signal updates for precise execution.
### 3.2 Indicator Settings
- **Indicator Timeframe** (`indicator_timeframe`):
- **Options**: `""` (chart timeframe), `1`, `5`, `15`, `30`, `60`, `240`, `D`, `W`.
- **Default**: `""` (uses chart timeframe).
- **Effect**: Determines the timeframe for ADX, DI, CCI, and RSI calculations. A higher timeframe reduces noise but may delay signals.
### 3.3 ADX & DI Settings
- **DI Length** (`adx_di_len`):
- **Default**: `30`.
- **Range**: Minimum `1`.
- **Effect**: Sets the period for calculating DI+ and DI-. Longer periods smooth trends but reduce sensitivity.
- **ADX Smoothing Length** (`adx_smooth_len`):
- **Default**: `14`.
- **Range**: Minimum `1`.
- **Effect**: Smooths the ADX calculation. Longer periods produce smoother ADX values.
- **Use ADX Filter** (`use_adx_filter`):
- **Default**: `false`.
- **Effect**: If `true`, requires ADX to exceed the threshold for signals to be valid, filtering out weak trends.
- **ADX Threshold** (`adx_threshold`):
- **Default**: `25`.
- **Range**: Minimum `0`.
- **Effect**: Sets the minimum ADX value for valid signals when the filter is enabled. Higher values restrict trades to stronger trends.
### 3.4 CCI Settings
- **CCI Length** (`cci_length`):
- **Default**: `20`.
- **Range**: Minimum `1`.
- **Effect**: Sets the period for CCI calculation. Longer periods reduce noise but may lag.
- **CCI Source** (`cci_src`):
- **Default**: `hlc3` (average of high, low, close).
- **Effect**: Defines the price data for CCI. `hlc3` is standard, but users can choose other sources (e.g., `close`).
- **CCI MA Type** (`ma_type`):
- **Options**: `SMA`, `EMA`, `SMMA (RMA)`, `WMA`, `VWMA`.
- **Default**: `SMA`.
- **Effect**: Determines the moving average type for CCI signal smoothing. EMA is more responsive; VWMA weights by volume.
- **CCI MA Length** (`ma_length`):
- **Default**: `14`.
- **Range**: Minimum `1`.
- **Effect**: Sets the period for the CCI MA. Longer periods smooth the MA but may delay signals.
### 3.5 RSI Filter Settings
- **Use RSI Filter** (`use_rsi_filter`):
- **Default**: `false`.
- **Effect**: If `true`, applies RSI-based overbought/oversold filters to signals.
- **RSI Length** (`rsi_length`):
- **Default**: `14`.
- **Range**: Minimum `1`.
- **Effect**: Sets the period for RSI calculation. Longer periods reduce sensitivity.
- **RSI Lower Limit** (`rsi_lower_limit`):
- **Default**: `30`.
- **Range**: `0` to `100`.
- **Effect**: Defines the oversold threshold for buy signals. Lower values allow trades in more extreme conditions.
- **RSI Upper Limit** (`rsi_upper_limit`):
- **Default**: `70`.
- **Range**: `0` to `100`.
- **Effect**: Defines the overbought threshold for sell signals. Higher values allow trades in more extreme conditions.
### 3.6 Signal Settings
- **Cross Window** (`cross_window`):
- **Default**: `0`.
- **Range**: `0` to `5` bars.
- **Effect**: Specifies the lookback period for detecting DI+/- or CCI crosses. `0` requires crosses on the current bar; higher values allow recent crosses, increasing signal frequency.
- **Allow Long Trades** (`allow_long`):
- **Default**: `true`.
- **Effect**: Enables/disables new long trades. If `false`, only closing existing longs is allowed.
- **Allow Short Trades** (`allow_short`):
- **Default**: `true`.
- **Effect**: Enables/disables new short trades. If `false`, only closing existing shorts is allowed.
- **Require DI+/DI- Cross for Buy** (`buy_di_cross`):
- **Default**: `true`.
- **Effect**: If `true`, requires a DI+ crossover DI- for buy signals; if `false`, DI+ > DI- is sufficient.
- **Require CCI Cross for Buy** (`buy_cci_cross`):
- **Default**: `true`.
- **Effect**: If `true`, requires a CCI crossover MA for buy signals; if `false`, CCI > MA is sufficient.
- **Require DI+/DI- Cross for Sell** (`sell_di_cross`):
- **Default**: `true`.
- **Effect**: If `true`, requires a DI- crossover DI+ for sell signals; if `false`, DI+ < DI- is sufficient.
- **Require CCI Cross for Sell** (`sell_cci_cross`):
- **Default**: `true`.
- **Effect**: If `true`, requires a CCI crossunder MA for sell signals; if `false`, CCI < MA is sufficient.
- **Countertrade** (`countertrade`):
- **Default**: `true`.
- **Effect**: If `true`, closing a trade triggers an opposite trade (e.g., close long, open short) if allowed.
- **Color Background for Open Trades** (`color_background`):
- **Default**: `true`.
- **Effect**: If `true`, colors the chart background green for long trades and red for short trades.
### 3.7 Exit Settings
- **Use MA Cross for Exit** (`use_ma_exit`):
- **Default**: `true`.
- **Effect**: If `true`, closes trades when the price crosses the exit MA (below for long, above for short).
- **MA Length for Exit** (`ma_exit_length`):
- **Default**: `20`.
- **Range**: Minimum `1`.
- **Effect**: Sets the period for the exit MA. Longer periods delay exits.
- **MA Type for Exit** (`ma_exit_type`):
- **Options**: `SMA`, `EMA`, `SMMA (RMA)`, `WMA`, `VWMA`.
- **Default**: `SMA`.
- **Effect**: Determines the MA type for exit signals. EMA is more responsive; VWMA weights by volume.
- **Use ADX Change Stop-Loss** (`use_adx_stop`):
- **Default**: `false`.
- **Effect**: If `true`, closes trades when the ADX changes by a specified percentage.
- **ADX % Change for Stop-Loss** (`adx_change_percent`):
- **Default**: `5.0`.
- **Range**: Minimum `0.0`, step `0.1`.
- **Effect**: Specifies the percentage change in ADX (vs. previous bar) that triggers a stop-loss. Higher values reduce premature exits.
- **Use Performance Stop-Loss** (`use_perf_stop`):
- **Default**: `false`.
- **Effect**: If `true`, closes trades when the loss exceeds a percentage threshold.
- **Performance Stop-Loss (%)** (`perf_stop_percent`):
- **Default**: `-10.0`.
- **Range**: `-100.0` to `0.0`, step `0.1`.
- **Effect**: Specifies the loss percentage that triggers a stop-loss. More negative values allow larger losses before exiting.
## 4. Visual and Statistical Output
- **Labels**: Displayed at trade entries/exits with arrows (↑ for buy, ↓ for sell) and text ("BUY," "SELL"). A "No Equity" label appears if equity is zero.
- **Background Coloring**: Optionally colors the chart background (green for long, red for short) to indicate open trades.
- **Statistics Table**: Displayed at the top center of the chart, updated on timeframe changes or trade events. Includes:
- **Capital Metrics**: Initial capital, current capital, capital growth (%).
- **Trade Metrics**: Total trades, long/short trades, win rate, long/short win rates, profit factor.
- **Open Trade Status**: Indicates if a long, short, or no trade is open.
## 5. Alerts
- **Buy Signal Alert**: Triggered when `buy_signal` is true ("Cross Buy Signal").
- **Sell Signal Alert**: Triggered when `sell_signal` is true ("Cross Sell Signal").
- **Usage**: Users can set up TradingView alerts to receive notifications for trade signals.

The Barking Rat LiteMomentum & FVG Reversion Strategy
The Barking Rat Lite is a disciplined, short-term mean-reversion strategy that combines RSI momentum filtering, EMA bands, and Fair Value Gap (FVG) detection to identify short-term reversal points. Designed for practical use on volatile markets, it focuses on precise entries and ATR-based take profit management to balance opportunity and risk.
Core Concept
This strategy seeks potential reversals when short-term price action shows exhaustion outside an EMA band, confirmed by momentum and FVG signals:
EMA Bands:
Parameters used: A 20-period EMA (fast) and 100-period EMA (slow).
Why chosen:
- The 20 EMA is sensitive to short-term moves and reflects immediate momentum.
- The 100 EMA provides a slower, structural anchor.
When price trades outside both bands, it often signals overextension relative to both short-term and medium-term trends.
Application in strategy:
- Long entries are only considered when price dips below both EMAs, identifying potential undervaluation.
- Short entries are only considered when price rises above both EMAs, identifying potential overvaluation.
This dual-band filter avoids counter-trend signals that would occur if only a single EMA was used, making entries more selective..
Fair Value Gap Detection (FVG):
Parameters used: The script checks for dislocations using a 12-bar lookback (i.e. comparing current highs/lows with values 12 candles back).
Why chosen:
- A 12-bar displacement highlights significant inefficiencies in price structure while filtering out micro-gaps that appear every few bars in high-volatility markets.
- By aligning FVG signals with candle direction (bullish = close > open, bearish = close < open), the strategy avoids random gaps and instead targets ones that suggest exhaustion.
Application in strategy:
- Bullish FVGs form when earlier lows sit above current highs, hinting at downward over-extension.
- Bearish FVGs form when earlier highs sit below current lows, hinting at upward over-extension.
This gives the strategy a structural filter beyond simple oscillators, ensuring signals have price-dislocation context.
RSI Momentum Filter:
Parameters used: 14-period RSI with thresholds of 80 (overbought) and 20 (oversold).
Why chosen:
- RSI(14) is a widely recognized momentum measure that balances responsiveness with stability.
- The thresholds are intentionally extreme (80/20 vs. the more common 70/30), so the strategy only engages at genuine exhaustion points rather than frequent minor corrections.
Application in strategy:
- Longs trigger when RSI < 20, suggesting oversold exhaustion.
- Shorts trigger when RSI > 80, suggesting overbought exhaustion.
This ensures entries are not just technically valid but also backed by momentum extremes, raising conviction.
ATR-Based Take Profit:
Parameters used: 14-period ATR, with a default multiplier of 4.
Why chosen:
- ATR(14) reflects the prevailing volatility environment without reacting too much to outliers.
- A multiplier of 4 is a pragmatic compromise: wide enough to let trades breathe in volatile conditions, but tight enough to enforce disciplined exits before mean reversion fades.
Application in strategy:
- At entry, a fixed target is set = Entry Price ± (ATR × 4).
- This target scales automatically with volatility: narrower in calm periods, wider in explosive markets.
By avoiding discretionary exits, the system maintains rule-based discipline.
Visual Signals on Chart
Blue “▲” below candle: Potential long entry
Orange/Yellow “▼” above candle: Potential short entry
Green “✔️”: Trade closed at ATR take profit
Blue (20 EMA) & Orange (100 EMA) lines: Dynamic channel reference
⚙️Strategy report properties
Position size: 25% equity per trade
Initial capital: 10,000.00 USDT
Pyramiding: 10 entries per direction
Slippage: 2 ticks
Commission: 0.055% per side
Backtest timeframe: 1-minute
Backtest instrument: HYPEUSDT
Backtesting range: Jul 28, 2025 — Aug 17, 2025
Note on Sample Size:
You’ll notice the report displays fewer than the ideal 100 trades in the strategy report above. This is intentional. The goal of the script is to isolate high-quality, short-term reversal opportunities while filtering out low-conviction setups. This means that the Barking Rat Lite strategy is very selective, filtering out over 90% of market noise. The brief timeframe shown in the strategy report here illustrates its filtering logic over a short window — not its full capabilities. As a result, even on lower timeframes like the 1-minute chart, signals are deliberately sparse — each one must pass all criteria before triggering.
For a larger dataset:
Once the strategy is applied to your chart, users are encouraged to expand the lookback range or apply the strategy to other volatile pairs to view a full sample.
💡Why 25% Equity Per Trade?
While it's always best to size positions based on personal risk tolerance, we defaulted to 25% equity per trade in the backtesting data — and here’s why:
Backtests using this sizing show manageable drawdowns even under volatile periods.
The strategy generates a sizeable number of trades, reducing reliance on a single outcome.
Combined with conservative filters, the 25% setting offers a balance between aggression and control.
Users are strongly encouraged to customize this to suit their risk profile.
What makes Barking Rat Lite valuable
Combines multiple layers of confirmation: EMA bands + FVG + RSI
Adaptive to volatility: ATR-based exits scale with market conditions
Clear, actionable visuals: Easy to monitor and manage trades

Hassi XAUUSD Advanced FVG EMA/BOS/RSI/Volume + Session FilterWhat it does :
This strategy automates a popular ICT-style idea on XAUUSD (Gold): trade only when price taps back into a Fair Value Gap (FVG), but filter entries with trend, structure, momentum, volume, and session rules. It manages risk with fixed TP/SL (points) and shows a compact backtest panel on chart.
Core Logic
1) Market Structure (BOS)
Detects recent swing highs/lows and flags a Break of Structure:
BOS Up when price breaks the latest swing high.
BOS Down when price breaks the latest swing low.
2) FVG Detection (3-candle)
Bullish FVG when low > high and low > high .
Bearish FVG when high < low and high < low .
The most recent qualifying gap is drawn as a shaded box (optional).
3) Bias & Filters
Trend Bias: price vs EMA (default 200). Longs only above EMA; shorts only below.
Momentum: optional RSI filter (default 14); avoid longs in OB & shorts in OS.
Volume: optional filter requiring current volume > SMA(20) × multiplier.
Sessions: optional London / New York (PKT) time windows.
Entries & Exits
Long Entry (all must be true)
Above EMA, RSI bullish, volume ok, session ok, BOS Up.
A recent Bullish FVG exists (within N bars).
Price taps back into the FVG (low ≤ top & close > bottom) with a bullish candle.
Short Entry (mirror)
Below EMA, RSI bearish, volume ok, session ok, BOS Down.
A recent Bearish FVG exists (within N bars).
Price taps (high ≥ bottom & close < top) with a bearish candle.
Risk / R:R
Exits use fixed points on XAUUSD (default TP 100, SL 50).
On many gold feeds 1.0 = 10 points; inputs convert to price automatically.
“One-trade-at-a-time”: a new signal won’t fire until the previous position is flat.
Chart Labels
On entry, the script plots BUY/SELL plus fixed TP/SL lines & labels anchored to the entry bar (they don’t drift with price).
Visuals & Tools
EMA line (green/red by bias).
Swing points (tiny triangles) to see structure.
FVG boxes (green/red, optional).
Session shading (subtle blue overlay).
Stats Panel (top-right):
Total Trades, TP Hits, SL Hits, Win Rate, Profit Factor, Net P&L.
Inputs (quick guide)
EMA Length (default 200)
Swing Lookback for BOS (default 5)
FVG Box Length (how far the zone extends to the right)
TP / SL (points) for XAUUSD + display Risk:Reward
Sessions (PKT): London & New York windows + toggle
Filters: Volume (multiplier), RSI (length, OB/OS)
Visibility: show/hide FVG boxes & TP/SL drawings
Alerts
Buy Signal / Sell Signal on valid entries
Position Opened / Position Closed notifications
Best Practices & Notes
Designed for XAUUSD 15-minute. You can test other timeframes, but retune TP/SL points and filters accordingly.
Broker ticks differ: if your symbol steps are not 0.1, adjust TP/SL points.
Use with a HTF confluence (e.g., D1/4H bias, key S/R, news awareness).
Backtests are approximations; real results vary with spreads, slippage, and execution.
Disclaimer: This tool is for educational purposes. It is not financial advice. Always test before using on live capital.
