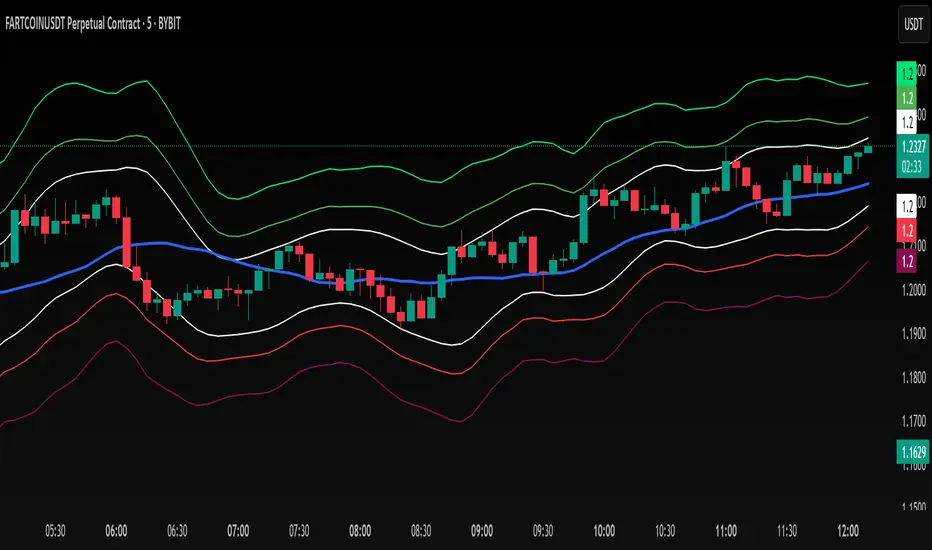
Outside the Bollinger Bands Alerting Indicator Overview
The Outside the Bollinger Bands Alerting Indicator is a comprehensive technical analysis tool that combines multiple proven
indicators into a single, powerful system designed to identify high-probability reversal patterns at Bollinger Band extremes. This
indicator goes beyond simple band touches to detect sophisticated pattern formations that often signal strong directional moves.
Key Features & Capabilities
🎯 Advanced Pattern Recognition
Bollinger Band Breakout Patterns
- Detects "pierce-and-reject" formations where price breaks through a Bollinger Band but immediately reverses back inside
- Identifies failed breakouts that often lead to strong moves in the opposite direction
- Combines multiple confirmation signals: engulfing candle patterns, MACD momentum, and ATR volatility filters
- Visual alerts with symbols positioned below (bullish) or above (bearish) candles
Tweezer Top & Bottom Patterns
- Identifies consecutive candles with nearly identical highs (tweezer tops) or lows (tweezer bottoms)
- Requires at least one candle to breach the respective Bollinger Band
- Confirms reversal with directional close requirements
- Customizable tolerance settings for pattern sensitivity
- Visual alerts with ❙❙ symbols for easy identification
📊 Multi-Indicator Integration
Bollinger Bands Indicator
- Dual-band configuration with outer (2.0 std dev) and inner (1.5 std dev) bands that can be adjusted to suit your own parameters
- Configurable MA types: SMA, EMA, SMMA (RMA), WMA, VWMA
- Customizable length, source, and offset parameters
- Color-coded band fills for visual clarity
Moving Average Suite
- EMA 9, 21, 50, and 200 (individually toggleable)
- Special "SMA 3 High" for help visualizing and detecting Bollinger Band break-outs
- Dynamic color coding based on price relationship
Optional Ichimoku Cloud overlay
- Complete Ichimoku implementation with customizable periods
- Dynamic cloud coloring based on trend direction
- Toggleable overlay that doesn't interfere with other indicators
🚨 Comprehensive Alert System
Real-Time JSON Alerts
- Sends structured data on every confirmed bar close
- Includes all indicator values: BB levels, EMAs, MACD, RSI
- Contains signal states and crossover conditions
- Perfect for automated trading systems and webhooks
{"timestamp":1753118700000,"symbol":"ETHUSD","timeframe":"5","price":3773.3,"bollinger_bands":{"upper":3826.95,"basis":3788.32,"lower":3749.68},"emas":{"ema_9":3780.45,"ema_21":3788.92,"ema_50":3800.79,"ema_200":3787.74,"sma_3_high":3789.45},"macd":{"macd":-10.1932,"signal":-11.3266,"histogram":1.1334},"rsi":{"rsi":40.5,"rsi_ma":39.32,"level":"neutral"}}
Specific Alert Conditions
- MACD histogram state changes (rising to falling, falling to rising)
- RSI overbought/oversold crossovers
- All pattern detections (BB Bounce, Tweezer patterns)
- Bollinger Band breakout alerts
🎨 Visual Elements
Pattern Identification
- ♻ symbols for Bollinger Band breakout patterns (green for bullish, red for bearish)
- ❙❙ symbols for tweezer patterns (green below for bottoms, red above for tops)
- Color-coded band fills for trend visualization
Chart Overlay Options
- All moving averages with distinct colors
- Bollinger Bands with inner and outer boundaries
- Optional Ichimoku cloud with trend-based coloring
Trading Applications
Reversal Trading
- Identify high-probability reversal points at extreme price levels
- Use failed breakout patterns for entry signals
- Combine multiple timeframes for enhanced accuracy
Trend Analysis
- Monitor moving average relationships for trend direction
- Use Ichimoku cloud for trend strength assessment
- Track momentum with MACD and RSI integration
Risk Management
- ATR-based volatility filtering reduces false signals
- Multiple confirmation requirements improve signal quality
- Real-time alerts enable prompt decision making
Suggested Use
- Use on multiple timeframes for confluence
- Combine with support/resistance levels for enhanced accuracy
- Set up alerts for hands-free monitoring
- Customize settings based on market volatility and trading style
- Consider volume confirmation for stronger signals
ค้นหาในสคริปต์สำหรับ "bands"
Jose's Rolling VWAP with BandsRolling VWAP with Customizable Deviation Bands
This indicator plots a rolling Volume Weighted Average Price (VWAP) over a user-defined lookback period, rather than resetting each day or from a fixed anchor point. The rolling calculation makes it act more like a moving average — but weighted by volume — providing a smoother, more adaptive central price line.
It also includes up to three optional deviation bands, which can be independently toggled on/off and assigned their own multipliers. These bands are calculated using the chosen lookback’s standard deviation, giving traders a quick visual of price dispersion around VWAP.
Features:
Adjustable rolling VWAP lookback length
Up to 3 customizable standard deviation bands
Individual checkboxes for enabling/disabling each band
Independent multiplier control for each band
Works on any timeframe and symbol
Uses:
Identify overextended price moves relative to VWAP
Spot dynamic support/resistance zones
Gauge mean reversion opportunities
Confirm trend strength when price hugs or breaks away from VWAP
Hunting Bollinger Bands for scalping📌 Bollinger Band Reversal BUY/SELL Indicator
Name: Hunting Bollinger Bands for scalping
Purpose: Displays reversal signals for short-term scalping in range-bound markets.
Target Users: Scalpers and day traders, especially for trading Gold (XAU/USD).
Recommended Target: Works well for scalping approximately $3 price movements on Gold.
Core Logic:
Detects excessive price deviation using Bollinger Bands (±2σ).
Filters out excessive signals with a bar interval limiter.
Displays clear and simple BUY/SELL labels for entry timing.
📌 Signal Conditions
BUY
Price closes below the Lower Bollinger Band.
At least the specified number of bars has passed since the previous signal.
Displays a “BUY” label below the bar.
SELL
Price closes above the Upper Bollinger Band.
At least the specified number of bars has passed since the previous signal.
Displays a “SELL” label above the bar.
📌 Parameters
Parameter Description Default
Bollinger Band Length (bbLength) Period for Bollinger Band calculation 20
Standard Deviation (bbStdDev) Standard deviation multiplier for band width 2.0
Signal Interval (barLimit) Minimum bar interval to avoid repeated signals 10
📌 How to Use
Add the indicator to your chart; Bollinger Bands and BUY/SELL labels will appear.
When a signal appears, confirm price reaction and enter a scalp trade (around $3 for Gold is recommended).
Adjust the “Signal Interval (barLimit)” to control signal frequency.
Avoid using it during high-impact news events or strong trending markets.
📌 Best Market Conditions
Range-bound markets
Scalping small price movements (~$3)
Low-volatility sessions (e.g. Asian session for Gold)
📌 Notes
May generate frequent signals during strong trends, leading to potential losses.
Can be combined with other indicators (e.g. 200 MA, RSI, VWAP) for higher accuracy.
Signals are for reference only and should not be used as the sole trading decision factor.
📌 ボリンジャーバンド逆張りBUY/SELL インジケーター解説
名前:Hunting Bollinger Bands for scalping
目的:レンジ相場での短期的な反発を狙った逆張りシグナルを表示
対象ユーザー:スキャルピングやデイトレードで、特にゴールド(XAU/USD)での小幅な値動きを狙うトレーダー
推奨利幅:ゴールドでおよそ 3ドル前後 を目安にスキャルピングを行うと有効
メインロジック:
ボリンジャーバンド(±2σ)で過剰な価格乖離を検出
バー間隔フィルターで過剰シグナルを制御
BUY/SELLラベルで視覚的にシンプルなエントリーポイントを表示
📌 シグナル条件
BUY(買いシグナル)
現在価格が ボリンジャーバンド下限(Lower Band)を下回った時
前回シグナルから指定したバー数以上経過
この条件を満たした場合、ローソク足下に「BUY」ラベルを表示します。
SELL(売りシグナル)
現在価格が ボリンジャーバンド上限(Upper Band)を上回った時
前回シグナルから指定したバー数以上経過
この条件を満たした場合、ローソク足上に「SELL」ラベルを表示します。
📌 パラメータ
項目 説明 初期値
ボリンジャーバンド期間 (bbLength) ボリンジャーバンド計算の期間 20
標準偏差 (bbStdDev) バンド幅を決める標準偏差 2.0
シグナル間隔 (barLimit) シグナルの連続表示を防止する最小バー間隔 10
📌 使い方
インジケーターをチャートに追加すると、ボリンジャーバンドとBUY/SELLラベルが表示されます
シグナルが出たら、反発確認後にスキャルピングエントリー(ゴールドなら約3ドルを目安に)
「シグナル間隔(barLimit)」を調整して、シグナルの過剰表示を防ぐ
経済指標発表や強いトレンド発生時は使用を控える
📌 このインジケーターが向いている相場
レンジ相場
小さな値幅(約3ドル前後)を狙うスキャルピング
トレンドが弱い横ばいの時間帯(例:アジア時間のゴールドなど)
📌 注意点
強いトレンド相場では、逆張りシグナルが連続的に発生し、損切りが増える可能性あり
200MAやRSI、VWAPなど他の指標と組み合わせることで精度を高められる
シグナルは参考用であり、単独での売買判断は推奨されない
AI Breakout Bands (Zeiierman)█ Overview
AI Breakout Bands (Zeiierman) is an adaptive trend and breakout detection system that combines Kalman filtering with advanced K-Nearest Neighbor (KNN) smoothing. The result is a smart, self-adjusting band structure that adapts to dynamic market behavior, identifying breakout conditions with precision and visual clarity.
At its core, this indicator estimates price behavior using a two-dimensional Kalman filter (position + velocity), then enhances the smoothing process with a nonlinear, similarity-based KNN filter. This unique blend enables it to handle noisy markets and directional shifts with both speed and stability — providing breakout traders and trend followers a reliable framework to act on.
Whether you're identifying volatility expansions, capturing trend continuations, or spotting early breakout conditions, AI Breakout Bands gives you a mathematically grounded, visually adaptive roadmap of real-time market structure.
█ How It Works
⚪ Kalman Filter Engine
The Kalman filter models price movement as a state system with two components:
Position (price)
Velocity (trend direction)
It recursively updates predictions using real-time price as a noisy observation, balancing responsiveness with smoothness.
Process Noise (Position) controls sensitivity to sudden moves.
Process Noise (Velocity) controls smoothing of directional flow.
Measurement Noise (R) defines how much the filter "trusts" live price data.
This component alone creates a responsive yet stable estimate of the market’s center of gravity.
⚪ Advanced K-Neighbor Smoothing
After the Kalman estimate is computed, the script applies a custom K-Nearest Neighbor (KNN) smoother.
Rather than averaging raw values, this method:
Finds K most similar past Kalman values
Weighs them by similarity (inverse of absolute distance)
Produces a smoother that emphasizes structural similarity
This nonlinear approach gives the indicator an AI feature — reacting fast when needed, yet staying calm in consolidation.
█ How to Use
⚪ Trend Recognition
The line color shifts dynamically based on slope direction and breakout confirmation.
Bullish conditions: price above the mid band with positive slope
Bearish conditions: price below the mid band with negative slope
⚪ Breakout Signals
Price breaking above or below the bands may signal momentum acceleration.
Combine with your own volume or momentum confirmation for stronger entries.
Bands adapt to market noise, helping filter out low-quality whipsaws.
█ Settings
Process Noise (Position): Controls Kalman filter’s sensitivity to price changes.
Process Noise (Velocity): Controls smoothing of directional component.
Measurement Noise (R): Defines how much trust is placed in price data.
K-Neighbor Length: Number of historical Kalman values considered for smoothing.
Slope Calculation Window: Number of bars used to compute trend slope of the smoothed Kalman.
Band Lookback (MAE): Rolling period for average absolute error.
Band Multiplier: Multiplies MAE to determine band width.
-----------------
Disclaimer
The content provided in my scripts, indicators, ideas, algorithms, and systems is for educational and informational purposes only. It does not constitute financial advice, investment recommendations, or a solicitation to buy or sell any financial instruments. I will not accept liability for any loss or damage, including without limitation any loss of profit, which may arise directly or indirectly from the use of or reliance on such information.
All investments involve risk, and the past performance of a security, industry, sector, market, financial product, trading strategy, backtest, or individual's trading does not guarantee future results or returns. Investors are fully responsible for any investment decisions they make. Such decisions should be based solely on an evaluation of their financial circumstances, investment objectives, risk tolerance, and liquidity needs.
Volatility with Sigma BandsOverview
The Volatility Analysis with Sigma Bands indicator is a powerful and flexible tool designed for traders who want to gain deeper insights into market price fluctuations. It calculates historical volatility within a user-defined time range and displays ±1σ, ±2σ, and ±3σ standard deviation bands, helping traders identify potential support, resistance levels, and extreme price behaviors.
Key Features
Multiple Volatility Band Displays:
±1σ Range (Yellow line): Covers approximately 68% of price fluctuations.
±2σ Range (Blue line): Covers approximately 95% of price fluctuations.
±3σ Range (Fuchsia line): Covers approximately 99% of price fluctuations.
Dynamic Probability Mode:
Toggle between standard normal distribution probabilities (68.2%, 95.4%, 99.7%) and actual historical probability calculations, allowing for more accurate analysis tailored to varying market conditions.
Highly Customizable Label Display:
The label shows:
Real-time volatility
Annualized volatility
Current price
Price ranges for each σ level
Users can adjust the label’s position and horizontal offset to prevent it from overlapping key price areas.
Real-Time Calculation & Visualization:
The indicator updates in real-time based on the selected time range and current market data, making it suitable for day trading, swing trading, and long-term trend analysis.
Use Cases
Risk Management:
Understand the distribution probabilities of price within different standard deviation bands to set more effective stop-loss and take-profit levels.
Trend Confirmation:
Determine trend strength or spot potential reversals by observing whether the price breaks above or below ±1σ or ±2σ ranges.
Market Sentiment Analysis:
Price movement beyond the ±3σ range often indicates extreme market sentiment, providing potential reversal opportunities.
Backtesting and Historical Analysis:
Utilize the customizable time range feature to backtest volatility during various periods, providing valuable insights for strategy refinement.
The Volatility Analysis with Sigma Bands indicator is an essential tool for traders seeking to understand market volatility patterns. Whether you're a day trader looking for precise entry and exit points or a long-term investor analyzing market behavior, this indicator provides deep insights into volatility dynamics, helping you make more confident trading decisions.
Quadratic Weighted Bands"Quadratic Weighted Bands" (QWB) is designed to identify and visualize market trends and volatility using quadratic weighted filtering techniques. It works by applying quadratic weighting to a selected data source over a specified length, enhancing the sensitivity and responsiveness of the indicator to recent market movements. A major advantage of this indicator is the ability to have a longer lookback period without having too much lag. This results in a smoother output that is still very responsive. Its about twice as fast as a normal average so adjust accordingly.
The indicator is customizable, allowing users to select between the normal Quadratic Weighting (QWF) and Volume Quadratic Weighting (VQWF), choose their data source, adjust the lookback period, and modify the deviation multiplier to fit their analysis needs. Additionally, users can customize the colors of the bands and center line.
The color of the central line changes based on the direction of the trend, as well as having a neutral (ranging) color. This visual aspect makes it easier for traders to quickly see the strength and direction of the market.
Style Select: Choose between "Normal Quadratic Weighting" or "Volume Quadratic Weighting" to adapt the indicator based on volume data or standard price data.
Source: This allows for the selection of the input source for the indicator, such as HL2, ensuring the analysis is aligned with specific trading preferences.
Length: Define the lookback period for the average, with the system automatically utilizing the maximum available length if the specified range exceeds available data, ensuring it always works.
Deviation Length: Optionally adjust the lookback period for calculating deviation, enhancing the indicator's sensitivity and accuracy in identifying market volatility.
Multiplier: Fine tune the deviation multiplier to control the width of the bands, allowing traders to adjust for market volatility and personal risk tolerance.
Top Color: Customize the color of the top band, which also affects the center line's appearance. Adjusting the brightness provides visual clarity and personalization.
Bottom Color: Similarly, select the color for the bottom band, which also influences the center line. The option to adjust brightness ensures the indicator's readability and aesthetic preference.
Neutral Color: Designate a color for indicating a ranging market.
Enjoy
Bandwidth Bands - Silverman's rule of thumbWhat are Bandwidth Bands?
This indicator uses Silverman Rule of Thumb Bandwidth to estimate the width of bands around the rolling moving average which takes in the log transformation of price to remove most of price skewness for the rest of the volatility calculations and then a exp() function is performed to convert it back to a right skewed distribution. These bandwidths bands could offer insights into price volatility and trading extremes.
Silverman rule of thumb bandwidth:
The Silverman Rule of Thumb Bandwidth is a heuristic method used to estimate the optimal bandwidth for kernel density estimation, a statistical technique for estimating the probability density function of a random variable. In the context of financial analysis, such as in this indicator, it helps determine the width of bands around a moving average, providing insights into the level of volatility in the market. This method is particularly useful because it offers a quick and straightforward way to estimate bandwidth without requiring extensive computational resources or complex mathematical calculation
The bandwidth estimator automatically adjust to the characteristics of the data, providing a flexible and dynamic measure of dispersion that can capture variations in volatility over time. Standard deviations alone may not be as adaptive to changes in data distributions. The Bandwidth considers the overall shape and structure of the data distribution rather than just focusing on the spread of data points.
Settings
Source
Sample length
1-4 SD options to disable or enable each band
Multi Time Frame Composite BandsMulti Time Frame Composite Bands utilizes Fibonacci numbers (5, 8, 13, 21, 34) as period lengths for calculations. The indicator calculates a composite high line (C_high) by averaging the highest prices over Fibonacci periods, incorporating moving averages (SMA) of high prices for added refinement and smoothing. Similarly, a composite low line (C_low) is calculated by averaging the lowest prices with moving averages of low prices. The midline, obtained from the mean of C_high and C_low.
This band can function as volatility bands unlike traditional volatility indicators like Bollinger Bands , ATR bands it does not use traditional measures of volatility such standard deviation , ATR. This hugs closely to the price and during trending markets the some part of the candles stay outside the band and when the entire candle digress outside the band a price correction or reversal can be anticipated. This can be considered as a smoothed Donchian channel.
MACD Bands - Multi Timeframe [TradeMaster Lite]We present a customizable MACD indicator, with the following features:
Multi-timeframe
Deviation bands to spot unusual volatility
9 Moving Average types
Conditional coloring and line crossings
👉 What is MACD?
MACD is a classic, trend-following indicator that uses moving averages to identify changes in momentum. It can be used to identify trend changes, overbought and oversold conditions, and potential reversals.
👉 Multi-timeframe:
This feature allows to analyze the same market data on multiple time frames, which can be in help to identify trends and patterns that would not be visible on a single time frame. When using the multi-timeframe feature, it is important to start with the higher time frame and then look for confirmation on the lower time frames. This will help you to avoid false signals. Please note that only timeframes higher than the chart timeframe is supported currently with this feature enabled. Might get updated in the future.
👉 Deviation bands to spot unusual volatility:
Deviation bands are plotted around the Signal line that can be in help to identify periods of unusual volatility. When the MACD line crosses outside of the deviation bands, it suggests that the market is becoming more volatile and a strong trend may form in that direction.
👉 9 Moving Average types can be used in the script. Each type of moving average offers a unique perspective and can be used in different scenarios to identify market trends.
SMA (Simple Moving Average): This calculates the average of a selected range of values, by the number of periods in that range.
SMMA (Smoothed Moving Average): This takes into account all data available and assigns equal weighting to the values.
EMA (Exponential Moving Average): This places a greater weight and significance on the most recent data points.
DEMA (Double Exponential Moving Average): This is a faster-moving average that uses a proprietary calculation to reduce the lag in data points.
TEMA (Triple Exponential Moving Average): This is even quicker than the DEMA, helping traders respond more quickly to changes in trend.
LSMA (Least Squares Moving Average): This moving average applies least squares regression method to determine the future direction of the trend.
HMA (Hull Moving Average): This moving average is designed to reduce lag and improve smoothness, providing quicker signals for short-term market movements.
VWMA (Volume Weighted Moving Average): This assigns more weight to candles with a high volume, reflecting the true average values more accurately in high volume periods.
WMA (Weighted Moving Average): This assigns more weight to the latest data, but not as much as the EMA.
👉 Conditional coloring :
This feature colors the MACD line line based on it's direction and fills the area between the MACD line and Deviation band edges to highlight the potential volatility and the strength of the momentum. This can be useful to identify when the market is trending strongly and when it is in a more neutral or choppy state.
👉 MACD Line - Signal Line crossings:
This is a classic MACD trading signal that occurs when the MACD line crosses above or below the signal line. Crossovers can be used to identify potential trend reversals. This can be a bullish or bearish signal, depending on the direction of the crossover.
👉 General advice
Confirming Signals with other indicators:
As with all technical indicators, it is important to confirm potential signals with other analytical tools, such as support and resistance levels, as well as indicators like RSI, MACD, and volume. This helps increase the probability of a successful trade.
Use proper risk management:
When using this or any other indicator, it is crucial to have proper risk management in place. Consider implementing stop-loss levels and thoughtful position sizing.
Combining with other technical indicators:
The indicator can be effectively used alongside other technical indicators to create a comprehensive trading strategy and provide additional confirmation.
Keep in Mind:
Thorough research and backtesting are essential before making any trading decisions. Furthermore, it's crucial to have a solid understanding of the indicator and its behavior. Additionally, incorporating fundamental analysis and considering market sentiment can be vital factors to take into account in your trading approach.
Limitations:
This is a lagging indicator. Please note that the indicator is using moving averages, which are lagging indicators.
The indicators within the TradeMaster Lite package aim for simplicity and efficiency, while retaining their original purpose and value. Some settings, functions or visuals may be simpler than expected.
⭐ Conclusion
We hold the view that the true path to success is the synergy between the trader and the tool, contrary to the common belief that the tool itself is the sole determinant of profitability. The actual scenario is more nuanced than such an oversimplification. Our aim is to offer useful features that meet the needs of the 21st century and that we actually use.
🛑 Risk Notice:
Everything provided by trademasterindicator – from scripts, tools, and articles to educational materials – is intended solely for educational and informational purposes. Past performance does not assure future returns.
Advanced RSI with Volatility Bands [RedWhite]English - Introduction
This indicator uses a standard RSI of 14 periods, however, instead of using static lines of 70 and 30 to identify overbought and oversold zones, a moving average band is added, similar to the Bollinger Bands indicator.
Español - Introducción
Este indicador utiliza un RSI estándar de 14 períodos, sin embargo, en lugar de utilizar líneas estáticas de 70 y 30 para identificar las zonas de sobrecompra y sobreventa, se agrega una banda de medias móviles similar al indicador de las Bandas de Bollinger.
English - Calculation
The moving average band is constructed by calculating a moving average (default of 70 periods) on the standard RSI of 14 periods. From this average, volatility bands are applied, drawing an upper and lower band by using a standard deviation (default of 1).
Español - Cálculo
La banda de medias móviles se construye calculando una media móvil (por defecto de 70 períodos) sobre el RSI estándar de 14 períodos. A partir de esta media, se aplican bandas de volatilidad, dibujando así una banda superior e inferior mediante el uso de una desviación estándar (por defecto de 1).
English - Interpretation
When the RSI surpasses the upper band, the chart's background is shaded by default (green) to signal a possible overbought situation. On the other hand, when the RSI surpasses the lower band, the chart's background is shaded by default (red) to signal a possible oversold situation. The indicator can be customized in terms of period length, moving average values, and standard deviations. In addition, background colors can be adjusted according to the user's preferences.
Español - Interpretación
Cuando el RSI supera la banda superior, el fondo del gráfico se sombra de un color por defecto (verde) para señalar una posible situación de sobrecompra. Por otro lado, cuando el RSI supera la banda inferior, el fondo del gráfico se sombrea de un color por defecto (rojo) para señalar una posible situación de sobreventa. El indicador se puede personalizar en cuanto a la longitud de los períodos, los valores de la media móvil y las desviaciones estándar. Además, los colores del fondo se pueden ajustar según las preferencias del usuario.
English - Conclusion
By incorporating moving average bands, the indicator can provide more precise signals that are adjusted to changing market conditions. Additionally, the function of coloring the background can help traders visualize overbought and oversold zones clearly and make informed decisions accordingly. It is important to note that this indicator is not infallible and should be used in conjunction with other indicators and market analysis to make informed trading decisions.
Español - Conclusión
Al incorporar bandas de medias móviles, el indicador puede proporcionar señales más precisas ajustadas a las condiciones cambiantes del mercado. Además, la función de colorear el fondo puede ayudar a los traders a visualizar claramente las zonas de sobrecompra y sobreventa y tomar decisiones informadas en consecuencia. Es importante tener en cuenta que este indicador no es infalible y debe ser utilizado junto con otros indicadores y análisis del mercado para tomar decisiones de trading informadas.
English: For comparison purposes, the standard 14-period RSI is presented above, and below it, the standard 14-period RSI with volatility bands is shown.
Español: Con fines comparativos, se presenta el RSI estándar de 14 períodos arriba, y debajo se muestra el RSI estándar de 14 períodos con bandas de volatilidad.
English: RSI of 14 periods with a band of moving averages of 70 periods and a standard deviation with a value of 1
Español: RSI de 14 periodos con una banda de medias móviles de 70 periodos y una desviación estándar con un valor de 1
English: RSI of 14 periods with a band of moving averages of 70 periods and a standard deviation with a value of 0
Español: RSI de 14 periodos con una banda de medias móviles de 70 periodos y una desviación estándar con un valor de 0
English - Note
This indicator is inspired by Blai5's "Advanced RSI".
Español- Nota
Este indicador está inspirado en el "RSI Avanzado" de Blai5.
Faytterro Bandswhat is Faytterro Bands?
it is a channel indicator like "Bollinger Bands".
what it does?
creates a channel using standard deviations and means. thus giving users an idea about the expensive and cheap zones. It uses a special weighted moving average different from standard bollinger bands, it also averages not only price but also deviations.
how it does it?
it uses this formulas:
how to use it?
its usage is the same as "bollinger band".
length represents the number of candles to be taken into account, source represents the source of those candles and stdev represents the coefficient of the standard deviation.
you can use it with other indicators:
Average Trend with Deviation BandsTL,DR: A trend indicator with deviation bands using a modified Donchian calculation
This indicator plots a trend using the average of the lowest and highest closing price and the lowest low and highest high of a given period. This is similar to Donchian channels which use an average of the lowest and highest value (of a given period). This might sound like a small change but imho it provides a better "average" when lows/highs and lowest/highest closing prices are considered in the average calculation as well.
I also added the option to show 2 deviation bands (one is deactivated by default but can be activated in the options menu). The deviation band uses the standard deviation (of the average trend) and can be used to determine if a price movement is still in a "normal" range or not. Based on my testing it is fine to use one band with a standard deviation of 1 but it is also possible to show a second band with a different deviation value if needed. The bands (and trendline) can also be used as dynamic support/resistance zones.
Trendline without deviation bands
Correlated ATR Bands | AdulariHow do I use it?
Never use this indicator as standalone trading signal, it should be used as confluence.
It is highly recommended to use this indicator on the 15m timeframe and above, try experimenting with the inverse feature and multipliers as well.
When the price is above the moving average this shows the bullish trend is strong.
When the price is below the moving average this shows the bearish trend is strong.
When the moving average is purple, the trend is bullish , when it is gray, the trend is bearish.
When price is above the upper band this may indicate a bearish reversal.
When price is below the lower band this may indicate a bullish reversal.
Features:
Purple line for bullish trend and gray line for bearish trend.
Custom formula combining an ATR and Hull MA to clearly indicate trend strength and direction.
Unique approach to moving averages and bands by taking the average of 2 types of MA's combined with custom ATR's, then multiplying these by correlation factors.
Bands to indicate possible trend reversals when price crosses them.
How does it work?
1 — ATR value is calculated, then the correlation between the source and ATR is calculated.
2 — Final value is calculated using the following formula:
correlation * atr + (1 - correlation) * nz(atr , atr)
3 — Moving average is calculated with the following formula:
ta.hma((1-(correlation/100*(1+weight/10)))*(ta.sma(source+value, smoothing)+ta.sma(source-value,smoothing))/2,flength)
4 — Bands calculation using multipliers.
Hull Moving Average Bollinger Bands (HMABB)Hello! This is simply Bollinger Bands calculated with HMA! Heres a recap on both.
The Hull Moving Average (HMA) attempts to minimize the lag of a traditional moving average while retaining the smoothness of the moving average line. Developed by Alan Hull in 2005, this indicator makes use of weighted moving averages to prioritize more recent values and greatly reduce lag.
Bollinger Bands are envelopes plotted at a standard deviation level above and below a simple moving average of the price. Because the distance of the bands is based on standard deviation, they adjust to volatility swings in the underlying price. Bollinger Bands use 2 parameters, Period and Standard Deviations, StdDev.
Bollinger Bands Width and Bollinger Bands %BThis script shows both the Bollinger Band Width(BBW) and %B on the same indicator window.
Both the BBW and %B are introduced by John Bollinger(creator of Bollinger Bands) in 2010.
Default Parameter values: Length = 20, Source = Close, Mult = 2
Bollinger Bands Width (BBW): Color = (Default: Green )
- I consider stocks with "BBW >= 4" are at a volatile state and ready for price contraction, but this depends on the parameter values of your choice.
Bollinger Bands %B (%B): Color = (Default: Blue )
1. %B Above 10 = Price is Above the Upper Band
2. %B Equal to 10 = Price is at the Upper Band
3. %B Above 5 = Price is Above the Middle Line
4. %B Below 5 = Price is Below the Middle Line
5. %B Equal to 0 = Price is at the Lower Band
6. %B Below 0 = Price is Below the Lower Band
Impatient TS VWAP BandsImpatient VWAP bands are based of Traderskew's VWAP bands but are for more impatient traders.
Wicking or crossing down through the upper band indicates a good short trade entry for range-bound trading periods while wicking or crossing up through the lower band indicates a good long entry in range-bound conditions.
By default, impatience is disabled. If it is turned on, adjusting impatience determines how quickly the bands approach price: higher impatience approaches price faster. Rebound indicates how far from price the bands bounce after hitting price.
SMA VWAP BANDS [qrsq]Description
This indicator is used to find support and resistance utilizing both SMA and VWAP. It can be used on lower and higher time frames to understand where price is likely to reject or bounce.
How it works
Rather than using the usual calculation for the VWAP, instead this script smooths the volume first with the SMA and then respectively calculates the smoothed multiplication of high, low and close price with the volume individually. These values are then divided by the smoothed volume to find individual VWAP's for each of the sources. The standard deviations of these are calculated, resulting in an upper, lower and middle band. It is essentially VWAP bands with some smoothed calculations in the middle.
How to use it
I like to use the bands for LTF scalping as well as HTF swings.
For scalping:
I tend to use either the 5m or 15m TF
I then set the indicator's TF to 1m
I will take a scalp based on the bands confluence with other PA methods, if price is being either supported or rejected.
For swings:
I tend to use a variety of TFs, including: 30m, 1H, 4H, D
I then set the indicator's TF to "Chart"
I will take a swing based on the bands confluence with other PA methods, if price is being either supported or rejected.
I also tend to use them on perpetual contracts as the volume seems to be more consistent and hence results in more accurate support and resistance.
ATR BandsIn many strategies, it's quite common to use a scaled ATR to help define a stop-loss, and it's not uncommon to use it for take-profit targets as well. While it's possible to use the built-in ATR indicator and manually calculate the offset value, we felt this wasn't particularly intuitive or efficient, and could lead to the potential for miscalculations. And while there are quite a few indicators that plot ATR bands in some form or another already on TV, we could not find one that actually performed the exact way that we wanted. They all had at least one of the following gaps:
The ATR offset was not configurable (usually hard-coded to be based off the high or low, while we generally prefer to use close)
It would only print a single band (either the upper or lower), which would require the same indicator to be added twice
The ATR scaling factor was either not configurable or only stepped in whole numbers (often time fractional factors like 1.5 yield better results)
To that end, we took to making this enhanced version to meet all of the above requirements. While we were doing so, we decided to take this opportunity to also make some non-functional enhancements as well:
Updated the indicator to the most recent version of Pine
Updated the indicator definition to allow alternate (non-chart) timeframe usage
Made the input types explicitly defined to improve consistency
Updated the inputs with appropriate minimum values and step sizes where appropriate
Separated settings into logical groups
Added helptext to the indicator settings noting usage and common settings values
Explicitly titled the on-chart plots of the ATR bands so that they can more easily be identified and referenced in other indicators/scripts, as well as the Data Window
Food for thought : When looking at some of the behaviors of these ATR bands, you can see that when price first levels out, you can draw a "consolidation zone" from the first peak of the upper ATR band to the first valley of the lower ATR band that price will generally respect. Look for price to break and close outside of that zone. When that happens, price will usually (but not always) make a notable move in that direction, which can be used as either a potential trigger or as an additional confluence with other indicators/price action.
Finally, while we have made what we feel are some noteworthy updates and enhancements to this indicator, and have every intention of continuing to do so as we find worthy opportunities for enhancement, credit is still due to the original author: AlexanderTeaH
Daily Volume Ratio Bands (20MA)
Daily Volume Ratio Bands (20MA) — by CryptoDaily
This indicator normalizes daily trading volume against the recent 20-day moving average (20MA) and plots it as a volume ratio.
It allows traders to quickly identify whether current volume is strong, weak, or within a normal range compared to historical averages.
Key Features
Normalized volume ratio with 20-day average = baseline (1.0)
Clear bands for easy interpretation (1.0 ~ 1.3 = normal, above = overheated, below = weak)
Intuitive color coding:
🟨 Yellow: Normal range (1.0 ~ 1.3)
🔵 Blue: Above 1.3× average (high/strong volume, breakout confirmation)
⚪️ Gray: Below average (low volume)
🔴 Red: At or below 0.7× (extremely low volume / lack of interest)
How to Use
Breakouts with strong volume (Blue) → higher confidence in trend continuation
Gray/Red during consolidation → signal of weak momentum or sideways phase
Quickly assess whether the market is in overheated or low-activity conditions
Notes
Designed for Daily timeframe (1D) only. It will not function properly on intraday charts.
For educational purposes only. This is not financial advice.
Author
CryptoDaily (YouTube & TradingView)
YouTube channel: cryptodaily_tv
Volatility % Bands (O→C)Volatility % Bands (O→C) is an indicator designed to visualize the percentage change from Open to Close of each candle, providing a clear view of short-term momentum and volatility.
**Histogram**: Displays bar-by-bar % change (Close vs Open). Green bars indicate positive changes, while red bars indicate negative ones, making momentum shifts easy to identify.
**Moving Average Line**: Plots the Simple Moving Average (SMA) of the absolute % change, helping traders track the average volatility over a chosen period.
**Background Bands**: Based on the user-defined Level Step, ±1 to ±5 zones are highlighted as shaded bands, allowing quick recognition of whether volatility is low, moderate, or extreme.
**Label**: Shows the latest candle’s % change and the current SMA value as a floating label on the right, making it convenient for real-time monitoring.
This tool can be useful for volatility breakout strategies, day trading, and short-term momentum analysis.
Multi-Length Quad Bollinger BandsHere is a Pine Script code for TradingView that plots four separate Bollinger Bands on your chart. The lengths are preset to 14, 50, 100, and 200, but every aspect—including lengths, standard deviations, colors, and the source price—is fully customizable through the script's settings menu.
The 14 and 50-period bands are enabled by default, while the 100 and 200-period bands are disabled to keep the chart clean initially. You can easily toggle any of them on or off.
HILo Ema Double Squeeze BandsHILo Ema Double Squeeze Bands
This advanced technical indicator is a powerful variation of "HiLo Ema squeeze bands" that combines the best elements of Donchian channels and EMAs. It's specially designed to identify price squeezes before significant market moves while providing dynamic support/resistance levels and predictive price targets.
Indicator Concept:
The indicator initializes EMAs at each new high or low - the upper EMA tracks highs while the lower EMA tracks lows. The price range between upper and lower bands is divided into 4 equal zones by these lines:
Upper2 (uppermost line)
Upper1 (upper quartile)
Middle (center line)
Lower1 (lower quartile)
Lower2 (lowermost line)
This creates a more trend-responsive alternative to traditional Donchian channels with clearly defined zones for trade planning.
Key Features:
Dual EMA Band System: Utilizes both short-term and long-term EMAs to create adaptive price channels that respond to different market cycles
Quartile Divisions: Each band set includes middle lines and quartile divisions for more precise entry and exit points
Customizable Parameters: Easily adjust EMA periods and display options to suit your trading style and timeframe
Visual Color Zones: Clear color-coded zones help quickly identify bullish and bearish areas
Optional Extra Divisions: Add more granular internal lines (eighth divisions) for enhanced precision with longer EMA periods
Price Labels Option: Display exact price values for key levels directly on the chart
Price Target Prediction:
One of the most valuable features of this indicator is its ability to help predict potential reversal points:
When price breaks above the Upper2 level, look for potential reversals when the new Upper1 or Middle line aligns with previous Upper2 levels
When price breaks below the Lower2 level, look for potential reversals when the new Lower1 or Middle line aligns with previous Lower2 levels
Settings Guide:
Recommended Settings: 200 for Short EMA, 1000 for Long EMA works extremely well across most timeframes and symbols
Display options allow you to show/hide either band system based on your analysis preferences
The new option to divide the long EMA range into 8 parts instead of 4 is particularly useful when:
Long EMA period is >500
Short EMA is switched off and long EMA is used independently
Perfect for swing traders and position traders looking for a more sophisticated volatility-based overlay that adapts to changing market conditions and provides predictive reversal levels.
Note: This indicator works well across multiple timeframes but is especially effective on H4, Daily and Weekly charts for trend trading.
Dynamic Momentum Bands | AlphaAlgosDynamic Momentum Bands | AlphaAlgos
Overview
The Dynamic Momentum Bands indicator is an advanced technical analysis tool that combines multiple analytical techniques to provide a comprehensive view of market momentum and trend dynamics. By integrating RSI (Relative Strength Index), volatility analysis, and adaptive moving averages, this indicator offers traders a nuanced perspective on market conditions.
Key Features
Adaptive band calculation based on price momentum
Integrated RSI-driven volatility scaling
Multiple moving average type options (EMA, SMA, VWMA)
Smooth, gradient-based band visualization
Optional price bar coloring for trend identification
Technical Methodology
The indicator employs a sophisticated approach to market analysis:
1. Momentum Calculation
Calculates RSI using a customizable length
Uses RSI to dynamically adjust band volatility
Scales band width based on distance from the 50 RSI level
2. Band Construction
Applies a selected moving average type to the price source
Calculates deviation using ATR (Average True Range)
Smooths band edges for improved visual clarity
Configuration Options
Core Settings:
Price Source: Choose the price data used for calculations
RSI Length: Customize the RSI calculation period (1-50)
Band Length: Adjust the moving average period (5-100)
Volatility Multiplier: Fine-tune band width
Band Type: Select between EMA, SMA, and VWMA
Visual Settings:
Bar Coloring: Toggle color-coded price bars
Gradient-based band visualization
Smooth color transitions for trend representation
Trend Identification
The indicator provides trend insights through:
Color-coded bands (blue for bullish, pink for bearish)
Smooth gradient visualization
Optional price bar coloring
Trading Applications
Trend Following:
- Use band position relative to price as trend indicator
- Identify momentum shifts through color changes
- Utilize gradient zones for trend strength assessment
Volatility Analysis:
Observe band width changes
Detect potential breakout or consolidation periods
Use RSI-driven volatility scaling for market context
Best Practices
Adjust RSI length to match trading timeframe
Experiment with different moving average types
Use in conjunction with other technical indicators
Consider volatility multiplier for different market conditions
This indicator is provided for informational purposes only. Always use proper risk management when trading. Past performance is not indicative of future results. Not financial Advise