UCS_TTM - Reversion BandsOk, Here we go - Version 1 of TTM Reversion Band goes live.
Link to TTM Reversion Band - www.tradethemarkets.com
Link to TTM Reversion Band Guide - kb.simplertrading.com
John Carters Mastering the trade - www.amazon.com
For the amount of information this has, the price tag is not hefty.
John's RTM Chapter Synopsis - www.tradethemarkets.com
What did I modify?
1. Automated the Daily + and Intraday settings. So Switching to intraday will change the setting automatically.
2. Added text callouts for RTM condition
a. John Carter's Indicator
b. Slope Based (my addition).
Future Improvement Planned.
1. Will Convert this into a system based on John's Indicator from TS.
2. Custom Options for Slope and MA setting for Trade filter.
ค้นหาในสคริปต์สำหรับ "band"

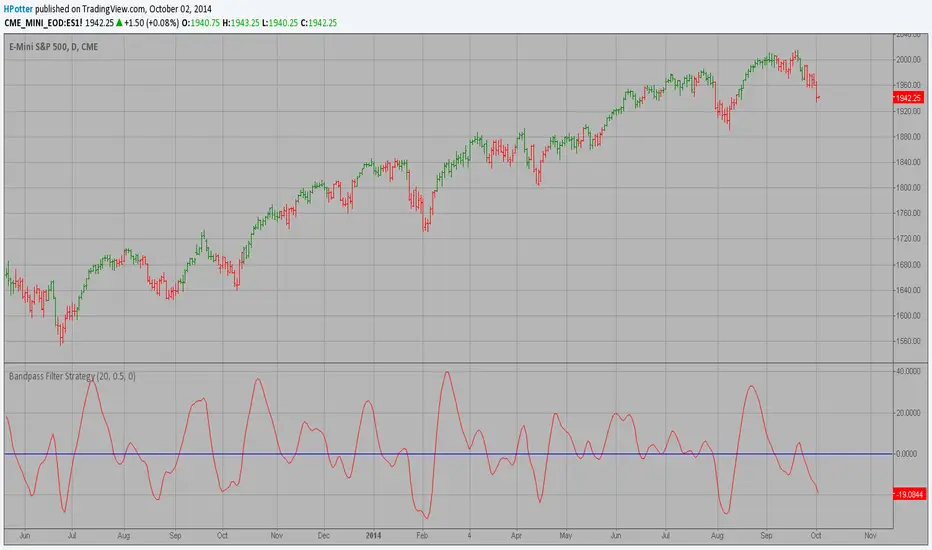
Bandpass Filter Strategy The related article is copyrighted material from
Stocks & Commodities Mar 2010
You can use in the xPrice any series: Open, High, Low, Close, HL2, HLC3, OHLC4 and ect...
Bandpass Filter The related article is copyrighted material from
Stocks & Commodities Mar 2010
You can use in the xPrice any series: Open, High, Low, Close, HL2, HLC3, OHLC4 and ect...

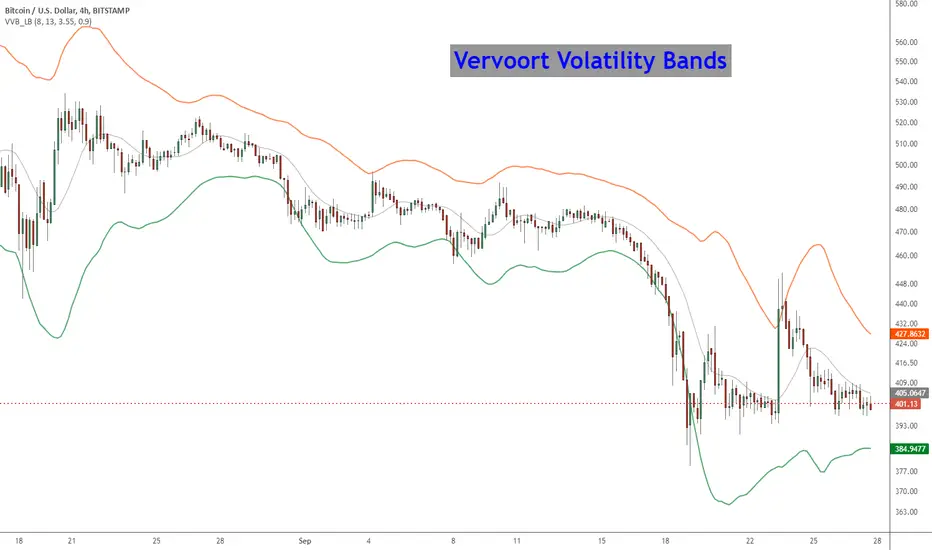
Vervoort Volatility Bands [LazyBear]This is Mr. Vervoort's take on volatility bands. Sticking to his style, he uses highly smoothed data everywhere, also improves on the way the bands are calculated. Is this better than others? I will let you guys decide :)
More info:
www.traders.com
List of my other indicators:
- Chart:
- GDoc: docs.google.com
RSI BandsPlots adaptive ATR bands around the 27-EMA to approximate RSI overbought and oversold zones directly on price. Provides a clean visual reference for RSI-like extremes without displaying the RSI itself.

Bollinger Band Touch with EMA Filter (Inverted, Alerts)Bollinger Band Touch with EMA Filter above or below the 100 nd 200 emas
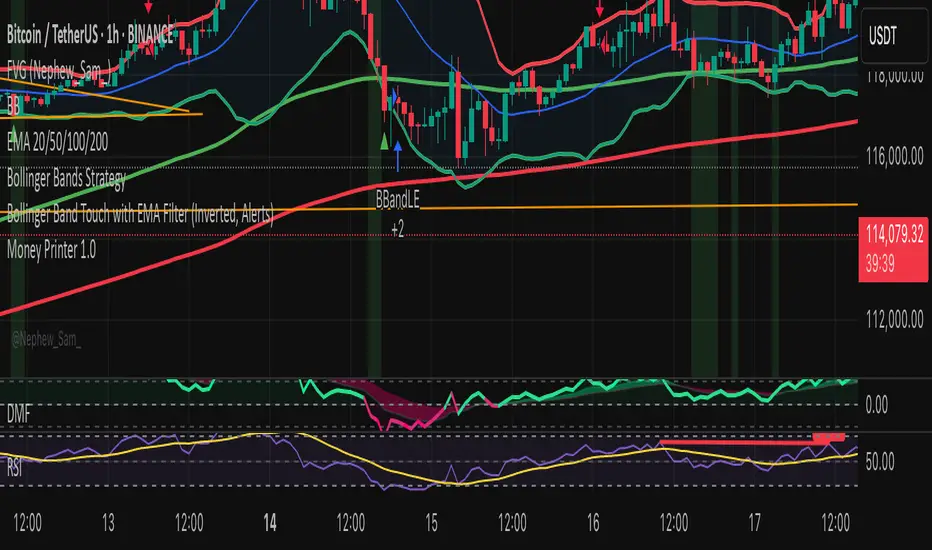
Bollinger Band Touch with EMA Filterbollomger band strategy above and below the 100 and above the 200

Bollinger Bands Volatility Arrows
Explanation of Changes:
Arrow Style:
Green Up Arrow (▲): Indicates increasing volatility with a positive value.
Red Down Arrow (▼): Indicates decreasing volatility with a negative value.
Labels with Arrows:
label.new is used to create arrows with the label.style_label_up or label.style_label_down styles.
The numerical value of the volatility is displayed beside the arrow using str.tostring.
Label Position:
For increasing volatility, the green arrow is placed near the high of the candle.
For decreasing volatility, the red arrow is placed near the low of the candle.
Text Format:
Includes the arrow symbol and the volatility value (formatted to 4 decimal places).
How It Works:
You’ll see green upward arrows for increasing volatility and red downward arrows for decreasing volatility.
Each arrow includes the exact value of the Bollinger Bands width at that moment.

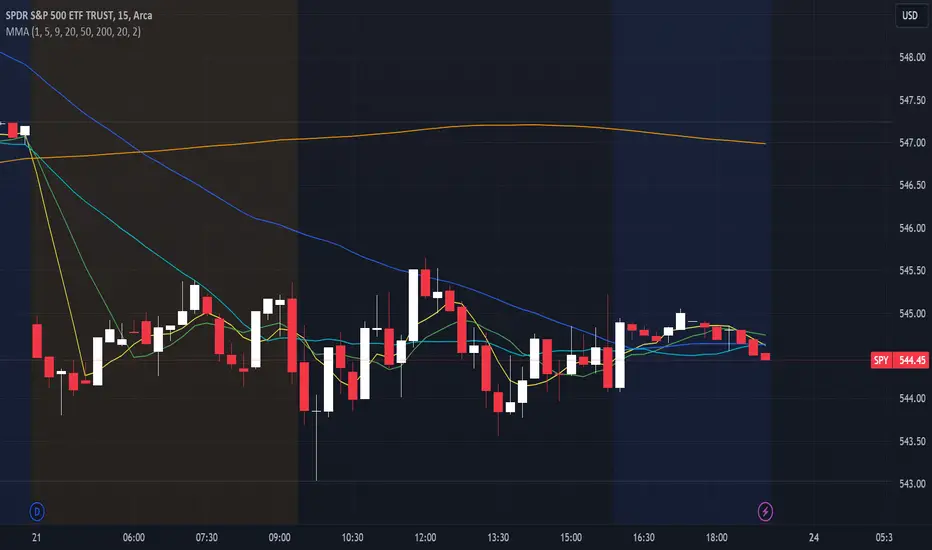
Multiple Moving Averages, Bollinger Bands, VWAP Options - Lett5 simple moving averages.
You decide:
1. The type of moving average
2. The length of the moving average
3. To show Bollinger Bands
4. To show VWAP.
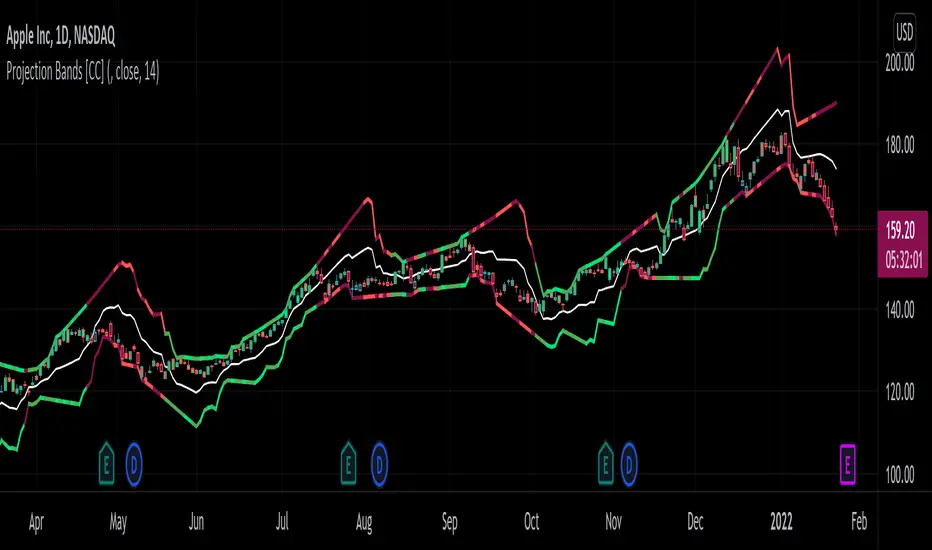
Projection Bands [CC]The Projection Bands were created by Mel Widner (Stocks and Commodities Jul 1995) and this indicator and the other two that rely on this one (I will publish them later) are very underappreciated in my humble opinion. The biggest strength of this indicator is the fact that it is a leading indicator for dramatic price movements. As you can see in my example chart it consistently gives great exit points before a downturn. I have included strong buy and sell signals in addition to normal ones so strong signals are darker in color and normal signals are lighter in color. Buy when the line turns green and sell when it turns red.
Let me know if there are any other indicators or scripts you would like to see me publish!
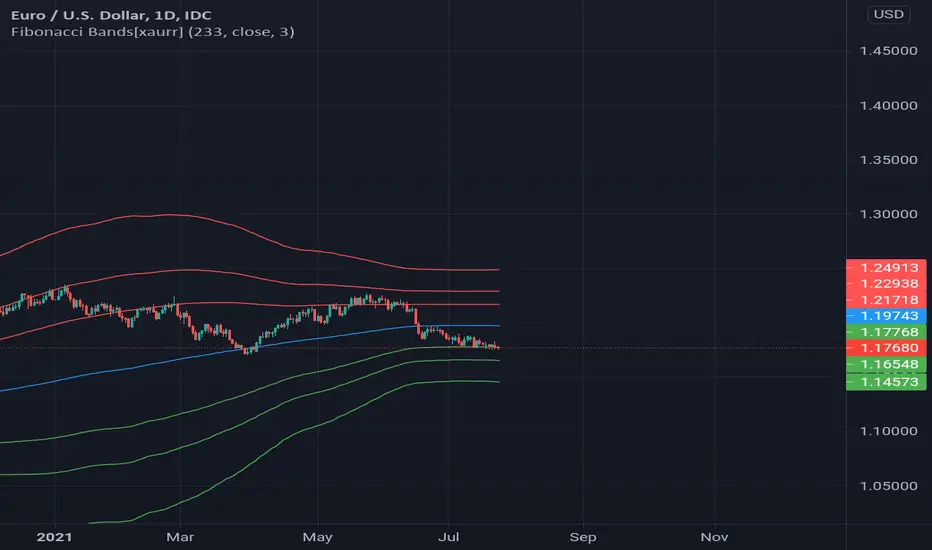
Fibonacci Bands[xaurr]This script draws Fibonacci bands according to std deviation using moving avarage with 233 periods, its the well know fibonacci number for following trend.
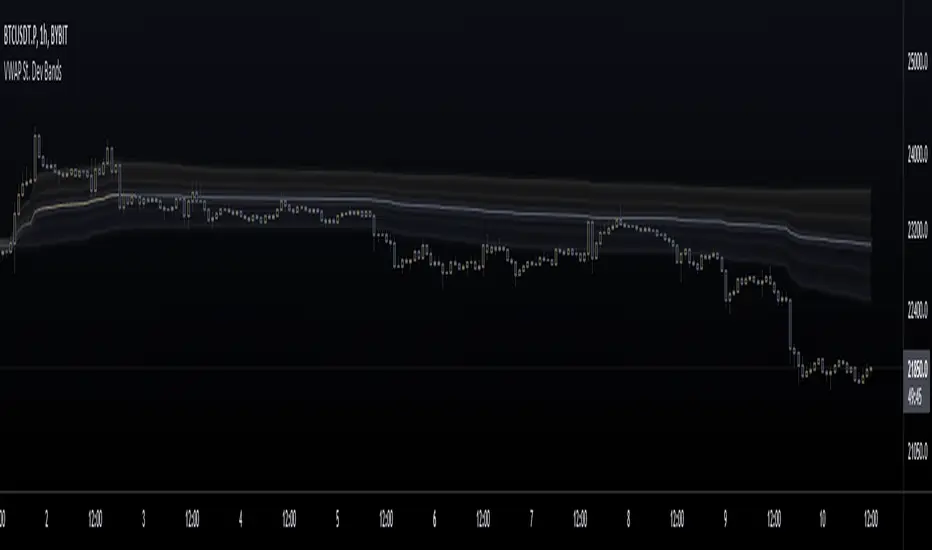
VWAP St. Dev BandsThis indicator allows you to add up to 3 volatility bands to VWAP based on its Standard Deviation.
Best use is for intraday but you can choose higher timeframes too.
For day trading a band of 3 standard deviations usually works well as an overbought/oversold region, allowing for mean reversion trading, but you are free to come up with your own strategies.
Enjoy!
Crypto EMA Bands - Support and ResistanceEMA Bands for crypto markets shows support and resistance lines. Helps identify bull and bear market trends. SMA200 is white and turns yellow to signal pressure. Can also be useful for identifying Elliot waves and breakouts.

Rate Of Change Bands [CC]The Rate Of Change Bands were created by Vitali Apirine (Stocks and Commodities March 2021 pg 14) and this indicator is a great method to not only check the momentum but also check the trend strength as well. I have color coded the lines so buy when the line turns green and sell when it turns red.
Let me know if there are any other indicators you want me to publish!

Moving Average BandsUse this script to find buy and sell zones for BTC based on momentum of the move relative to the average asset price over a given period. The script plots a series of offset bands above and below the Simple Moving Average. When price crosses another band further from the SMA, the background is rendered brighter. The brighter the background, the stronger the buy and sell signal is, as the expectation is that price wants to return to the SMA. Settings are adjustable to fine tune to various time frames and assets. Good settings for BTC Daily are length 30, layers at 10, 20, 30, and 40.
On 1H BTC/USD I use length 200, layers at 5, 10, 15, 20 to find decent swing trading opportunities.
On BTC/USD 1D chart, combine with Bitcoin Logarithmic Growth Curve from @mabonyi (original by @quantadelic )for confluence of very reliable signals.

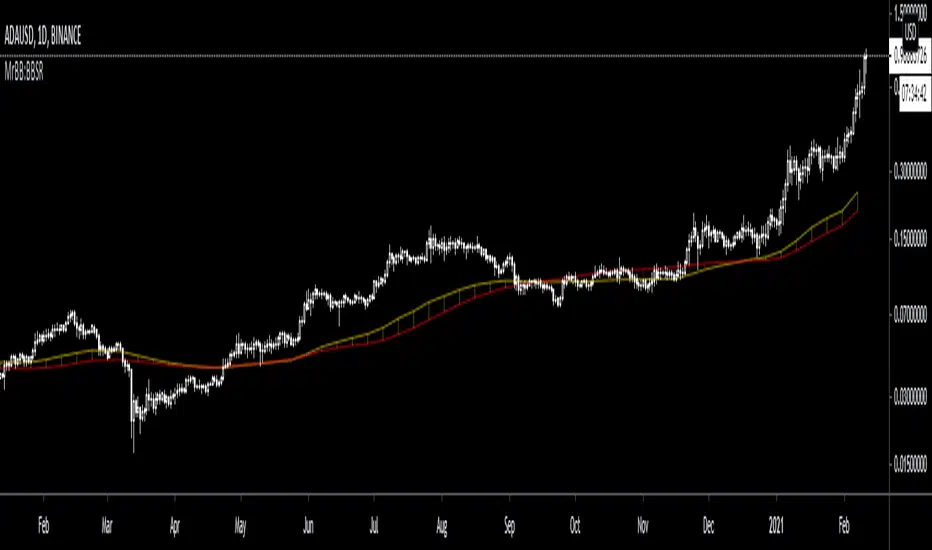
MrBB:BullBear Support BandVery simple and effective S/R band. Created bycombining the weekly 21EMA and weekly 20SMA, it provides strong support/resistance depending on market direction, and works as a basing area for retraces during parabolic (and normal) bull markets.
VAMA Volume Adjusted Moving Average BandsThis indicator is standard deviation bands using a live analysis adaptation of Richard Arms' Volume Adjusted Moving Average as their basis. VAMA utilizes a period length that is based on volume increments rather than time.
• SampleN - N volume bars used as sample to calculate average volume , 0 equals all bars.
• VAMA Source - Price used for volume weighted calculations.
• VAMA Length - Specified number of volume ratio buckets to be reached.
• VAMA VI Fct - Size of volume ratio buckets.
• VAMA Strict - Must meet desired volume requirements, even if number of bars has to exceed VAMA Length to do it.
• STDV Factor - Standard Deviation multiplier.
• STDV Length - Standard Deviation period.
• Brightness - Color opaqueness for the band fills.
Please see previous published example here for more details on VAMA's usage and inability to redraw the past on time based charts.
NOTICE: This is an example script and not meant to be used as an actual strategy. By using this script or any portion thereof, you acknowledge that you have read and understood that this is for research purposes only and I am not responsible for any financial losses you may incur by using this script!


Quantile BandsMiddle quantile/band color is set by confluence of the outer quantiles and not by it's own slope. Optional MTF.


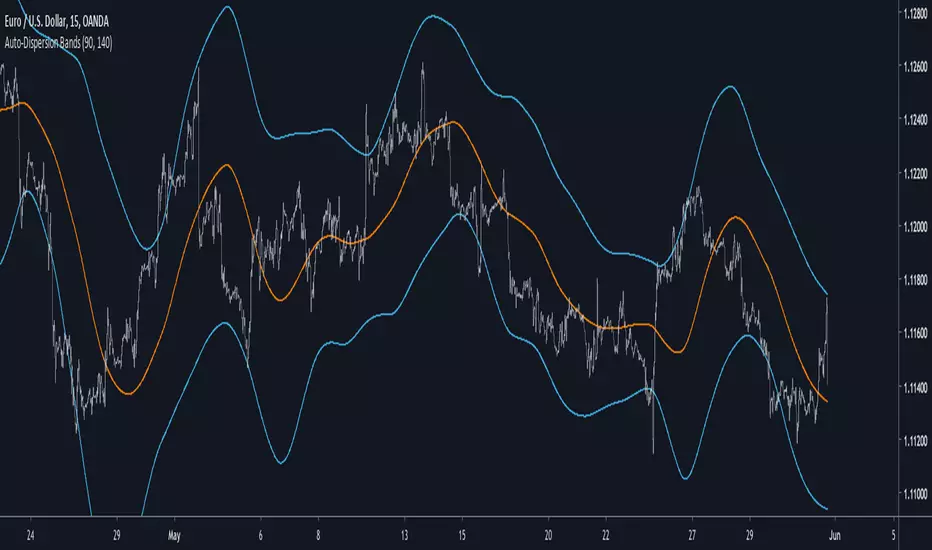
Auto-Dispersion BandsIntroduction
A really old indicator as well, thus i have no much ideas of what is going on with it, but i know that those bands returns good reversals points. The indicator don't use standard deviation, instead its a simple differencing of the price and the price length bars back who will provide a dispersion measurement, thus the name auto-dispersion.
The Indicator
The smooth parameter allow the band to cross the price, if smooth is low the chance of crosses are lower.
smooth = 3
Kirshenbaum BandsThis indicator was originally developed by Paul Kirshenbaum, a mathematician with a Ph.D. in economics from New York University.
It uses the standard error of linear regression lines of the closing price to determine band width. This has the effect of measuring volatility around the current trend, rather than measuring volatility for changes in trend.
Good luck!

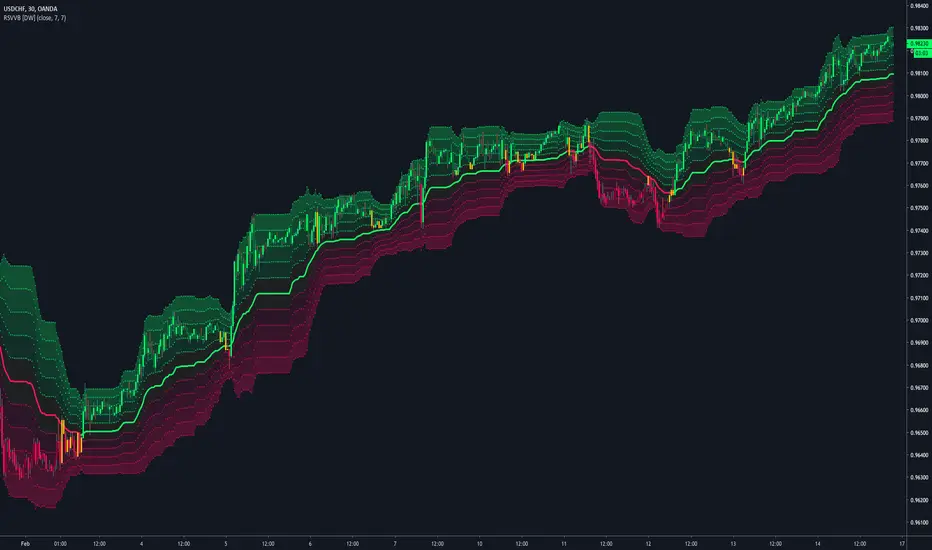
Relative Strength Volatility Variable Bands [DW]This is an experimental adaptive trend following study inspired by Giorgos Siligardos's Reverse Engineering RSI and Tushar S. Chande's Variable Moving Average.
In this study, reverse engineered RSI levels are calculated and used to generate a volatility index for VMA calculation.
First, price levels are calculated for when RSI will equal 70 and 30. The difference between the levels is taken and normalized to create the volatility index.
Next, an initial VMA is calculated using the created volatility index. The moving average is an exponential calculation that adjusts the sampling length as volatility changes.
Then, upper and lower VMAs are calculated by taking a VMA of prices above and below the initial VMA. The midline is produced by taking the median of the upper and lower VMAs.
Lastly, the band levels are calculated by multiplying the distance from the midline to the upper and lower VMAs by 1, 2, 3, 4, and 5.
Bar colors are included. They're based on the midline trend and price action relative to the upper and lower VMAs.