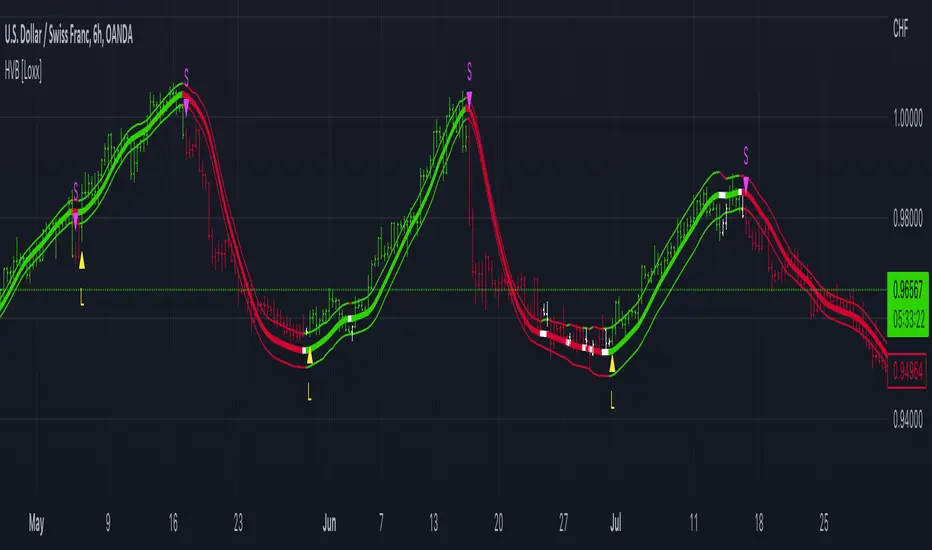
Kalman Supertrend (High vs Low) Bands Inspired by BackQuant, this script modifies the original Kalman Hull Supertrend by replacing the close price with High and Low sources. This creates clearer trend definition and better trend tracking.
This is one of the best trend indicators that can be used for trend trading or to capture reversals with high clarity.
Key Features:
Kalman High/Low Bands — Smooths market noise while separating bullish and bearish zones.
BB & SS Alerts — Triggered only when the entire candle closes outside both bands, helping filter out false breakouts.
Supertrend (optional) — Can be toggled on/off to monitor potential short-term or early trend shifts.
Customizable Display — Show/hide bands, fills, and live candle coloring for chart clarity.
Reversal Insight:
For 4H and Daily charts, reversal signals appear to be quite accurate when the price retests the trend bands before continuing the move.
How to Use:
BB appears when a candle fully closes above both High/Low Kalman bands — possible bullish breakout.
SS appears when a candle fully closes below both bands — possible bearish breakdown.
Supertrend toggle can confirm shorter-term moves or early reversals.
Credit to the original script BackQuant
ค้นหาในสคริปต์สำหรับ "band"

Fibonacci & Bollinger Bands StrategyTrading System: Fibonacci & Bollinger Bands Strategy
1. Session Timing
Trade only from 1 PM onwards.
Identify the first candle on the 1 PM vertical line to set the market direction.
If it's a bullish candle, look for buy opportunities.
If it's a bearish candle, look for sell opportunities.
2. Fibonacci Retracement as a Measuring Tool
Identify the recent swing high and swing low before the 1 PM session.
Draw Fibonacci retracement levels from low to high (for buys) or high to low (for sells).
Key retracement levels to watch: 0.0%, 50.0%, and 100.0%.
Entries can be placed at 0.0% or 50.0%, aiming for a move toward 100.0% retracement.
3. Bollinger Bands Confirmation
If the Bollinger Bands are above price, expect a downward move (sell).
If the Bollinger Bands are below price, expect an upward move (buy).
Use this as additional confirmation for your Fibonacci-based trade.
4. Entry & Exit Rules
Entry:
If the 1 PM candle confirms a bullish bias, enter long near Fibonacci 0.0% or 50.0%.
If the 1 PM candle confirms a bearish bias, enter short near Fibonacci 0.0% or 50.0%.
Stop Loss: Below (for buys) or above (for sells) the swing low/high used for Fibonacci.
Take Profit: Target 100.0% retracement level or next key resistance/support.
5. Risk Management
Risk 1-2% per trade.
Avoid trading if price is too far from Fibonacci levels.
Confirm setup with Bollinger Bands alignment.

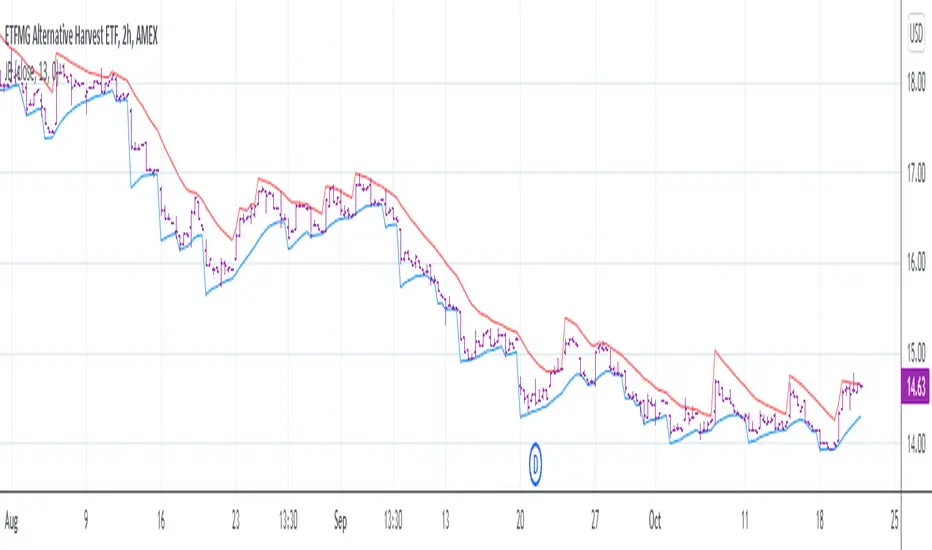
Reverse Double Smoothed Relative Strength Index Bands[CC]The Reverse Double Smoothed Relative Strength Index Bands is a custom script of mine that is another part of my RSI indicator series, which I will be publishing over the next week or so. This takes my Double Smoothed Relative Strength Index script and applies the Reverse RSI formula to create a new Bollinger Bands type indicator. This concept can work for almost any oscillator with some slight tweaking. I have a reverse RSI being calculated for each major RSI level to give you an approximation of what the price would look like if that RSI level was hit. Feel free to tweak the RSI levels of course. I will publish more Reverse indicators since that doesn't seem to be a topic that is touched on very frequently. I have color coded the indicator to show darker colors when it is a strong signal and lighter colors for normal signals. Buy when the lines turn green and sell when they turn red.
This was a custom request from @kerpiciwuasile so let me know if you want to see me publish another custom script!

Historical Volatility Bands [Loxx]Historical Volatility Bands are constructed using:
Average as the middle line.
Upper and lower bands using the Historical Volatility for bands calculation.
What is Historical Volatility?
Historical Volatility (HV) is a statistical measure of the dispersion of returns for a given security or market index over a given period of time. Generally, this measure is calculated by determining the average deviation from the average price of a financial instrument in the given time period. Using standard deviation is the most common, but not the only, way to calculate Historical Volatility.
The higher the Historical Volatility value, the riskier the security. However, that is not necessarily a bad result as risk works both ways - bullish and bearish, i.e: Historical Volatility is not a directional indicator and should not be used as other directional indicators are used. Use to to determine the rising and falling price change volatility.
The color of the middle line, unlike the bands colors, has 3 colors. When colors of the bands are the same, then the middle line has the same color, otherwise it's white.
Included
Alerts
Signals
Loxx's Expanded Source Types
Bar coloring
Jurik Bands//A follow up for my JMA script. This script is inspired by (and dedicated to) closure of sales (today, Oct 20 '21) of the famous Jurik Research.
...
Jurik Research, the real people who been doing real things by using the real instruments, while many others been reading books "How to become a billionaire in 2 days", watching 5687 hours videos of how to use RSI , and studying+applying machine learning to everything cuz suddenly it became trendy xD
...
In my JMA script I've said that JMA takes into account volatility. But how exactly? In fact, it's based on smth called Jurik Bands. Thing is they can be/should be used as an independent instrument. I won't lie, I've developed smth very similar myself for mean-reverting purposes, but we ain't gonna talk about this now (my stuff is much simpler, saying bye-bye to entropy).
...
The code is on purpose in Pine4, because lmao I'm not gonna call my stuff "Indicators", they don't "Indicate" anything. And it's on purpose doesn't follow any "coding conventions" made by geeks to make their stuff look more important. My conventions are simple: less code as possible and as simple as possible so we can actually do business based on these instruments.
...
Live Long And Prosper
Box-Cox Log BandsExperimental:
Uses the Box-Cox Transformer with a deflection on the inversion to create log bands.
to be used in log scaled charts.

Combo Backtest 123 Reversal & STARC BandsThis is combo strategies for get a cumulative signal.
First strategy
This System was created from the Book "How I Tripled My Money In The
Futures Market" by Ulf Jensen, Page 183. This is reverse type of strategies.
The strategy buys at market, if close price is higher than the previous close
during 2 days and the meaning of 9-days Stochastic Slow Oscillator is lower than 50.
The strategy sells at market, if close price is lower than the previous close price
during 2 days and the meaning of 9-days Stochastic Fast Oscillator is higher than 50.
Second strategy
A type of technical indicator that is created by plotting two bands around
a short-term simple moving average (SMA) of an underlying asset's price.
The upper band is created by adding a value of the average true range
(ATR) - a popular indicator used by technical traders - to the moving average.
The lower band is created by subtracting a value of the ATR from the SMA.
STARC is an acronym for Stoller Average Range Channels. The indicator is
named after its creator, Manning Stoller.
WARNING:
- For purpose educate only
- This script to change bars colors.

Dual Mean Reversion Channel (adjusted lower band)This is a public and open-source lighter version compared to the "Overextended Price Channel" which is provided complimentaty to the Trend Insight System.
Introduction :
Channels are very useful tools to assess overextended price, volatility and upcoming retracement or impulsive moves (such as Bollinger Band squeezes). It is an indispensable addition to any trader using Mean Reversion theory for a scalp-trade or swing-trade.
This script contains :
- 2 channels Keltner-style, using the True Range for volatility
- customizable volatility (channel width) and smoothing period
- a standard selection of moving average ; SMA, EMA, VWMA
- an embedded readjustment of the lower bands to avoid the drop on a logarithmic scale (see explanation below)
Why another channel indicator ?
I have found most conventional channels to be either not based on "proper" volatility (e.g. standard deviation of price action for Bollinger Band), or the bottom channel to be ill adapted to the logarithmic scale and plunges to 0 on some high volatility periods, messing with readability on logarithmic auto-scaled chart.
Also, I find the channels to be most useful when superimposed with another one of longer length; especially a pair of channels with a 50 and 200 period moving average respectively. Mean Reversion traders that mostly trade the 50 and 200 SMA/EMA know what I am talking about as having a channel helps to have a better visual for a proper of entry and exit point.
Disclaimer :
This indicator was originally intended to be used along with the Trend Insight System to improve performance, and the default configuration mostly backtested on BTCUSD.
Please use with caution, proper risk management and along with your favorite oscillator, candlestick reading and signals system.
Some explanation :
Based on Mean Reversion paradigm, everything has a tendency to revert back to the mean :
- when the price enters the upper channel, it is supposed to be (or start getting) overbought as the market is getting overheated, thus prone to correction,
- on the other hand, when the price enters the lower channel, it is supposed to be (or getting) oversold and the market looks favorable for a buy-in.
Depending on the trading style used, a trader will usually either wait until the price leaves the channel towards the mean before taking action (conservative style) or you will set limit orders inside the channel as you expect a reversion to the mean (more agressive/risky style).
With two channels, more complex (and maybe precise) rules can be built to optimize one's trading strategy.
Important notes :
In the end, sticking with 50/200 length and a single setting on volatility might be wiser, be wary of overoptimization which is risky at best and counter productive at worst (according to legendary traders such as Mark Douglas). Even if, needless to say, the volatility needs to be adjusted between a nascent and volatile market (such as crypto) compared to standard call markets that are much less volatile.
End notes :
It will always be considered a work in progress to help bring out the best of trading with channels, any comment and suggestion are welcomed.

2 Multi-Timeframe Bollinger BandsThis is two separate Bollinger bands in one study. Customizable middle BB line type ( SMA , EMA , VWMA ), legnth, colors, and deviations provided at .5 increments.
Someone else has a very similar Bollinger Band study but the code was hidden, so I figured I would remake as a learning challenge since I'm new to pinescript and this is the best way to learn it imo.
There will be updates to this script in the future but for now it serves its purpose lol. Publishing this version early as I wanted to give some friends access to it
In terms of usage, I like 4h 50 SMA alot . Having two sets of Bollinger bands is nice so you can turn one off or swap between time frames and such. In terms of techniques using both bbands, I haven't really played with it too much yet but simple things like 1h 50sma bbands expanding past the 4h 50sma bbands probably indicate an exaggerated move in that specific time frame, etc etc.
Hope this helps!

Combo Backtest 123 Reversal & Prime Number Bands This is combo strategies for get a cumulative signal.
First strategy
This System was created from the Book "How I Tripled My Money In The
Futures Market" by Ulf Jensen, Page 183. This is reverse type of strategies.
The strategy buys at market, if close price is higher than the previous close
during 2 days and the meaning of 9-days Stochastic Slow Oscillator is lower than 50.
The strategy sells at market, if close price is lower than the previous close price
during 2 days and the meaning of 9-days Stochastic Fast Oscillator is higher than 50.
Second strategy
Determining market trends has become a science even though a high number
or people still believe it’s a gambling game. Mathematicians, technicians,
brokers and investors have worked together in developing quite several
indicators to help them better understand and forecast market movements.
The Prime Number Bands indicator was developed by Modulus Financial Engineering
Inc. This indicator is charted by indentifying the highest and lowest prime number
in the neighborhood and plotting the two series as a band.
WARNING:
- For purpose educate only
- This script to change bars colors.

VIX Implied Move Bands for ES/Emini futuresThis script uses the close of the VIX on a daily resolution to provide the 'implied move' for the E-mini SP500 futures. While it can be applied to any equity index, it's crucial to know that the VIX is calculated using SPX options, and may not reflect the implied volatility of other indices. The user can adjust the length of the moving average used to calculate the bands, the window of days used to calculate the implied move, and the multiplier that effects the width of the bands.

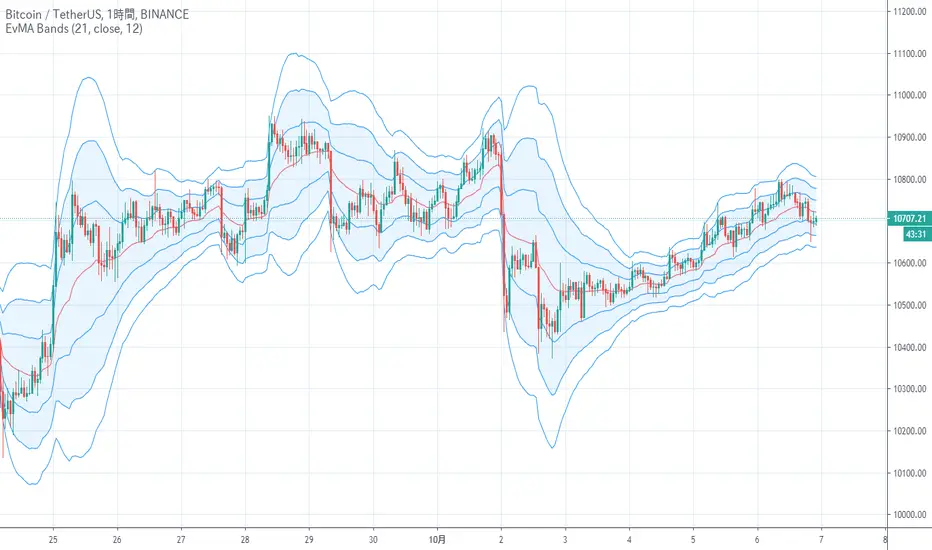
EvMA BandsIt is an index that looks like the final evolution by weighting the Bollinger band with exponential smoothing and volume.
The base Line is my EvMA as volume weighted EMA, so it is quite responsive.
The standard deviation is also exponentially smoothed, and the reaction is too good to handle, so it is further smoothed by EMA.
Charts without volume are not weighted with volume as 1.
It seems that the usage in trading is the same as the Bollinger band
ボリンジャーバンドを指数平滑出来高加重し、最終進化したような指標です
中央線は拙作のEvMAで出来高加重EMAなのでかなり反応が良いです
標準偏差も指数平滑出来高加重して反応が良すぎて扱いにくいのでさらにEMAで平滑化しています
出来高の無いチャートは出来高を1として加重しないようにしています
トレードでの使い方はボリンジャーバンドと同じで良いと思われます
Vortex BandsA slighty modified version of Better Bollinger Bands. The idea of the experiment was to do a thing like the well-known Vortex Indicator, but an overlay:
Obvious trading rules are:
go Long when the blue line is above other two
go Short when the orange line is above other two
stop when price crosses the basis line
The tool is EXPERIMENTAL . Good luck!
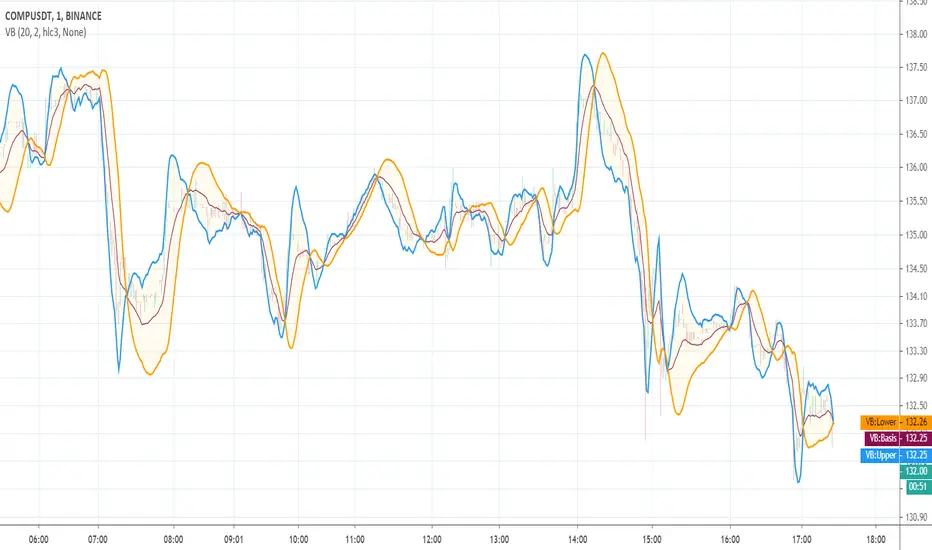
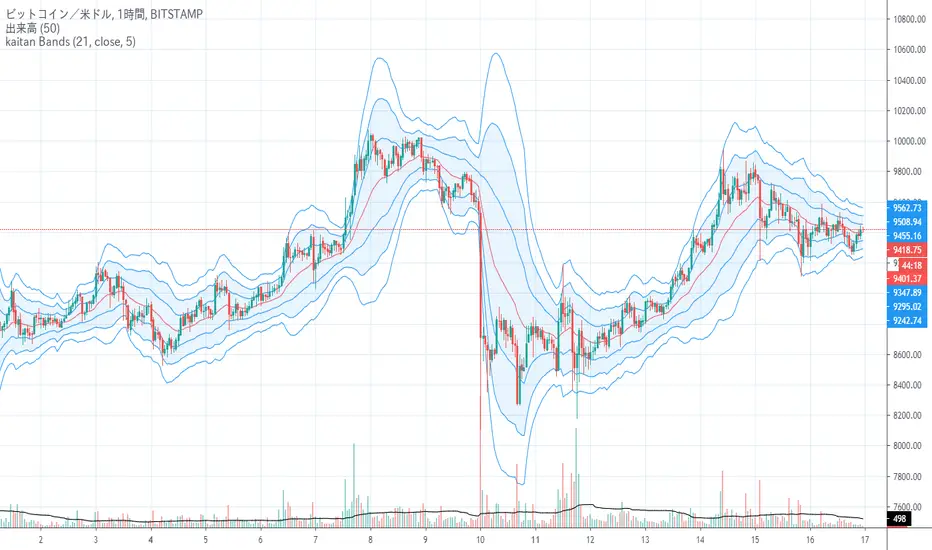
kaitan Bands
Reference: 200 section kaitan Bands
参考:200区間のkaitan Bands
Changing the Bollinger Band's midline from SMA to EMA is not so good in terms of the standard deviation calculation formula, and it was hard to say that EMABB is an index that can be used by the author in different calculation formulas.
This time, when I came up with the deviation, I came up with a method of weighting the latest deviation like EMA instead of the average and neglecting past deviations, so I made it.
The variation in the calculation result seems to be difficult to handle, so the finished product is the one with smoothed EMA deviation.
ボリンジャーバンドの中線をSMAからEMA変更にするのは標準偏差の計算式上いまいちで、EMABBは作者によって計算式もばらばらで使える指標とは言い難かった。
今回、偏差から求めるときに平均ではなくてEMAのように最新の偏差を重くし過去の偏差を軽視する方法を考え付きましたので、作ってみました。
単純に計算結果のばらつきが大きく扱いづらそうなので、EMA偏差をスムージングしたものを完成品としました。
R100 Volatility Combo Bands v1 (*v*)The Volatility Combo Bands are made from 4 separate volatility bands- two Bollinger Bands (10 and 20 period) and two Price Headley Acceleration Bands (10 and 20 period). The Volatility Combo Bands plot the innermost upper and lower points from these bands and then plots a mid-line. By default, only the standard 20 period Bollinger Bands and Combo Bands with mid-line are displayed, but can be configured however you want.
Try it out- see squeezes earlier, ride the bands earlier in trending markets, trade pullbacks to the Combo Bands and mid-line, trade the range of the band or use them to help identify potential support and resistance levels. Hopefully they can add another dimension to identifying volatility contraction patterns or whatever you currently use these things for!
I hope you get some value out of it. Only conditions of use are that if you improve it, let me know and if you publish something that uses it, don't hide the code! Enjoy!
Code for the Price Headley Acceleration Bands pinched and modified from LazyBear - thankyou.

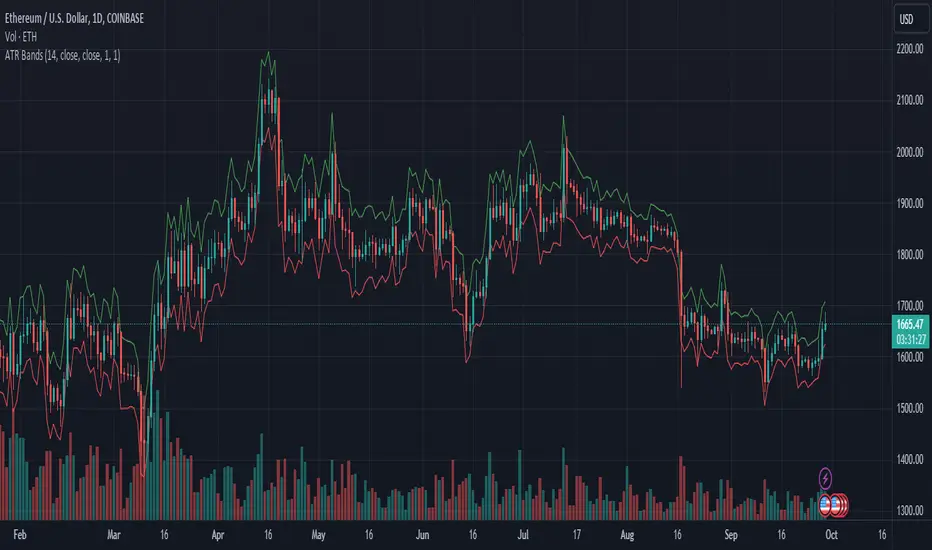
ATR BandsDisplays two bands above and below the source using the ATR. Comes with ATR multipliers for upper and lower bands.
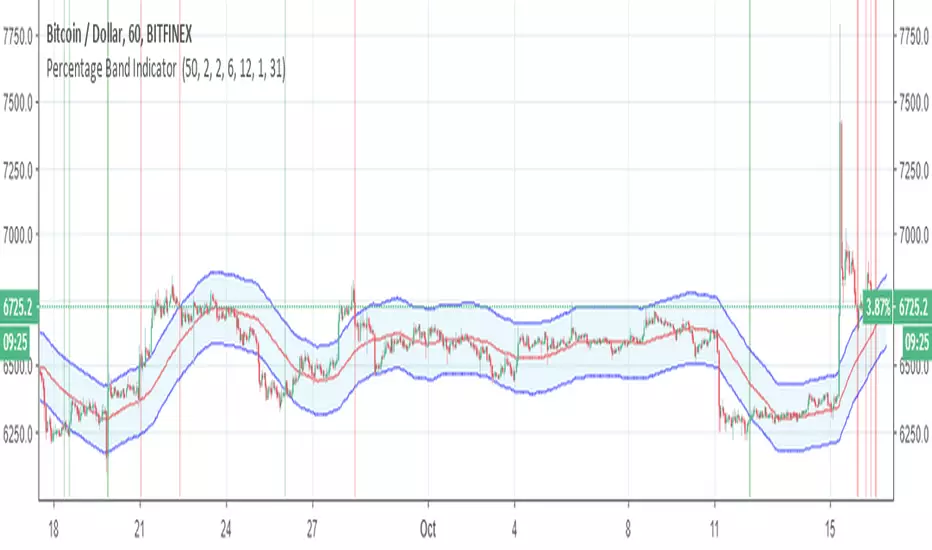
Percentage Band Indicator I added alerts in my Percentage Band strategy
You can see the strategy and backtest here
You can look at my other scripts.
www.tradingview.com
Prime Number Bands Strategy Determining market trends has become a science even though a high number
or people still believe it’s a gambling game. Mathematicians, technicians,
brokers and investors have worked together in developing quite several
indicators to help them better understand and forecast market movements.
The Prime Number Bands indicator was developed by Modulus Financial Engineering
Inc. This indicator is charted by indentifying the highest and lowest prime number
in the neighborhood and plotting the two series as a band.
WARNING:
- This script to change bars colors.

VWMA Keltner BandsKind of like Keltner Channel/Bands (stockcharts.com) but using VWMA instead so that volume is taken in to account.
Outside the upper band can considered to be 'overbought' and outside the lower band can be considered to be 'oversold'
Has option to highlight signals (i.e. when price closes outside a channel) and also the option to only display signals if the price is on the correct side of VWAP (i.e. no sell signals if price is above VWAP)
Fractal Regression Bands [DW]This study is an experimental regression curve built around fractal and ATR calculations.
First, Williams Fractals are calculated, and used as anchoring points.
Next, high anchor points are connected to negative sloping lines, and low anchor points to positive sloping lines. The slope is a specified percentage of the current ATR over the sampling period.
The median between the positive and negative sloping lines is then calculated, then the best fit line (linear regression) of the median is calculated to generate the basis line.
Lastly, a Golden Mean ATR is taken of price over the sampling period and multiplied by 1/2, 1, 2, and 3. The results are added and subtracted from the basis line to generate the bands.
Williams Fractals are included in the plots. The color scheme indicated whether each fractal is engulfing or non-engulfing.
Custom bar color scheme is included.

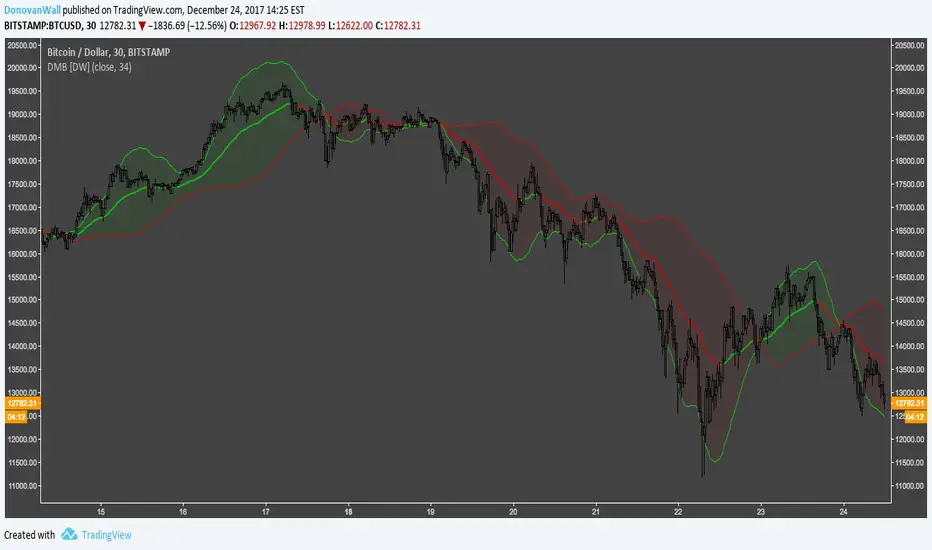
Directional Movement Bands [DW]This is a simple experimental study designed to outline trend activity and volatility.
In this study, the amount of change between current source and source of a specified lookback is calculated, then added to and subtracted from current source.
Next an exponential moving average is taken of the values for smoothing over the specified period.
Lastly, a midline is generated by taking the median of both bands.
ELASTIC WEIGHTED MOVING AVG with STDDEV BANDSImported from Stock & Commodities February 2017 month’s Traders’ Tips issue , from Vitali Apirine’s article in this issue, “Exponential Standard Deviation Bands.” Here, we present the February 2017 Traders’ Tips code with possible implementations in various software.

