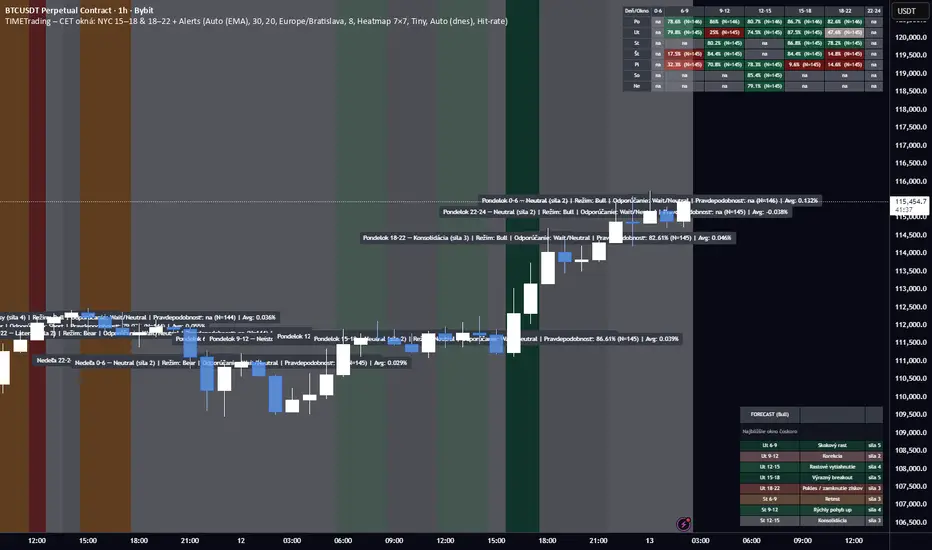
TIME-Trading Indicator + AlertsWhat it is
A Pine Script study that profiles intraday behavior by day+time windows in CET/CEST, verifies it on history, colors the chart by the expected bias & strength, shows tables/heatmaps with backtest stats, and can alert at the start of each window with a full trading summary.
Core ideas
Day is split into 7 CET windows: 0–6, 6–9, 9–12, 12–15, 15–18, 18–22, 22–24
(NYC is unified as 15–18 and 18–22 across the whole script.)
For each weekday & window we have an expectation (Bull/Bear/Neutral/Chop) with a strength 1–5 and a label (e.g., “Skokový rast”, “Výplach”…).
Script backtests those expectations on your chart’s history:
Computes return of each window (log-return from first bar open to last bar close of the window).
Counts Hit-rate (bull window = return>0; bear window = return<0; neutral/chop excluded).
Tracks Avg % drift, t-stat, and sample size N.
Trend regime (Auto/Manual)
Auto (EMA): price vs EMA(length) on a higher timeframe (configurable) + optional slope filter.
Manual override: Bull / Bear / Neutral.
Regime is read without look-ahead (uses previous bar’s regime when closing a window).
What you see
Background shading of the current window
– color family by category (green=bull, red=bear, gray=neutral, orange=chop), shade by strength 1–5.
Optional labels on window change with regime + label text (“Bull • Najsilnejší rast týždňa”).
Forecast panel (bottom-right) listing the next X windows with label & strength.
Results tables (three views):
Heatmap 7×7 (default): weekday × window grid, each cell shows one metric (toggle among Hit-rate / Avg % / t-stat).
Deň (stránkovanie): full stats for a single day (N, Hit-rate, Avg %, t, label).
Split 2× (dlhá): two stacked tables (Mon–Thu, Fri–Sun) to fit small screens.
Alerts (window start)
Optionally fire at the start of every window.
Message includes: weekday + window, expectation label, strength, current regime, recommended action (Long/Short/Wait), Hit-rate %, Avg %, and N.
Create alerts in TV with Condition → Any alert() function call (so the script’s dynamic text is used).
Optional filters (easy to add/adjust): min N, min Hit-rate, only Bull/Bear windows.
Inputs you control
Regime mode, EMA length, higher-TF for trend check, require EMA slope.
CET/CEST timezone (uses “Europe/Bratislava” by default).
Toggles: background, labels, forecast, results view, table text size, heatmap metric.
Alert enable; (we can add min-N / min-HR filters if you want them by default).
How stats are computed (important)
A window’s return is measured strictly inside the window (open of first bar → close of last bar).
The window is credited to the correct weekday even across midnight.
Hit-rate uses only directional windows (Bull/Bear). Neutral/Chop are excluded.
Best practices
Use chart TF that divides an hour (5/15/30/60m) so window boundaries align cleanly.
Read the heatmap primarily by Hit-rate (signal reliability) and cross-check with Avg % (effect size) and t-stat (significance).
Trade at the start of a strong window in the direction of the current regime, exit time-based (end of window) or on PT/SL.
If you want, I can also:
mask/show only cells with N ≥ threshold,
add NYC sub-split toggle off/on,
export stats to CSV,
or add webhooks-friendly compact alert strings.
ค้นหาในสคริปต์สำหรับ "backtest"
Best MA Finder: Sharpe/Sortino ScannerThis script, Best MA Finder: Sharpe/Sortino Scanner, is a tool designed to identify the moving average (SMA or EMA) that best acts as a dynamic trend threshold on a chart, based on risk-adjusted historical performance. It scans a wide range of MA lengths (SMA or EMA) and selects the one whose simple price vs MA crossover delivered the strongest results using either the Sharpe ratio or the Sortino ratio. Reading it is intuitive: when price spent time above the selected MA, conditions were on average more favorable in the backtest; below, less favorable. It is a trend and risk gauge, not an overbought or oversold signal.
What it does:
- Runs individual long-only crossover backtests for many MA lengths across short to very long horizons.
- For each length, measures the total number of trades, the annualized Sharpe ratio, and the annualized Sortino ratio.
- Uses the chosen metric value (Sharpe or Sortino) as the score to rank candidates.
- Applies a minimum trade filter to discard statistically weak results.
- Optionally applies a local stability filter to prefer a length that also outperforms its close neighbors by at least a small margin.
- Selects the optimal MA and displays it on the chart with a concise summary table.
How to use it:
- Choose MA type: SMA or EMA.
- Choose the metric: Sharpe or Sortino.
- Set the minimum trade count to filter out weak samples.
- Select the risk-free mode:
Auto: uses a short-term risk-free rate for USD-priced symbols when available.
Manual: you provide a risk-free ticker.
None: no risk-free rate.
- Optionally enable stability controls: neighbor radius and epsilon.
- Toggle the on-chart summary table as needed.
On-chart output:
- The selected optimal MA is plotted.
- The optional table shows MA length, number of trades, chosen metric value annualized, and the annual risk-free rate used.
Key features:
- Risk-adjusted optimization via Sharpe or Sortino for fair, comparable assessment.
- Broad MA scan with SMA and EMA support.
- Optional stability filter to avoid one-off spikes.
- Clear and auditable presentation directly on the chart.
Use cases:
- Traders who want a defensible, data-driven trend threshold without manual trial and error.
- Swing and trend-following workflows across timeframes and asset classes.
- Quick SMA vs EMA comparisons using risk-adjusted results.
Limitations:
- Not a full trading strategy with position sizing, costs, funding, slippage, or stops.
- Long-only, one position at a time.
- Discrete set of MA lengths, not a continuous optimizer.
- Requires sufficient price history and, if used, a reliable risk-free series.
This script is open-source and built from original logic. It does not replicate closed-source scripts or reuse significant external components.

BOCS AdaptiveBOCS Adaptive Strategy - Automated Volatility Breakout System
WHAT THIS STRATEGY DOES:
This is an automated trading strategy that detects consolidation patterns through volatility analysis and executes trades when price breaks out of these channels. Take-profit and stop-loss levels are calculated dynamically using Average True Range (ATR) to adapt to current market volatility. The strategy closes positions partially at the first profit target and exits the remainder at the second target or stop loss.
TECHNICAL METHODOLOGY:
Price Normalization Process:
The strategy begins by normalizing price to create a consistent measurement scale. It calculates the highest high and lowest low over a user-defined lookback period (default 100 bars). The current close price is then normalized using the formula: (close - lowest_low) / (highest_high - lowest_low). This produces values between 0 and 1, allowing volatility analysis to work consistently across different instruments and price levels.
Volatility Detection:
A 14-period standard deviation is applied to the normalized price series. Standard deviation measures how much prices deviate from their average - higher values indicate volatility expansion, lower values indicate consolidation. The strategy uses ta.highestbars() and ta.lowestbars() functions to track when volatility reaches peaks and troughs over the detection length period (default 14 bars).
Channel Formation Logic:
When volatility crosses from a high level to a low level, this signals the beginning of a consolidation phase. The strategy records this moment using ta.crossover(upper, lower) and begins tracking the highest and lowest prices during the consolidation. These become the channel boundaries. The duration between the crossover and current bar must exceed 10 bars minimum to avoid false channels from brief volatility spikes. Channels are drawn using box objects with the recorded high/low boundaries.
Breakout Signal Generation:
Two detection modes are available:
Strong Closes Mode (default): Breakout occurs when the candle body midpoint math.avg(close, open) exceeds the channel boundary. This filters out wick-only breaks.
Any Touch Mode: Breakout occurs when the close price exceeds the boundary.
When price closes above the upper channel boundary, a bullish breakout signal generates. When price closes below the lower boundary, a bearish breakout signal generates. The channel is then removed from the chart.
ATR-Based Risk Management:
The strategy uses request.security() to fetch ATR values from a specified timeframe, which can differ from the chart timeframe. For example, on a 5-minute chart, you can use 1-minute ATR for more responsive calculations. The ATR is calculated using ta.atr(length) with a user-defined period (default 14).
Exit levels are calculated at the moment of breakout:
Long Entry Price = Upper channel boundary
Long TP1 = Entry + (ATR × TP1 Multiplier)
Long TP2 = Entry + (ATR × TP2 Multiplier)
Long SL = Entry - (ATR × SL Multiplier)
For short trades, the calculation inverts:
Short Entry Price = Lower channel boundary
Short TP1 = Entry - (ATR × TP1 Multiplier)
Short TP2 = Entry - (ATR × TP2 Multiplier)
Short SL = Entry + (ATR × SL Multiplier)
Trade Execution Logic:
When a breakout occurs, the strategy checks if trading hours filter is satisfied (if enabled) and if position size equals zero (no existing position). If volume confirmation is enabled, it also verifies that current volume exceeds 1.2 times the 20-period simple moving average.
If all conditions are met:
strategy.entry() opens a position using the user-defined number of contracts
strategy.exit() immediately places a stop loss order
The code monitors price against TP1 and TP2 levels on each bar
When price reaches TP1, strategy.close() closes the specified number of contracts (e.g., if you enter with 3 contracts and set TP1 close to 1, it closes 1 contract). When price reaches TP2, it closes all remaining contracts. If stop loss is hit first, the entire position exits via the strategy.exit() order.
Volume Analysis System:
The strategy uses ta.requestUpAndDownVolume(timeframe) to fetch up volume, down volume, and volume delta from a specified timeframe. Three display modes are available:
Volume Mode: Shows total volume as bars scaled relative to the 20-period average
Comparison Mode: Shows up volume and down volume as separate bars above/below the channel midline
Delta Mode: Shows net volume delta (up volume - down volume) as bars, positive values above midline, negative below
The volume confirmation logic compares breakout bar volume to the 20-period SMA. If volume ÷ average > 1.2, the breakout is classified as "confirmed." When volume confirmation is enabled in settings, only confirmed breakouts generate trades.
INPUT PARAMETERS:
Strategy Settings:
Number of Contracts: Fixed quantity to trade per signal (1-1000)
Require Volume Confirmation: Toggle to only trade signals with volume >120% of average
TP1 Close Contracts: Exact number of contracts to close at first target (1-1000)
Use Trading Hours Filter: Toggle to restrict trading to specified session
Trading Hours: Session input in HHMM-HHMM format (e.g., "0930-1600")
Main Settings:
Normalization Length: Lookback bars for high/low calculation (1-500, default 100)
Box Detection Length: Period for volatility peak/trough detection (1-100, default 14)
Strong Closes Only: Toggle between body midpoint vs close price for breakout detection
Nested Channels: Allow multiple overlapping channels vs single channel at a time
ATR TP/SL Settings:
ATR Timeframe: Source timeframe for ATR calculation (1, 5, 15, 60, etc.)
ATR Length: Smoothing period for ATR (1-100, default 14)
Take Profit 1 Multiplier: Distance from entry as multiple of ATR (0.1-10.0, default 2.0)
Take Profit 2 Multiplier: Distance from entry as multiple of ATR (0.1-10.0, default 3.0)
Stop Loss Multiplier: Distance from entry as multiple of ATR (0.1-10.0, default 1.0)
Enable Take Profit 2: Toggle second profit target on/off
VISUAL INDICATORS:
Channel boxes with semi-transparent fill showing consolidation zones
Green/red colored zones at channel boundaries indicating breakout areas
Volume bars displayed within channels using selected mode
TP/SL lines with labels showing both price level and distance in points
Entry signals marked with up/down triangles at breakout price
Strategy status table showing position, contracts, P&L, ATR values, and volume confirmation status
HOW TO USE:
For 2-Minute Scalping:
Set ATR Timeframe to "1" (1-minute), ATR Length to 12, TP1 Multiplier to 2.0, TP2 Multiplier to 3.0, SL Multiplier to 1.5. Enable volume confirmation and strong closes only. Use trading hours filter to avoid low-volume periods.
For 5-15 Minute Day Trading:
Set ATR Timeframe to match chart or use 5-minute, ATR Length to 14, TP1 Multiplier to 2.0, TP2 Multiplier to 3.5, SL Multiplier to 1.2. Volume confirmation recommended but optional.
For Hourly+ Swing Trading:
Set ATR Timeframe to 15-30 minute, ATR Length to 14-21, TP1 Multiplier to 2.5, TP2 Multiplier to 4.0, SL Multiplier to 1.5. Volume confirmation optional, nested channels can be enabled for multiple setups.
BACKTEST CONSIDERATIONS:
Strategy performs best during trending or volatility expansion phases
Consolidation-heavy or choppy markets produce more false signals
Shorter timeframes require wider stop loss multipliers due to noise
Commission and slippage significantly impact performance on sub-5-minute charts
Volume confirmation generally improves win rate but reduces trade frequency
ATR multipliers should be optimized for specific instrument characteristics
COMPATIBLE MARKETS:
Works on any instrument with price and volume data including forex pairs, stock indices, individual stocks, cryptocurrency, commodities, and futures contracts. Requires TradingView data feed that includes volume for volume confirmation features to function.
KNOWN LIMITATIONS:
Stop losses execute via strategy.exit() and may not fill at exact levels during gaps or extreme volatility
request.security() on lower timeframes requires higher-tier TradingView subscription
False breakouts inherent to breakout strategies cannot be completely eliminated
Performance varies significantly based on market regime (trending vs ranging)
Partial closing logic requires sufficient position size relative to TP1 close contracts setting
RISK DISCLOSURE:
Trading involves substantial risk of loss. Past performance of this or any strategy does not guarantee future results. This strategy is provided for educational purposes and automated backtesting. Thoroughly test on historical data and paper trade before risking real capital. Market conditions change and strategies that worked historically may fail in the future. Use appropriate position sizing and never risk more than you can afford to lose. Consider consulting a licensed financial advisor before making trading decisions.
ACKNOWLEDGMENT & CREDITS:
This strategy is built upon the channel detection methodology created by AlgoAlpha in the "Smart Money Breakout Channels" indicator. Full credit and appreciation to AlgoAlpha for pioneering the normalized volatility approach to identifying consolidation patterns and sharing this innovative technique with the TradingView community. The enhancements added to the original concept include automated trade execution, multi-timeframe ATR-based risk management, partial position closing by contract count, volume confirmation filtering, and real-time position monitoring.

Marubozu Detector with Dynamic SL/TP
Strategy Overview:
This indicator detects a "Marubozu" bullish pattern or a “Marubozu” bearish pattern to suggest potential buy and sell opportunities. It uses dynamic Stop Loss (SL) and Take Profit (TP) management, based on either market volatility (ATR) or liquidity zones.
This tool is intended for educational and informational purposes only.
Key Features:
Entry: Based on detecting Marubozu bullish or bearish candle pattern.
Exit: Targets are managed through ATR multiples or previous liquidity levels (swing highs or swing lows).
Smart Liquidity: Optionally identify deeper liquidity targets.
Full Alerts: Buy and Sell signals supported with customizable alerts.
Visualized Trades: Entry, SL, and TP levels are plotted on the chart.
User Inputs:
ATR Length, ATR Multipliers
Take Profit Mode (Liquidity/ATR)
Swing Lookback and Strength
Toggleable Buy/Sell alerts
All Time Frames
📖 How to Use:
Add the Indicator:
Apply the script to your chart from the TradingView indicators panel.
Look for Buy Signals:
A buy signal is triggered when the script detects a "Marubozu" bullish pattern.
Entry, Stop Loss, and Take Profit levels are plotted automatically.
Look for Sell Signals:
A Sell signal is triggered when the script detects a "Marubozu" bearish pattern.
Entry, Stop Loss, and Take Profit levels are plotted automatically.
Choose Take Profit Mode:
ATR Mode: TP is based on a volatility target.
Liquidity Mode: TP is based on past swing highs.
Set Alerts (Optional):
Enable Buy/Sell alerts in the settings to receive real-time notifications.
Practice First:
Always backtest and paper trade before live use.
📜 Disclaimer:
This script does not offer financial advice.
No guarantees of profit or performance are made.
Use in demo accounts or backtesting first.
Always practice proper risk management and seek advice from licensed professionals if needed.
✅ Script Compliance:
This script is designed in full accordance with TradingView’s House Rules for educational tools.
No financial advice is provided, no performance is guaranteed, and users are encouraged to backtest thoroughly.

Cnagda Liquidit Trading SystemCnagda Liquidit Trading System helps spot where price is likely to trap traders and reverse, then gives simple, actionable Level to entry, place SL, and take profits with confidence. It blends imbalance zones, trend bias, order blocks, liquidity pools, high-probability fake Signal, and context-aware candle patterns into one clean workflow.
🟩🟥 Imbalance boxes: “Crowd rushed, gaps left”
What it is: Green/red boxes mark fast, one-sided moves where price “skipped” orders—think FVG-like zones that often get revisited.
Why it helps: Price frequently pulls back to “fill” these zones, creating clean retest entries with logical stops.
⏩How to use:
Green box = potential demand retest; Red box = potential supply retest. Enter on pullback into box, not on first impulse. Put stop on far side of box and aim first targets at recent swing points.
↕️ Swing bias (HH/HL vs LH/LL): “Which way is the road?”
What it is: Higher-highs/higher-lows = up-bias; Lower-highs/lower-lows = down-bias. system plots Buy/Sell OB levels aligned with that bias.
Why it helps: Trading with the broader flow reduces “hero trades” against institutions. Bias gives clearer entries and cleaner drawdowns.
⏩How to use:
Up-bias: look for long on Buy OB retests. Down-bias: look for short on Sell OB retests. Wait for a small rejection/engulfing to confirm before triggering.
🧱Order blocks: “Where big players remember”
What it is: last opposite-colored candle before an impulsive move—these zones often hold memory and reaction. system plots these as Buy/Sell OB lines.
Why it helps: Many breakouts pull back to the origin. Good entries often happen on retest, not on the breakout chase.
⏩ How to use:
Let price return into the OB, show wick rejection, and decent volume. Enter with stop beyond OB; define risk-reward before entry.
📊Volume coloring: “How Volume is move?”
What it is: Bar color reflects relative volume; inside bars are black. The dashboard also shows Volume and “Volume vs Prev.”
Why it helps: Patterns without volume often fade; volume validates strength and intent of moves.
⏩ How to use:
Favor entries where imbalance/OB/liquidity-grab coincide with higher volume. If volume is weak, reduce size or skip.
🧲 BSL/SSL liquidity pools: “Fishing for stops”
What it is: Equal highs cluster stops above (BSL); equal lows cluster stops below (SSL). system plots these and highlights the nearest one (“magnet”).
Why it helps: Price often sweeps these pools to trigger stops before reversing. This is a prime trap-reversal location.
⏩ How to use:
Watch nearest BSL/SSL. If price wicks through and closes back inside, anticipate a reversal. Trade reaction, not first poke. When price closes beyond, consider that pool mitigated and move on.
🟢🔴 Advanced liquidity grab: “Catch fakeout”
What it is: Bullish grab = makes a new low beyond a prior low but closes back above it, with a long lower wick, small body, and higher volume. Bearish is mirror. Labeled automatically.
Why it helps: It exposes trap moves (stop hunts) and often precedes true direction.
⏩ How to use:
Best when it aligns with a nearby imbalance/OB and supportive volume. Enter on reversal candle break or on retest. Stop goes beyond sweep wick.
🧠 Smart candlestick patterns (only in right place)
What it is: Engulfing, Hammer, Shooting Star, Hanging Man, Doji (with high volume), Morning/Evening Star, Piercing—but marked “effective” only if context (swing/trend/location) agrees.
Why it helps: same pattern in the wrong place is noise; in the right place, it’s signal.
⏩ How to use:
Location first (BSL/SSL/OB/imbalance), then pattern. Treat pattern as trigger/confirmation—one fresh label shows to keep chart clean.
🧭 Dashboard: “Context in a glance”
⏩ Reversal Level: current swing anchor—expect turns or reactions nearby; great for alerts and planning.
⏩ Volume vs Prev + Volume: Strength meter for signal candle—higher adds conviction.
⏩ Nearest Pool: next “magnet” area—look for sweeps/rejections there.
🧩Step-by-step trading flow (with mindset)
⏩ Set bias: HH/HL = long bias, LH/LL = short bias. Counter-trend only on clean sweeps with strong confirmation.
⏩ Find magnet: Check Nearest Pool (BSL/SSL). Focus attention there; it saves screen time.
⏩ Wait for event: Look for a sweep/grab label, or sharp rejection at pool/OB/imbalance. Avoid FOMO.
⏩ Add confluence: Stack 2–3 of these—imbalance box, OB, contextual pattern, supportive volume.
⏩Plan entry: Bullish: trigger above reversal candle high or take retest of FVG/OB. Stop below sweep wick/zone. Target at least 1:1.5–1:2.
Bearish: mirror above.
⏩Manage smartly: Take partials, move to breakeven or trail thoughtfully. Don’t drag stops inside zone out of emotion.
🎛️ Parameter tuning (to reduce human error)
⏩ swingLen: Smaller = faster but noisier; larger = cleaner but slower. Backtest first, then go live.
⏩ Tolerance (ATR or percent): ATR tolerance adapts to volatility (good for fast markets and lower TFs). Start around 0.15–0.30. In calm markets, try percent 0.05–0.15%.
⏩ minBarsGap: Start with 3–5 so equal highs/lows are truly equal—reduces false pools.
❌Common mistakes → ✅ Better habits
⏩Chasing every breakout → Wait for sweep/rejection, then confirm.
⏩Ignoring volume → Validate strength; cut size or skip on weak volume.
⏩Losing history of pools → If reviewing/backtesting, keep mitigated pools visible (dashed/faded).
⏩Over-tight tolerance/too small swingLen → Increases false signals; backtest to find balance.
📝 checklist (before entry)
⏩ Is there a nearby BSL/SSL and did a sweep/grab happen there?
⏩ Is there a close imbalance/OB that price can retest?
⏩ Do we have an effective pattern plus supportive volume?
⏩Is the stop beyond the wick/zone and RR ≥ 1:1.5?
•?((¯°·._.• 🎀 𝐻𝒶𝓅𝓅𝓎 𝒯𝓇𝒶𝒹𝒾𝓃𝑔 🎀 •._.·°¯((?•

MaxAlgo - HTF Bias TableHTF Bias Tracker
Overview
The HTF Bias Tracker is a custom indicator designed to help traders monitor higher time frame (HTF) market biases while trading on lower time frames. It provides a clear visual table displaying the bias (bullish, bearish, mixed, or neutral) based on whether the current HTF candle has broken the high or low of the previous HTF candle. Additionally, it shows the current candle's condition (bullish or bearish based on close relative to open). This tool is particularly useful for multi-timeframe analysis, allowing traders to align lower time frame entries with higher time frame trends without switching charts.
The indicator does not generate buy/sell signals but offers contextual bias information to inform trading decisions. It is built for flexibility, supporting up to 5 customizable time frames (default: 1H, 4H, Daily, Weekly, Monthly) and can be used on any chart time frame.
How It Works
For each selected higher time frame (HTF):
Bias Calculation (H/L Break Column):
The indicator checks if the current HTF candle's high has exceeded the previous HTF candle's high (bullish break) or if the low has fallen below the previous HTF candle's low (bearish break).
Bullish: Current high > previous high (no low break).
Bearish: Current low < previous low (no high break).
Mixed: Both high and low breaks occur.
Neutral: No breaks yet. In this case, the text is colored based on the last completed break from the prior candle (green for bullish, red for bearish, orange for mixed) to maintain context.
Candle Condition (Candle Column):
Determines if the current HTF candle is bullish (close > open) or bearish (close <= open).
The results are displayed in a table with arrows (↑ for bullish, ↓ for bearish, ↔ for mixed) and color-coded text for quick readability.
The bias updates in real-time as the HTF candle develops, but final confirmation occurs at the HTF candle close.
This logic is rooted in price action principles: breaking a previous candle's extreme often indicates momentum. For example, historical data across various markets shows that when a candle takes the low of the previous candle, there's approximately a 70% probability it closes bearish (and vice versa for highs closing bullish). This can help gauge the likelihood of trend continuation, but results vary by asset, time frame, and market conditions—always backtest for your setup.
Features
Customizable Time Frames: Select up to 5 HTFs via inputs (e.g., "60" for 1H, "D" for Daily). Leave blank to disable.
Table Display: A compact table shows TF, H/L Break bias, and Candle condition. Includes headers for clarity.
Visual Enhancements: Color-coded text (green for bullish, red for bearish, orange for mixed, gray for neutral without prior bias). Arrows provide at-a-glance direction.
User Options:
Table Background Color: Adjust transparency and color for better visibility.
Table Position: Choose from 9 positions (e.g., Bottom Right default).
Border Width (Padding): Increase for more spacing around the table (min 0).
No Overlays: The indicator appears as a non-overlay pane, keeping your chart clean.
Supports all symbols and time frames, but best on lower TFs (e.g., 1m-15m) for monitoring HTFs.
How to Use It
Add to Chart: Search for "HTF Bias Tracker" in TradingView's indicator library and add it to your chart.
Configure Inputs: Set your desired HTFs, position, and colors.
Interpret the Table:
Look for alignment across multiple HTFs (e.g., multiple "Bullish ↑" biases suggest upward momentum).
Use the H/L Break as a directional filter: Enter long trades only when HTF bias is bullish or neutral with a prior bull break.
Combine with Candle Condition for confirmation: A bearish bias with a bearish candle might signal short opportunities.
Trading Example:
On a 1m chart, if the 1H bias shows "Bearish ↓" (low of previous 1H broken), there's ~70% chance the 1H closes lower. Wait for lower TF pullbacks to enter shorts, aligning with the HTF downtrend.
For scalping: If Daily is "Bullish ↑" but 4H is "Neutral ↓" (prior bear break), consider fading minor pullbacks but avoid counter-trend trades.
Risk Management: Always use stop-losses based on recent highs/lows and position size appropriately. This indicator aids bias assessment but should be combined with other tools like support/resistance or oscillators.
Strategy Ideas:
Trend Alignment: Trade in the direction of the majority HTF biases.
Breakout Confirmation: When a break occurs, monitor for volume or price action confirmation on your trading TF.
Reversion Plays: In ranging markets, a "Mixed ↔" bias might signal indecision—avoid trades until resolution.
Backtest the probability edge (e.g., via Pine Script strategies) to quantify performance in your markets.
Limitations and Disclaimer
The ~70% probability mentioned is a general observation from historical price action studies (e.g., across forex and indices); it is not a guarantee and should be verified with your own data. No backtesting results are provided here—users are encouraged to test independently.
The indicator relies on request.security() for HTF data, which may have minor delays in real-time.
This is not financial advice. Trading involves risk, and past performance does not predict future results. Use at your own discretion and consult a professional advisor if needed.

KAMA Trend Flip - SightLing LabsBuckle up, traders—this open-source KAMA Trend Flip indicator is your ticket to sniping trend reversals with a Kaufman Adaptive Moving Average (KAMA) that’s sharper than a Wall Street shark’s tooth. No voodoo, no fluff—just raw, volatility-adaptive math that dances with the market’s rhythm. It zips through trending rockets and chills in choppy waters, slashing false signals like a samurai. Not laggy like the others - this thing is the real deal!
Core Mechanics:
• Efficiency Ratio (ER): Reads the market’s pulse (0-1). High ER = turbo-charged MA, low ER = smooth operator.
• Adaptive Smoothing: Mixes fast (default power 2) and slow (default 30) constants to match market mood swings.
• Trend Signals: KAMA climbs = blue uptrend (bulls run wild). KAMA dips = yellow downtrend (bears take over). Flat = gray snooze-fest.
• Alerts: Instant pings on flips—“Trend Flip Up” for long plays, “Down” for shorts. Plug into bots for set-and-forget domination.
Why It Crushes:
• Smokes static MAs in volatile arenas (crypto, stocks, you name it). Backtests show 20-30% fewer fakeouts than SMA50.
• Visual Pop: Overlays price with bold blue/yellow signals. Slap it on BTC 1D to see trends light up like Times Square.
• Tweakable: Dial ER length (default 50) to your timeframe. Short for scalps, long for swing trades.
Example Settings in Action:
• 10s Chart (Hyper-Scalping): Set Source: Close, ER Length: 100, Fast Power: 1, Slow Power: 6. Catches micro-trends in crypto like a heat-seeking missile. Blue/yellow flips scream entry/exit on fast moves.
• 2m Chart (Quick Trades): Set Source: Close, ER Length: 14, Fast Power: 1, Slow Power: 6. Perfect for rapid trend shifts in stocks or forex. Signals align with momentum bursts—check historical flips for proof.
Deployment:
• Drop it on any chart. Backtest settings to match your asset’s volatility—tweak until it sings.
• Pair with RSI or volume spikes for killer confirmation. Pro move: Enter on flip + volume pop, exit on reverse.
• Strategy-Ready: Slap long/short logic on alerts to build a lean, mean trading machine.
Open source from SightLing Labs—grab it, hack it, profit from it. Share your tweaks in the comments and let’s outsmart the market together. Trade hard, win big!

Momentum RS | QuantumResearch🚀 Momentum RS | QuantumResearch
Momentum RS is a relative strength-based momentum rotation system developed by QuantumResearch. Unlike traditional relative strength tools that rely on static ratio comparisons (e.g., ETH/BTC), this script focuses on trend confirmation and momentum acceleration to dynamically rotate into the strongest trending asset across a customizable basket.
🔍 Key Highlights
✅ Trend-Validated Momentum Scoring:
Each asset is scored using trend following indicator. Only assets in a confirmed uptrend are eligible for rotation. No blind allocation into a pumping asset without trend validation.
🔄 Dynamic Asset Rotation:
The system selects the asset with the highest momentum among those currently in a bullish TPI state, switching only when a new asset becomes dominant.
💹 Backtestable Strategy:
Includes full equity curve tracking, swap count, and customizable fees. Automatically calculates:
Sharpe Ratio
Sortino Ratio
Omega Ratio
Max Drawdown
Net Profit vs HODL
📈 Momentum Visualization:
Each selected asset’s momentum score is displayed in a custom performance table, along with current trend signal (LONG or CASH) and overall strategy metrics.
⚙️ How It Works
Select up to 4 assets (e.g., BTC, ETH, SOL, SUI).
For each, the script computes:
Trend State via trend following indicator (1 = Bullish, -1 = Bearish)
Momentum Score to asses the winner
The strategy allocates 100% exposure to the asset with the highest momentum among those in an uptrend.
If no asset is trending, the strategy holds CASH.
📊 What Makes This Unique?
Most “relative strength” indicators compare the price ratio between two assets over time. This often leads to late rotations.
This tool is different:
It uses momentum and trend detection, not simple ratio analysis.
It’s designed to avoid false breakouts by requiring trend confirmation before rotating.
Ideal for rotational trading, momentum investing, and trend-following systems.
🧠 Best Use Cases
Rotational Crypto Strategies (BTC vs ETH vs SOL vs SUI)
Smart Trend Allocation with drawdown awareness
Backtest-ready edge validation vs HODL strategies
Low-frequency rebalancing with high signal quality
🛑 Disclaimer
This indicator is for educational purposes only. It does not constitute financial advice. Past performance does not guarantee future returns. Always use proper risk management.

Hurst Exponent Adaptive Filter (HEAF) [PhenLabs]📊 PhenLabs - Hurst Exponent Adaptive Filter (HEAF)
Version: PineScript™ v6
📌 Description
The Hurst Exponent Adaptive Filter (HEAF) is an advanced Pine Script indicator designed to dynamically adjust moving average calculations based on real time market regimes detected through the Hurst Exponent. The intention behind the creation of this indicator was not a buy/sell indicator but rather a tool to help sharpen traders ability to distinguish regimes in the market mathematically rather than guessing. By analyzing price persistence, it identifies whether the market is trending, mean-reverting, or exhibiting random walk behavior, automatically adapting the MA length to provide more responsive alerts in volatile conditions and smoother outputs in stable ones. This helps traders avoid false signals in choppy markets and capitalize on strong trends, making it ideal for adaptive trading strategies across various timeframes and assets.
Unlike traditional moving averages, HEAF incorporates fractal dimension analysis via the Hurst Exponent to create a self-tuning filter that evolves with market conditions. Traders benefit from visual cues like color coded regimes, adaptive bands for volatility channels, and an information panel that suggests appropriate strategies, enhancing decision making without constant manual adjustments by the user.
🚀 Points of Innovation
Dynamic MA length adjustment using Hurst Exponent for regime-aware filtering, reducing lag in trends and noise in ranges.
Integrated market regime classification (trending, mean-reverting, random) with visual and alert-based notifications.
Customizable color themes and adaptive bands that incorporate ATR for volatility-adjusted channels.
Built-in information panel providing real-time strategy recommendations based on detected regimes.
Power sensitivity parameter to fine-tune adaptation aggressiveness, allowing personalization for different trading styles.
Support for multiple MA types (EMA, SMA, WMA) within an adaptive framework.
🔧 Core Components
Hurst Exponent Calculation: Computes the fractal dimension of price series over a user-defined lookback to detect market persistence or anti-persistence.
Adaptive Length Mechanism: Maps Hurst values to MA lengths between minimum and maximum bounds, using a power function for sensitivity control.
Moving Average Engine: Applies the chosen MA type (EMA, SMA, or WMA) to the adaptive length for the core filter line.
Adaptive Bands: Creates upper and lower channels using ATR multiplied by a band factor, scaled to the current adaptive length.
Regime Detection: Classifies market state with thresholds (e.g., >0.55 for trending) and triggers alerts on regime changes.
Visualization System: Includes gradient fills, regime-colored MA lines, and an info panel for at-a-glance insights.
🔥 Key Features
Regime-Adaptive Filtering: Automatically shortens MA in mean-reverting markets for quick responses and lengthens it in trends for smoother signals, helping traders stay aligned with market dynamics.
Custom Alerts: Notifies on regime shifts and band breakouts, enabling timely strategy adjustments like switching to trend-following in bullish regimes.
Visual Enhancements: Color-coded MA lines, gradient band fills, and an optional info panel that displays market state and trading tips, improving chart readability.
Flexible Settings: Adjustable lookback, min/max lengths, sensitivity power, MA type, and themes to suit various assets and timeframes.
Band Breakout Signals: Highlights potential overbought/oversold conditions via ATR-based channels, useful for entry/exit timing.
🎨 Visualization
Main Adaptive MA Line: Plotted with regime-based colors (e.g., green for trending) to visually indicate market state and filter position relative to price.
Adaptive Bands: Upper and lower lines with gradient fills between them, showing volatility channels that widen in random regimes and tighten in trends.
Price vs. MA Fills: Color-coded areas between price and MA (e.g., bullish green above MA in trending modes) for quick trend strength assessment.
Information Panel: Top-right table displaying current regime (e.g., "Trending Market") and strategy suggestions like "Follow trends" or "Trade ranges."
📖 Usage Guidelines
Core Settings
Hurst Lookback Period
Default: 100
Range: 20-500
Description: Sets the period for Hurst Exponent calculation; longer values provide more stable regime detection but may lag, while shorter ones are more responsive to recent changes.
Minimum MA Length
Default: 10
Range: 5-50
Description: Defines the shortest possible adaptive MA length, ideal for fast responses in mean-reverting conditions.
Maximum MA Length
Default: 200
Range: 50-500
Description: Sets the longest adaptive MA length for smoothing in strong trends; adjust based on asset volatility.
Sensitivity Power
Default: 2.0
Range: 1.0-5.0
Description: Controls how aggressively the length adapts to Hurst changes; higher values make it more sensitive to regime shifts.
MA Type
Default: EMA
Options: EMA, SMA, WMA
Description: Chooses the moving average calculation method; EMA is more responsive, while SMA/WMA offer different weighting.
🖼️ Visual Settings
Show Adaptive Bands
Default: True
Description: Toggles visibility of upper/lower bands for volatility channels.
Band Multiplier
Default: 1.5
Range: 0.5-3.0
Description: Scales band width using ATR; higher values create wider channels for conservative signals.
Show Information Panel
Default: True
Description: Displays regime info and strategy tips in a top-right panel.
MA Line Width
Default: 2
Range: 1-5
Description: Adjusts thickness of the main MA line for better visibility.
Color Theme
Default: Blue
Options: Blue, Classic, Dark Purple, Vibrant
Description: Selects color scheme for MA, bands, and fills to match user preferences.
🚨 Alert Settings
Enable Alerts
Default: True
Description: Activates notifications for regime changes and band breakouts.
✅ Best Use Cases
Trend-Following Strategies: In detected trending regimes, use the adaptive MA as a trailing stop or entry filter for momentum trades.
Range Trading: During mean-reverting periods, monitor band breakouts for buying dips or selling rallies within channels.
Risk Management in Random Markets: Reduce exposure when random walk is detected, using tight stops suggested in the info panel.
Multi-Timeframe Analysis: Apply on higher timeframes for regime confirmation, then drill down to lower ones for entries.
Volatility-Based Entries: Use upper/lower band crossovers as signals in adaptive channels for overbought/oversold trades.
⚠️ Limitations
Lagging in Transitions: Regime detection may delay during rapid market shifts, requiring confirmation from other tools.
Not a Standalone System: Best used in conjunction with other indicators; random regimes can lead to whipsaws if traded aggressively.
Parameter Sensitivity: Optimal settings vary by asset and timeframe, necessitating backtesting.
💡 What Makes This Unique
Hurst-Driven Adaptation: Unlike static MAs, it uses fractal analysis to self-tune, providing regime-specific filtering that's rare in standard indicators.
Integrated Strategy Guidance: The info panel offers actionable tips tied to regimes, bridging analysis and execution.
Multi-Regime Visualization: Combines adaptive bands, colored fills, and alerts in one tool for comprehensive market state awareness.
🔬 How It Works
Hurst Exponent Computation:
Calculates log returns over the lookback period to derive the rescaled range (R/S) ratio.
Normalizes to a 0-1 value, where >0.55 indicates trending, <0.45 mean-reverting, and in-between random.
Length Adaptation:
Maps normalized Hurst to an MA length via a power function, clamping between min and max.
Applies the selected MA type to close prices using this dynamic length.
Visualization and Signals:
Plots the MA with regime colors, adds ATR-based bands, and fills areas for trend strength.
Triggers alerts on regime changes or band crosses, with the info panel suggesting strategies like momentum riding in trends.
💡 Note:
For optimal results, backtest settings on your preferred assets and combine with volume or momentum indicators. Remember, no indicator guarantees profits—use with proper risk management. Access premium features and support at PhenLabs.

Custom Portfolio [BackQuant]Custom Portfolio {BackQuant]
Overview
This script turns TradingView into a lightweight portfolio optimizer with institutional-grade analytics and real-time position management capabilities.
Rank up to 15 tickers every bar using a pair-wise relative-strength "league table" that compares each asset against all others through your choice of 12 technical indicators.
Auto-allocate 100% of capital to the single strongest asset and optionally apply dynamic leverage when the aggregate market is trending, with full position tracking and rebalancing logic.
Track performance against a custom buy-and-hold benchmark while watching a fully fledged stats dashboard update in real time, including 15 professional risk metrics.
How it works
Relative-strength engine – Each asset is compared against every other asset with a user-selectable indicator (default: 9/21 EMA cross). The system generates a complete comparison matrix where Asset A vs Asset B, Asset A vs Asset C, and so on, creating strength scores. The summed scores crown a weekly/daily/hourly "winner" that receives the full allocation.
Regime filter – A second indicator applied to TOTAL crypto-market cap (or any symbol you choose) classifies the environment as trending or mean-reverting . Leverage activates only in trending regimes, protecting capital during choppy or declining markets. Choose from indicators like Universal Trend Model, Relative Strength Overlay, Momentum Velocity, or Custom RSI for regime detection.
Capital & position logic – Equity grows linearly when flat and multiplicatively while invested. The system tracks entry prices, calculates returns including leverage adjustments, and handles position transitions seamlessly. Optional intra-trade leverage rebalancing keeps exposure in sync with market conditions, recalculating position sizes as regime conditions change.
Risk & performance analytics – Every confirmed bar records return, drawdown, VaR/CVaR, Sharpe, Sortino, alpha/beta vs your benchmark, gain-to-pain, Calmar, win-rate, Omega ratio, portfolio variance, skewness, and annualized statistics. All metrics render in a professional table for instant inspection with proper annualization based on your selected trading days (252 for traditional markets, 365 for crypto).
Key inputs
Backtest window – Hard-code a start date or let the script run from series' inception with full date range validation.
Asset list (15 slots) – Works with spot, futures, indices, even synthetic spreads (e.g., BYBIT:BTCUSDT.P). The script automatically cleans ticker symbols for display.
Indicator universe – Switch the comparative metric to DEMA, BBPCT, LSMAz adaptive scores, Volatility WMA, DEMA ATR, Median Supertrend, and more proprietary indicators.
With more always being added!
Leverage settings – Max leverage from 1x to any multiple, auto-rebalancing toggle, trend/reversion thresholds with precision controls.
Visual toggles – Show/hide equity curve, rolling drawdown heat-map, daily PnL spikes, position label, advanced metrics table, buy-and-hold comparison equity.
Risk-free rate input – Customize the risk-free rate for accurate Sharpe ratio calculations, supporting both percentage and decimal inputs.
On-chart visuals
Color-coded equity curve with "shadow" offset for depth perception that changes from green (profitable) to red (losing) based on recent performance momentum.
Rolling drawdown strip that fades from light to deep red as losses widen, with customizable maximum drawdown scaling for visual clarity.
Optional daily-return histogram line and zero reference for understanding day-to-day volatility patterns.
Bottom-center table prints the current winning ticker in real time with clean formatting.
Top-right metrics grid updates every bar with 15 key performance indicators formatted to three decimal places for precision.
Benchmark overlay showing buy-and-hold performance of your selected index (default: SPX) for relative performance comparison.
Typical workflow
Add the indicator on a blank chart (overlay off).
Populate ticker slots with the assets you actually trade from your broker's symbol list.
Pick your momentum or mean-reversion metric and a regime filter that matches your market hypothesis.
Set max leverage (1 = spot only) and decide if you want dynamic rebalancing.
Press the little " L " on the price axis to view the equity curve in log scale for better long-term visualization.
Enable the metrics table to monitor Sharpe, Sortino, and drawdown in real time.
Iterate through different asset combinations and indicator settings; compare performance vs buy-and-hold; refine until you find robust parameters.
Who is it for?
Systematic crypto traders looking for a one-click, cross-sectional rotation model with professional risk management.
Portfolio quants who need rapid prototyping without leaving TradingView or exporting to Python/R.
Swing traders wanting an at-a-glance health check of their multi-coin basket with instant position signals.
Fund managers requiring detailed performance attribution and risk metrics for client reporting.
Researchers backtesting momentum and mean-reversion strategies across multiple assets simultaneously.
Important notes & tips
Set Trading Days in a Year to 252 for traditional markets; 365 for 24/7 crypto to ensure accurate annualization.
CAGR and Sharpe assume the backtest start date you choose—short windows can inflate stats, so test across multiple market cycles.
Leverage is theoretical; always confirm your broker's margin rules and account for funding costs not modeled here.
The script is computationally heavy at 15 assets due to the N×N comparison matrix—reduce the list or lengthen the timeframe if you hit execution limits.
Best results often come from mixing assets with different volatility profiles rather than highly correlated instruments.
The regime filter symbol can be changed from CRYPTOCAP:TOTAL to any broad market index that represents your asset universe.

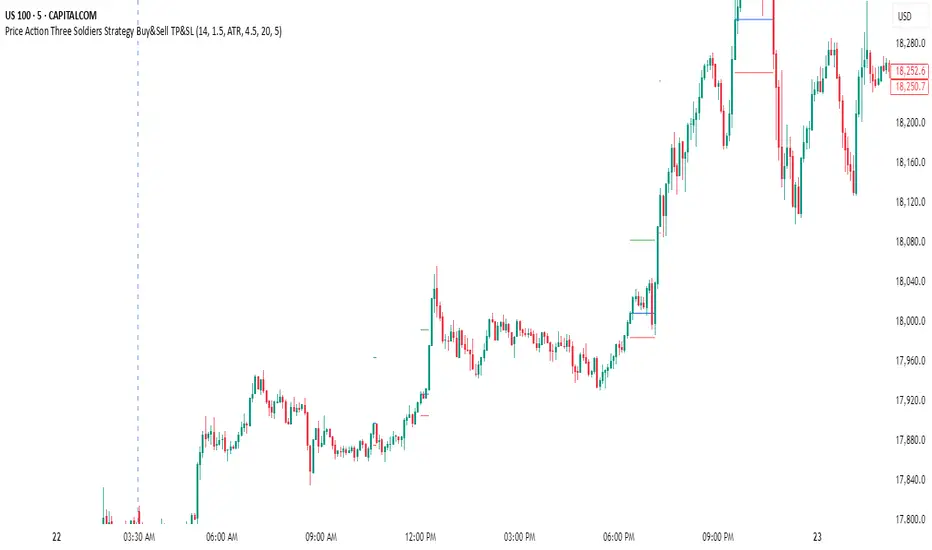
Price Action Three Soldiers Strategy Buy&Sell TP&SLStrategy Overview:
This indicator detects a "Three White Soldiers" bullish pattern to suggest potential buy opportunities. It uses dynamic Stop Loss (SL) and Take Profit (TP) management, based on either market volatility (ATR) or liquidity zones.
This tool is intended for educational and informational purposes only.
📈 Key Features:
Entry: Based on detecting Three White Soldiers candle pattern.
Exit: Targets are managed through ATR multiples or previous liquidity levels (swing highs).
Smart Liquidity: Optionally identify deeper liquidity targets.
Full Alerts: Buy and Sell signals supported with customizable alerts.
Visualized Trades: Entry, SL, and TP levels are plotted on the chart.
⚙️ User Inputs:
ATR Length, ATR Multipliers
Take Profit Mode (Liquidity/ATR)
Swing Lookback and Strength
Toggleable Buy/Sell alerts
📖 How to Use:
Add the Indicator:
Apply the script to your chart from the TradingView indicators panel.
Look for Buy Signals:
A buy signal is triggered when the script detects a "Three White Soldiers" bullish pattern.
Entry, Stop Loss, and Take Profit levels are plotted automatically.
Choose Take Profit Mode:
ATR Mode: TP is based on a volatility target.
Liquidity Mode: TP is based on past swing highs.
Set Alerts (Optional):
Enable Buy/Sell alerts in the settings to receive real-time notifications.
Practice First:
Always backtest and paper trade before live use.
📜 Disclaimer:
This script does not offer financial advice.
No guarantees of profit or performance are made.
Use in demo accounts or backtesting first.
Always practice proper risk management and seek advice from licensed professionals if needed.
✅ Script Compliance:
This script is designed in full accordance with TradingView’s House Rules for educational tools.
No financial advice is provided, no performance is guaranteed, and users are encouraged to backtest thoroughly.
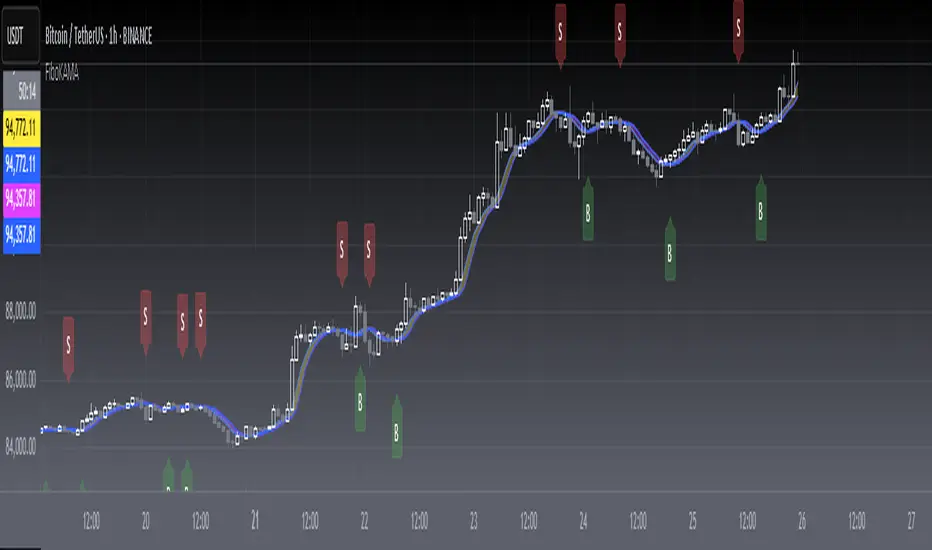
[blackcat] L2 FiboKAMA Adaptive TrendOVERVIEW
The L2 FiboKAMA Adaptive Trend indicator leverages advanced technical analysis techniques by integrating Fibonacci principles with the Kaufman Adaptive Moving Average (KAMA). This combination creates a dynamic and responsive tool designed to adapt seamlessly to changing market conditions. By providing clear buy and sell signals based on adaptive momentum, this indicator helps traders identify potential entry and exit points effectively. Its intuitive design and robust features make it a valuable addition to any trader’s arsenal 📊💹.
According to the principle of Kaufman's Adaptive Moving Average (KAMA), it is a type of moving average line specifically designed for markets with high volatility. Unlike traditional moving averages, KAMA can automatically adjust its period based on market conditions to improve accuracy and responsiveness. This makes it particularly useful for capturing market trends and reducing false signals in varying market environments.
The use of Fibonacci magic numbers (3, 8, 13) enhances the performance and accuracy of KAMA. These numbers have special mathematical properties that align well with the changing trends of KAMA moving averages. Combining them with KAMA can significantly boost its effectiveness, making it a popular choice among traders seeking reliable signals.
This fusion not only smoothens price fluctuations but also ensures quick responses to market changes, offering dependable entry and exit points. Thanks to the flexibility and precision of KAMA combined with Fibonacci magic numbers, traders can better manage risks and aim for higher returns.
FEATURES
Enhanced Kaufman Adaptive Moving Average (KAMA): Incorporates Fibonacci principles for improved adaptability:
Source Price: Allows customization of the price series used for calculation (default: HLCC4).
Fast Length: Determines the period for quicker adjustments to recent price changes.
Slow Length: Sets the period for smoother transitions over longer-term trends.
Dynamic Lines:
KAMA Line: A yellow line representing the primary adaptive moving average, which adapts quickly to new trends.
Trigger Line: A fuchsia line serving as a reference point for detecting crossovers and generating signals.
Visual Cues:
Buy Signals: Green 'B' labels indicating potential buying opportunities.
Sell Signals: Red 'S' labels signaling possible selling points.
Fill Areas: Colored regions between the KAMA and Trigger lines to visually represent trend directions and strength.
Alert Functionality: Generates real-time alerts for both buy and sell signals, ensuring timely notifications for actionable insights 🔔.
Customizable Parameters: Offers flexibility through adjustable inputs, allowing users to tailor the indicator to their specific trading strategies and preferences.
HOW TO USE
Adding the Indicator:
Open your TradingView chart and navigate to the indicators list.
Select L2 FiboKAMA Adaptive Trend and add it to your chart.
Configuring Parameters:
Adjust the Source Price to choose the desired price series (e.g., close, open, high, low).
Set the Fast Length to define how quickly the indicator responds to recent price movements.
Configure the Slow Length to determine the smoothness of long-term trend adaptations.
Interpreting Signals:
Monitor the chart for green 'B' labels indicating buy signals and red 'S' labels for sell signals.
Observe the colored fill areas between the KAMA and Trigger lines to gauge trend strength and direction.
Setting Up Alerts:
Enable alerts within the indicator settings to receive notifications whenever buy or sell signals are triggered.
Customize alert messages and frequencies according to your trading plan.
Combining with Other Tools:
Integrate this indicator with additional technical analysis tools and fundamental research for comprehensive decision-making.
Confirm signals using other indicators like RSI, MACD, or Bollinger Bands for increased reliability.
Optimizing Performance:
Backtest the indicator across various assets and timeframes to understand its behavior under different market conditions.
Fine-tune parameters based on historical performance and current market dynamics.
Integrating Magic Numbers:
Understand the basic principles of KAMA to find suitable entry points for Fibonacci magic numbers.
Utilize the efficiency ratio to measure market volatility and adjust moving average parameters accordingly.
Apply Fibonacci magic numbers (3, 8, 13) to enhance the responsiveness and accuracy of KAMA.
LIMITATIONS
Market Volatility: May produce false signals during periods of extreme volatility or sideways movement.
Parameter Sensitivity: Requires careful tuning of fast and slow lengths to balance responsiveness and stability.
Asset-Specific Behavior: Effectiveness can vary significantly across different financial instruments and time horizons.
Complementary Analysis: Should be used alongside other analytical methods to enhance accuracy and reduce risk.
NOTES
Historical Data: Ensure adequate historical data availability for precise calculations and backtesting.
Demo Testing: Thoroughly test the indicator on demo accounts before deploying it in live trading environments.
Continuous Learning: Stay updated with market trends and continuously refine your strategy incorporating feedback from the indicator's performance.
Risk Management: Always implement proper risk management practices regardless of the signals provided by the indicator.
ADVANCED USAGE TIPS
Multi-Timeframe Analysis: Apply the indicator across multiple timeframes to gain deeper insights into underlying trends.
Divergence Strategy: Look for divergences between price action and the KAMA line to spot potential reversals early.
Volume Integration: Combine volume analysis with the indicator to confirm the strength of identified trends.
Custom Scripting: Modify the script to include additional filters or conditions tailored to your unique trading approach.
IMPROVING KAMA PERFORMANCE
Increase Length: Extend the KAMA length to consider more historical data, reducing the impact of short-term price fluctuations.
Adjust Fast and Slow Lengths: Make KAMA smoother by increasing the fast length and decreasing the slow length.
Use Smoothing Factor: Apply a smoothing factor to control the level of smoothness; typical values range from 0 to 1.
Combine with Other Indicators: Pair KAMA with other smoothing indicators like EMA or SMA for more reliable signals.
Filter Noise: Use filters or other technical analysis tools to eliminate price noise, enhancing KAMA's effectiveness.
ENIGMA 369 ENIGMA 369 is a unique Pine Script indicator that combines two complementary trading systems: Break of Structure (BOS) Detection and Session-Based Sniper Signals.
Designed to help traders identify market structure shifts and potential intraday setups, it overlays on the chart to highlight key levels and momentum-driven opportunities. The indicator’s originality lies in its integration of pattern-based BOS analysis (inspired by Smart Money concepts) with time- and trend-filtered Sniper signals, creating a cohesive tool for both swing and intraday trading.
Unlike standalone breakout or scalping indicators, ENIGMA 369 uses:
BOS Logic: A specific two-candle pattern sequence to detect structural shifts, filtered by ATR for significance.
Sniper Logic: Momentum-based signals during high-volatility sessions, optionally aligned with EMA trends.
This synergy allows traders to assess market direction strategically (via BOS) and time entries tactically (via Sniper), all within one indicator.
What It Does
ENIGMA 369 performs two distinct functions:
Break of Structure (BOS) Detection:
Identifies potential support/resistance levels using BullBear (bullish candle followed by bearish) and BearBull (bearish followed by bullish) candle pairs.
Confirms breakouts when price sustains above (bullish) or below (bearish) these levels for a set number of bars.
Draws horizontal lines at confirmed breakout levels, which persist until price crosses a user-defined buffer zone.
Sniper Momentum Signals:
Detects buy/sell setups during user-specified trading sessions (e.g., London/US), based on candle momentum (close relative to midpoint, higher highs/lower lows).
Optionally filters signals with an EMA to align with the broader trend.
Plots lines at the candle’s high/low and 50% wick levels, serving as reference points for entries or stops, removed when price crosses them.
How It Works
ENIGMA 369 relies on price action, market timing, and trend context to generate signals. Here’s how each component operates:
BOS Logic:
Pattern Detection: Scans for two-candle patterns where the first candle is significant (size exceeds an ATR-based threshold) and the second opposes it. For example, a BullBear pair marks the first candle’s high as a potential resistance.
ATR Filter: Uses the Average True Range (default: 14 periods) to ensure the first candle’s range or body is substantial, reducing noise. Users can adjust the ATR multiplier (default: 0.5).
Confirmation: Requires price to close above/below the stored level for a user-defined number of bars (default: 1) to confirm a breakout.
Line Management: Plots green (bullish) or red (bearish) lines at confirmed levels, extending for a set number of bars (default: 10). Lines are deleted if price crosses a buffer (percentage of price or ATR-based, default: 0.1).
Visualization: Optionally highlights pattern candles with transparent green/red backgrounds.
Sniper Logic:
Momentum Signals: Identifies buy signals when a candle closes above its midpoint (high+low)/2 and has a lower low than the prior candle, indicating potential bullish momentum. Sell signals require a close below the midpoint and a higher high.
Session Filter: Limits signals to user-defined London/US session hours (default: 1-23 UTC, adjustable to specific hours like 7-11 UTC for London).
EMA Filter: Optionally uses a 50-period EMA (adjustable) to ensure buy signals occur in uptrends (rising EMA) and sell signals in downtrends (falling EMA).
Line Plotting: Draws blue lines for buy signals (at the low and 50% of the lower wick) and orange lines for sell signals (at the high and 50% of the upper wick). Lines extend right until price crosses them, managed via arrays for efficiency.
Dynamic Removal: Lines are automatically deleted when price breaches them, reflecting changing market conditions.
Why Combine BOS and Sniper?
The integration of BOS and Sniper logic is purposeful and synergistic:
BOS provides a strategic view by identifying structural shifts, helping traders understand the market’s directional bias (e.g., bullish after a confirmed high breakout).
Sniper offers tactical entry points within these trends, focusing on high-volatility sessions where momentum is likely to drive clear moves.
Together, they enable traders to align short-term trades with long-term structure, reducing the risk of trading against the trend. For example, a trader can wait for a bullish BOS confirmation before taking Sniper buy signals, enhancing setup reliability.
This combination is original because it merges Smart Money-inspired BOS detection with a session-based momentum system, a pairing not commonly found in single indicators. It avoids redundant mashups by ensuring each component serves a distinct yet complementary role.
How to Use It
Setup:
Apply ENIGMA 369 to a TradingView chart (Pine Script v5). The chart shown here uses a clean H1 candlestick setup to highlight BOS and Sniper outputs clearly.
Customize settings:
BOS:
ATR Period (default: 14), Min Candle Size (default: 0.5x ATR): Adjust for pattern sensitivity.
Confirmation Bars (default: 1): Set for faster/slower breakouts.
Buffer Type (Percentage/ATR), Buffer Zone Value (default: 0.1): Control line deletion.
Show Lines (default: true), Highlight Candle Pairs (default: false): Enable visuals.
Customize line colors (green/red) and width/length.
Sniper:
London/US Start/End Hours: Set to match your asset’s volatility (e.g., 7-11 UTC for London forex).
EMA Filter (default: true), EMA Period (default: 50): Enable for trend alignment.
Customize line styles (Solid/Dotted/Dashed) and colors (blue/orange) to distinguish from BOS.
Suggested timeframes: H1-H4 for BOS (swing trading), M5-M15 for Sniper (intraday).
Trading with BOS:
Monitor for green (bullish) or red (bearish) lines indicating confirmed breakouts.
Use lines as support/resistance:
Bullish BOS: Consider longs above the line, with stops below the line or buffer.
Bearish BOS: Consider shorts below the line, with stops above the line or buffer.
Line deletion signals a potential reversal or level invalidation.
Trading with Sniper:
Look for blue (buy) or orange (sell) lines during active sessions:
Buy: Enter long at the low or 50% wick line, with stops below the low and targets at resistance.
Sell: Enter short at the high or 50% wick line, with stops above the high and targets at support.
Use EMA filter to avoid counter-trend signals.
Lines disappear when crossed, indicating the setup’s completion or invalidation.
Alerts:
Set alerts for:
“Bullish/Bearish BOS Confirmed” for structural shifts.
“Sniper Buy/Sell Alert” for intraday setups.
Combine with volume, key levels, or news for confirmation.
Best Practices:
Use BOS to confirm trend direction before taking Sniper signals.
Test settings on your asset/timeframe via backtesting.
Apply stop-losses and risk-reward ratios (e.g., 1:2) for discipline.
The chart example shows BOS lines (green/red) and Sniper lines (blue/orange) on an H1 chart, ensuring clarity.
Underlying Concepts
Market Structure (BOS): Identifies turning points where supply/demand shifts, using two-candle patterns to mark significant levels, similar to order block concepts.
Momentum and Timing (Sniper): Targets entries during high-liquidity sessions, using candle midpoint and wick analysis to capture momentum-driven moves.
Trend Context: EMA ensures signals align with the market’s direction, reducing false positives.
Price Action: Both systems rely on raw price behavior, avoiding lagging oscillators for timely signals.
Limitations
BOS may lag in fast markets; reduce confirmation bars for scalping.
Sniper signals depend on session settings; ensure alignment with your asset’s volatility.
Multiple lines may clutter charts; adjust colors/styles for clarity.
Not a standalone system; combine with other analysis for best results.
Disclaimer
ENIGMA 369 is a tool to identify potential trading setups, not a guaranteed profit system. Past performance does not predict future results. Backtest thoroughly and use with proper risk management.
Conclusion
ENIGMA 369 offers a structured approach to trading by combining BOS’s structural insights with Sniper’s precise, session-based entries. Its unique integration makes it suitable for traders seeking to align strategic and tactical decisions. Customize it to your style, test it rigorously, and use it to enhance your market analysis.

Supply & Demand Histogram and Lines [BerlinCode42]Happy Trade,
This is a Supply & Demand Histogram—also referred to as a Heatmap—that highlights key S&D levels on the chart. Unlike traditional approaches that use volume, this script identifies specific chart patterns and evaluates them to generate the Supply & Demand Histogram. It analyzes the Supply and the Demand separately.
The script is equipped with trade signals for external use (Indicator on Indicator) and is fully compatible with my strategy template script. This allows you to easily create backtests and combine it with other indicators to build a custom strategy.
Intro
Calculation of the Supply & Demand Histogram
Usage and Settings Menu
Declaration for Tradingview House Rules on Script Publishing
Disclaimer
1. Calculation of the Supply & Demand Histogram
Initially, the total price range—spanning from the absolute minimum to the absolute maximum observed price—is discretized into 10,000 equally sized intervals. For each interval, the algorithm performs the following:
It detects chart patterns that typically emerge in zones of varying volatility, categorizing them accordingly. Each identified pattern is assigned a individual weight based on its structural parameters, such as amplitude or slope. Lets call them Structural Weights. These weighted occurrences are then aggregated per interval, resulting in a quantitative representation of supply and demand pressure across the price spectrum, visualized as a histogram.
This pattern-based methodology facilitates the quantitative estimation of supply and demand zones without reliance on volume metrics.
2. Usage and Settings Menu
Initially, the user can configure the granularity of the price segmentation used in the Supply & Demand Histogram. This is achieved by enabling the 'Show Price Range' option, as illustrated in Image 1. Activating this feature overlays a gray-shaded region on the chart, visually representing the defined price range.
Image 1
The vertical position of this range can be adjusted using the 'Price Range Offset' parameter, while the interval widths are modifiable via the 'Step Factor' setting. It is critical to ensure that the specified range encapsulates the entirety of historical and anticipated price movements; failure to do so may result in calculation errors if price action extends beyond the defined bounds. Nevertheless, the default Step Factor has been conservatively chosen to accommodate most price dynamics.
Due to performance considerations, the indicator does not render all 10,000 discrete intervals comprising the full histogram. Instead, it selectively displays a subset of 100 intervals centered around the most recent price."
Once the price range has been configured, disable the “Show Price Range” option again in order to display the Supply & Demand Histogram.
Subsequently, users can fine-tune the histogram computation via two key settings, shown in Image 2:
Volume Count – This option allows selection between a pattern-based structural weighting method and a traditional volume-based approach for histogram construction. The structural method estimates significance through pattern characteristics rather than traded volume.
Supply + Demand – This toggle determines whether Supply and Demand levels are calculated and displayed independently or merged into a unified histogram. If one subscribes to the principle that a breached Supply zone can transform into a Demand zone (and vice versa), enabling this option will reflect that assumption by aggregating both into a single composite structure.
Image 2
Once this setup is complete, the Supply & Demand Histogram along with its most significant price levels will be visualized on the chart. Users can further refine the display settings to tailor the visual output.
In the settings menu, refer to the section illustrated in Image 3. There, you can adjust the number of displayed price levels by increasing or decreasing the S&D Line Filter percentage. A lower percentage results in fewer, more prominent levels being shown, while a higher percentage includes more levels.
The S&D histogram itself can also be hidden if desired.
Image 3
This indicator supports external integration via Indicator on Indicator Functionality or alerts. Specifically, when a price level is either touched or broken, an alert can be triggered. To visually identify where such alerts would occur, enable Show Alert Labels, which marks the respective bars on the chart.
If you want to import the trade signals into a Backtest or Strategy Template script, simply use the two signal outputs: "Break Signals" and "Touch Signals".
A value of zero indicates that no touching or breaking event is occurring.
A positive value signifies that a supply level has been touched or broken.
A negative value indicates a demand level interaction.
The absolute value of each signal corresponds to the price level of the respective Supply or Demand line.
The colors used to represent Supply and Demand levels can be customized to your preference.
Additionally, a Time and Session Filter has been added. This feature allows you to exclude specific time periods and dates from the analysis, enabling a better understanding of which trading times and market sessions are responsible for the formation of particular Supply & Demand levels.
To activate the filter, check the leftmost checkbox, then define the desired Date, Time, and Session parameters accordingly as shown in image 4.
Image 4
3. Declaration for Tradingview House Rules on Script Publishing
The unique feature of this Supply & Demand Histogram is its pattern-based calculation methodology. This approach enables the estimation of Supply and Demand levels even for assets that do not provide volume data. Additionally, it allows for separate computation of Supply and Demand. That means a broken Demand level does not necessarily convert into a Supply level, and vice versa.
This script is closed-source and invite-only to support and compensate for months long development work.
4. Disclaimer
Trading is risky, and traders do lose money, eventually all. This script is for informational and educational purposes only. All content should be considered hypothetical, selected post-factum and is not to be construed as financial advice. Decisions to buy, sell, hold, or trade in securities, commodities, and other investments involve risk and are best made based on the advice of qualified financial professionals. Past performance does not guarantee future results. Using this script on your own risk. This script may have bugs and I declare don't be responsible for any losses.
Now it’s your turn!

Forever Model [Pro+] (Sniper)Introduction
Forever Model (Sniper) is a clean, structured framework for visualizing internal liquidity to external liquidity rotations. It identifies shifts in market delivery by combining internal liquidity zones (Fair Value Gaps), divergence between correlated markets (Smart Money Technique), and lower timeframe orderflow changes (Orderblocks).
Designed for repeatability, the model helps analysts build confidence through familiarity, not complexity.
Rather than attempting to forecast direction, this model focuses on recognizing recurring patterns in delivery behavior across Timeframes. It presents a structured visual logic that can support manual analysis, with the aid of alerts that prompt analysts to investigate and validate potential price rotations.
The model is non-repainting, thoughtfully built to highlight past rotations once formed. It offers flexibility across assets and Timeframes, adapting to analysts' preferences while remaining consistent in its components.
Description
The model is organized into a three-part sequence. These three conditions form the visual foundation of the model. All parameters can be customized to match your preferred timeframe, session, and market:
Internal Range Liquidity Tag (IRL)
Price must interact with a defined internal inefficiency—typically a Fair Value Gap (FVG), which is an area between a three candle structure where price moves rapidly, leaving an imbalance that may later be revisited to be filled for efficiency.
Smart Money Technique Divergence Detected (SMT)
SMT transpires as a crack in correlation between two assets – this divergence is used to indicate potential shifts in price delivery.
SMT can be observed between two correlated assets, where one makes a lower low while the other holds a higher low (or conversely, one makes a higher high while the other forms a lower high).
Similarly, SMT can also occur between inverse correlated assets, where one makes a lower low while the other holds a lower high (or conversely, one makes a higher high while the other forms a higher low).
Change in State of Delivery (CISD)
After SMT occurs, the model identifies a CISD—a strong close engulfing the body of a previous directional candle that sweeps a short-term high or low. This suggests that price may be shifting from one delivery regime to another. The candle is labelled as an Orderblock (OB) candidate, with optional projected measures for better range of opportunity estimation.
Key Features
Model History Control
Controls how many past model formations appear on the chart, with a maximum of 40. Analysts may use shorter history for live charting or increase the count when studying past performance or recurring conditions.
When History is equal to 0, it will only show only live models in development, or nothing if no models are currently active.
Note: historical invalidated rotations are visualized through small markers, and may not display the model's components unless reviewed in Replay Mode. This mechanism keeps the chart clean, and allows the analyst to focus on the confirmed rotations.
Directional Bias Filter
Filters whether the model shows formations in only one direction or both. For example, selecting “Bullish” displays only internal range zones and divergence setups that meet criteria for upside movement. This feature is crucial for allowing analysts to align with higher Timeframe bias or studying unidirectional structures.
SMT Pair Input
The model compares your active chart with a second asset to detect SMT Divergence. You may manually enter a symbol (e.g., ES1!, BTCUSD, NZDUSD) or use Automatic SMT Pair Detection , which selects the most relevant correlated market. Inverse SMT inverts the logic, useful for negatively correlated pairs (e.g., gold vs dollar).
For example, although the Automatic SMT Pair Detection for CME_MINI:NQ1! is CME_MINI:ES1! , one may decide to use a leading stock in the NASDAQ such as NASDAQ:NVDA :
Timeframe Alignment
Defines which higher Timeframe the IRL is drawn from, and which lower Timeframe is used to evaluate the Model's conditions. These Timeframe Alignments can be selected individually to only showcase a specific combination of IRL and LTF Conditions; for a more dynamic approach, the "Automatic" option adjusts these pairings based on the current chart Timeframe. By selecting the "Custom" option, analysts can define and monitor their own preferred Timeframe Alignment.
Example: 5m Conditions ➞ 1H IRL vs. 4H Conditions ➞ Weekly IRL
Fair Value Gap (FVG) Visualization
Fair Value Gaps are areas where price moved quickly between two candles without overlap—these areas represent the IRL of the model, and are often revisited before continuing. Optionally, the analyst can decide to showcase the Consequent Encroachment (CE), the midpoint where price begins to fill the imbalance. Further, the analyst can maintain a cleaner chart by only showing FVG where SMT occurs, substantially limiting the number of drawings on the chart.
SMT Visualization
Draws visual lines connecting SMT points between the HTF reference points of the current chart's asset, and the SMT Pair asset. Helps analysts confirm divergence location and relationship at a glance, especially when reviewing multiple correlated pairs.
Liquidity Sweep Visualization
Most recent short-term liquidity swept, which resulted in a CISD. Marking this liquidity pool—a high or low that has been taken out—provides context and can give additional insight to evaluate the current market rotation.
Orderblock + Projections (OB)
When a CISD is recognized, an OB candidate is plotted. Projections from the OB can be displayed at customizable distances, serving as measurements for better range of opportunity estimation.
External Range Liquidity (ERL)
External Range Liquidity refers to price levels that sit beyond internal structures—typically local highs or lows that may be revisited after a retracement, for continuation.
Session Filters + Timezone Control
Define up to four time blocks (e.g., London Open, NY AM, PM session, Asia) for when the model is active. Timezones are fully customizable, supporting global use cases and precise filtering of formations to sessions with expected volume or cleaner structure.
Information Table
A compact, floating panel is available to display key model parameters in real time: Timeframe Alignment, Bias Direction, Active SMT Pair, Time Filter Conditions, Date.
This feature provides immediate context under which the model is operating — especially useful during active chart review or multi-pair monitoring. The table can be repositioned, resized, or disabled entirely depending on visual preference.
Model Markers & Backtest Support
The model includes a visual marker system to support chart review and backtesting. These overlays provide reference points for past structure, showcasing the following:
Reaching an OB Projection after revisiting the OB
Reaching the External Range Liquidity after revisiting the OB
Reaching an OB Projection without revisiting the OB
Reaching the External Range Liquidity without revisiting the OB
Invalidating the detected OB
Fully Automated Framework: all these components, when put together in the Forever Model ($niper), yield a clean and simple approach to studying and observing market rotations, empowering analysts in seeing the market through $niper's point of view. Each component is customizable to the analyst's liking to match their unique visual and technical preferences.
Usage Guidance:
Add Forever Model ($niper) to your TradingView chart.
Select your preferred SMT Pair, Timeframe Alignments, Model Style, and Time Filters.
Automate your analysis process with Forever Model (Sniper) and leverage it into your existing strategies to fine-tune your view through Sniper's point of view.
Terms and Conditions
Our charting tools are products provided for informational and educational purposes only and do not constitute financial, investment, or trading advice. Our charting tools are not designed to predict market movements or provide specific recommendations. Users should be aware that past performance is not indicative of future results and should not be relied upon for making financial decisions. By using our charting tools, the purchaser agrees that the seller and the creator are not responsible for any decisions made based on the information provided by these charting tools. The purchaser assumes full responsibility and liability for any actions taken and the consequences thereof, including any loss of money or investments that may occur as a result of using these products. Hence, by purchasing these charting tools, the customer accepts and acknowledges that the seller and the creator are not liable nor responsible for any unwanted outcome that arises from the development, the sale, or the use of these products. Finally, the purchaser indemnifies the seller from any and all liability. If the purchaser was invited through the Friends and Family Program, they acknowledge that the provided discount code only applies to the first initial purchase of the Toodegrees Premium Suite subscription. The purchaser is therefore responsible for cancelling – or requesting to cancel – their subscription in the event that they do not wish to continue using the product at full retail price. If the purchaser no longer wishes to use the products, they must unsubscribe from the membership service, if applicable. We hold no reimbursement, refund, or chargeback policy. Once these Terms and Conditions are accepted by the Customer, before purchase, no reimbursements, refunds or chargebacks will be provided under any circumstances.
By continuing to use these charting tools, the user acknowledges and agrees to the Terms and Conditions outlined in this legal disclaimer.
สคริปต์แบบชำระเงิน

Best MA Pair Finder (Crossover Strategy)This indicator automatically identifies the optimal pair of moving averages (MAs) for a crossover strategy using all available historical data. It offers several MA options—including SMA, EMA, and TEMA—allowing users to select the desired type in the settings. The indicator supports two strategy modes: “Long Only” and “Buy & Sell”, which can be chosen via the options.
For each MA pair combination, the indicator performs a backtest and calculates the profit factor, considering only those pairs where the total number of trades meets or exceeds the user-defined "Minimum Trades" threshold. This parameter ensures that the selected optimal pair is based on a statistically meaningful sample rather than on a limited number of trades.
The results provided by this indicator are based on historical data and backtests, which may not guarantee future performance. Users should conduct their own analysis and use proper risk management before making trading decisions.

Daily COC Strategy with SHERLOCK WAVESThis indicator implements a unique trading strategy known as the "Daily COC (Candle Over Candle) Strategy" enhanced with "SHERLOCK WAVES" for pattern recognition. It's designed for traders looking to capitalize on specific candlestick formations with a negative risk-reward ratio, with the aim of achieving a high win rate (over 70%) through numerous trading opportunities, despite each trade having a higher risk relative to the reward.
Key Features:
Pattern Recognition: Identifies a setup based on three consecutive candles - a red candle followed by a shooting star, then an entry candle that does not break below the shooting star's low.
Negative Risk/Reward Trade Selection: Focuses on entries where the potential stop loss is greater than the take profit, banking on a high win rate to offset the individual trade's negative risk-reward ratio.
Visual Signals:
Green Label: Marks potential entry points at the high of the candle before the entry.
Green Dot: Indicates a winning trade closure.
Red Dot: Signals a losing trade closure.
Blue Circle: Warns when the current candle is within 2% of breaking above the previous candle's high, suggesting a potential setup is developing.
Green Circle: Plots the take profit level.
Red Circle: Plots the stop loss level.
Dynamic Statistics: A live updating label showing the number of trades, wins, losses, open trades, current account balance, and win percentage.
Customizable Parameters:
Risk % per Trade: Adjust the percentage of your account balance you're willing to risk on each trade.
Initial Account Balance: Set your starting balance for tracking performance.
Start Date for Strategy: Define when the strategy should start calculating from, allowing for backtesting.
Alerts:
An alert condition is set for when a potential trade setup is developing, helping traders prepare for entries.
Usage Tips:
This strategy is predicated on the idea that a high win rate can compensate for the negative risk-reward ratio of individual trades. It might not suit all market conditions or traders' risk profiles.
Use this strategy in conjunction with other analysis methods to validate trade setups.
Note: Always backtest thoroughly before applying to live markets. Consider this tool as part of a broader trading strategy, not a standalone solution. Monitor your win rate and adjust your risk management accordingly to ensure the strategy remains profitable over time.
This description now correctly explains the purpose behind the negative risk-reward ratio in the context of your trading strategy.

MA Ratio Weighted Trend System I [InvestorUnknown]The MA Ratio Weighted Trend System I combines slow and fast indicators to identify stable trends and capture potential market turning points. By dynamically adjusting the weight of fast indicators based on the Moving Average Ratio (MAR), the system aims to provide timely entry and exit signals while maintaining overall trend stability through slow indicators.
Slow and Fast Indicators with Dynamic Weighting
Slow Indicators: Designed for stable trend identification, these indicators maintain a constant weight in the overall signal calculation. They include:
DMI For Loop (Directional Movement Index)
CCI For Loop (Commodity Channel Index)
Aroon For Loop
Fast Indicators: Aim to detect rapid market changes and potential turning points. Their weights are dynamically adjusted based on the absolute value of the Moving Average Ratio (MAR). Fast indicators include:
ZLEMA For Loop (Zero-Lag Exponential Moving Average)
IIRF For Loop (Infinite Impulse Response Filter)
Dynamic Weighting Mechanism:
Moving Average Ratio (MAR) is calculated as the ratio of the price to its moving average, minus one (for simplicity and visualization).
Weight Calculation
Fast indicator weights are determined based on the absolute value of MAR, possibly with an offset to avoid scenarios where MAR follows rapid price reversals too closely:
// Function to calculate weights based on MAR
f_mar_weights(series float mar, simple int offset, simple float weight_thre) =>
o_mar = math.abs(mar )
float fast_weight = 0
float slow_weight = 1
if o_mar != 0
if weight_thre > 0
if o_mar <= weight_thre
fast_weight := o_mar
else
fast_weight := o_mar
Threshold-Based vs. Continuous Weighting:
Threshold-Based: Fast indicators receive weight only when the absolute MAR exceeds a user-defined threshold (weight_thre).
Continuous: By setting weight_thre to zero, fast indicators always receive some weight, though this may increase false signals.
Offset Mechanism
The offset parameter shifts the MAR used for weighting by a certain number of bars. This helps avoid situations where the MAR follows sudden price movements too closely, preventing fast indicators from failing to provide timely exit signals.
Signal Calculation
The final signal is a weighted average of the slow and fast indicators:
// Calculate Signal (as weighted average)
float sig = math.round(((DMI*slow_w) + (CCI*slow_w) + (Aroon*slow_w) + (ZLEMA*fast_w) + (IIRF*fast_w)) / (3*slow_w + 2*fast_w), 2)
Backtesting and Performance Metrics
Enables users to test the indicator's performance over historical data, comparing it to a buy-and-hold strategy.
Alerts
Set up alerts for when the signal crosses above or below the thresholds.
alertcondition(long_alert, "LONG (MAR Weighted Trend System)", "MAR Weighted Trend System flipped ⬆LONG⬆")
alertcondition(short_alert, "SHORT (MAR Weighted Trend System)", "MAR Weighted Trend System flipped ⬇Short⬇")
Important Notes
Customization: Due to the experimental nature of this indicator, users are strongly encouraged to adjust and calibrate the settings to align with their trading strategies and market conditions.
Default Settings Disclaimer: The default settings are not optimized or recommended for any specific use and serve only as placeholders for the indicator's publication.
Backtest Results Disclaimer: Historical backtest results are not indicative of future performance. Market conditions change, and past results do not guarantee future outcomes.
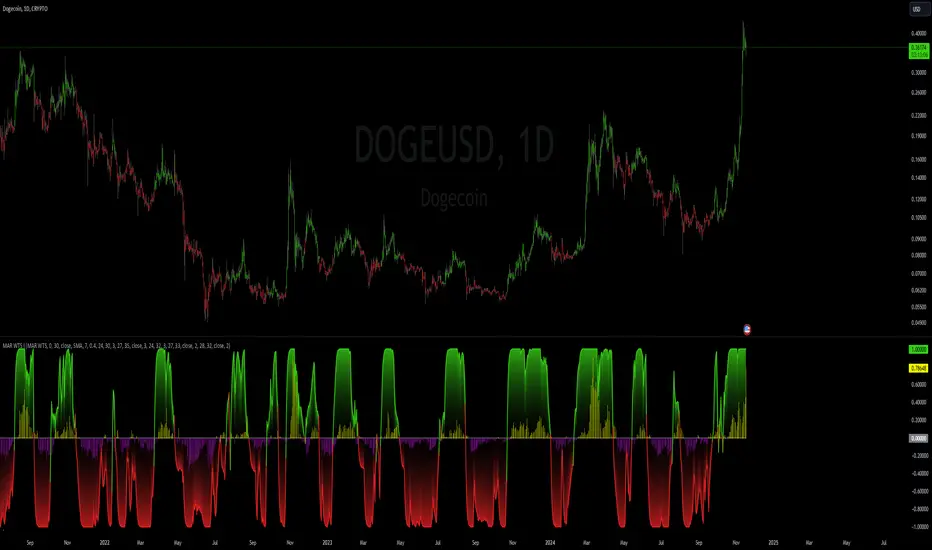
RSI 30-50-70 moving averageDescription:
The RSI 30-50-70 Moving Average indicator plots three distinct moving averages based on different RSI ranges (30%, 50%, and 70%). Each moving average corresponds to different market conditions and provides potential entry and exit signals. Here's how it works:
• RSI_30 Range (25%-35%): The moving average of closing prices when the RSI is between 25% and 35%, representing potential oversold conditions.
• RSI_50 Range (45%-55%): The moving average of closing prices when the RSI is between 45% and 55%, providing a balanced perspective for trend-following strategies.
• RSI_70 Range (65%-75%): The moving average of closing prices when the RSI is between 65% and 75%, representing potential overbought conditions.
This indicator offers flexibility, as users can adjust key parameters such as RSI ranges, periods, and time frames to fine-tune the signals for their trading strategies.
How it Works:
Like traditional moving averages, the RSI 30-50-70 Moving Averages can highlight dynamic levels of support and resistance. They offer additional insight by focusing on specific RSI ranges, providing early signals for trend reversals or continuation. The default settings can be used across various assets but should be optimized via backtesting.
Default Settings:
• RSI_30: 25% to 35% (Oversold Zone, yellow line)
• RSI_50: 45% to 55% (Neutral/Trend Zone, green line)
• RSI_70: 65% to 75% (Overbought Zone, red line)
• RSI Period: 14
Buy Conditions:
• Use the 5- or 15-minute time frame.
• Wait for the price to move below the RSI_30 line, indicating potential oversold conditions.
• Enter a buy order when the price closes above the RSI_30 line, signaling a recovery from the oversold zone.
• For a more conservative approach, use the RSI_50 line as the buy signal to confirm a trend reversal.
• Important: Before entering, ensure that the RSI_30 moving average has flattened or started to level off, signaling that the oversold momentum has slowed.
Sell Conditions:
• Use the 5- or 15-minute time frame.
• Wait for the price to close above the RSI_70 line, indicating potential overbought conditions.
• Enter a sell order when the price closes below the RSI_70 line, signaling a decline from the overbought zone.
• Important: Similar to buying, wait for the RSI_70 moving average to flatten or level off before selling, indicating the overbought conditions are stalling.
Key Features:
1. Dynamic Range Customization: The indicator allows users to modify the RSI ranges and periods, tailoring the moving averages to fit different market conditions or asset classes.
2. Trend-Following and Reversal Signals: The RSI 30-50-70 moving averages provide both reversal and trend-following signals, making it a versatile tool for short-term traders.
3. Visual Representation of Market Strength: By plotting moving averages based on RSI levels, traders can visually interpret the market’s strength and potential turning points.
4. Risk Management: The built-in flexibility allows traders to choose lower-risk entries by adjusting which RSI level (e.g., RSI_30 vs. RSI_50) they rely on for signals.
Practical Use:
Different assets respond uniquely to RSI-based moving averages, so it's recommended to backtest and adjust ranges for specific instruments. For example, volatile assets may require wider RSI ranges, while more stable assets could benefit from tighter ranges.
Checking for Buy conditions:
1st: Wait for current price to go below the RSI_30 (yellow line)
2nd: Wait and observe for bullish divergence
3rd: RSI_30 has flattened indicating potential gain of momentum after a bullish divergence.
4th: Enter a buy order when the price closed above the RSI_30, preferably when a green candle appeared.

Vasyl Ivanov | Order BlocksOrder Blocks Indicator for Long-Term Traders and Scalpers
This indicator is designed to identify order blocks (OBs) across multiple timeframes, offering flexible and adaptable detection mechanisms for both strong and weaker price movements.
Key Features:
Flexible OB Detection:
Detects order blocks with 3 candles during strong movements.
Detects order blocks with 4 candles during weaker movements.
Identifies the highest or lowest extremum between the 1st and 2nd candles to define the starting point of the OB, ensuring accuracy in ranging and trending markets.
In cases where the 2nd candle's extremum is the highest/lowest, the OB size adjusts accordingly.
Multi-Timeframe Analysis:
This indicator enables seamless multi-timeframe order block analysis, removing the need to manually switch between timeframes.
Timeframe mapping:
For intraday and lower timeframes:
< 5 min maps to 30 min
<= 15 min maps to 1 hour
<= 1 hour maps to 4 hours
All other intraday maps to 1 day
Daily charts and higher map to 1 week
This automatic adjustment lets you view both current and parent timeframe order blocks without hassle.
Customizable Backtest Analysis:
The indicator includes a "Show/Hide Overlapped Order Blocks" feature, allowing you to hide order blocks that have already been overlapped. This feature aids in backtesting and historical analysis by offering a cleaner view of how past price action interacted with detected blocks.
Color Differentiation by Timeframe:
Customize different colors for local and parent timeframes to easily differentiate order blocks from various timeframes at a glance.
Candle Wicks Customization:
The 'Use Candle Wicks' option allows you to include or exclude candle wicks in OB detection, giving you flexibility in how the blocks are drawn based on your trading style.
How It Works:
This indicator detects key price zones based on order block patterns, which are often followed by significant price moves. By analyzing these blocks across multiple timeframes, it helps traders identify potential reversal areas and support/resistance zones more effectively.
Use Cases:
Scalping: Scalpers can benefit from the rapid detection of short-term OBs to make quick decisions based on high-probability setups.
Long-Term Trading: Longer-term traders can use the multi-timeframe feature to spot higher timeframe OBs while trading lower timeframes, allowing for better alignment with major market movements.
Why It’s Unique:
Unlike other OB indicators, this one combines multi-timeframe detection with customizable OB sizing, extremum detection, and color-coding for clear differentiation between timeframes. Its backtest feature enhances historical analysis, providing a comprehensive toolkit for traders aiming to improve decision-making.
Ultimate UT Bot ScreenerWhat Does the Ultimate UT Bot Screener Do?
Ultimate UT Bot Screener will help you navigate UT Bot signals and backtest results for up to 40 instruments simultaneously. It scans the market for provided UT Bot indicator parameters, calculates essential metrics, and displays the information in 1 fully customizable table.
How Does It Work?
Market Scanning : The screener scans multiple instruments for the selected timeframe, ensuring you never miss an opportunity.
Customizable Parameters : Adjust the UT Bot parameters to fit your unique trading style and risk tolerance.
Filtering and Sorting : Use advanced filtering and sorting options to narrow down the results based on your specific criteria.
Alerts and Notifications : Set up custom alerts to stay updated on important market movements and potential trades.
Visual Customization : Tailor the screener's visual appearance to suit your preferences, making data interpretation effortless.
Currently, Ultimate UT Bot Screener Supports 13 columns:
Price - the last price of the instrument
UT Signal - last UT bot signal. Value in the square brackets ( for ex.) means how many bars ago the last signal fired.
Move To Revert —We have to observe the price move for the current bar to see the UT Bot signal change.
Revert Prob - probability estimation for UT Bot to revert for the current bar.
Trade History - the last five trade outcomes are coded as green(profit)/red(loss) squares.
Total Trades - total trades number for UT Bot strategy for the entire available history.
Current P&L - P&L for the open trade
Trade Avg P&L - Average P&L for the last X trades
Trade Prof - percent profitable trades from the last X trades
Profit Factor - profit factor the last X trades
Net Profit - total net Profit for the last X trades
Max DD - maximum drawdown for the last X trades Avg Bars in Trades - average trade duration for the last X trades
How to Use the Ultimate UT Bot Screener
Using the Ultimate UT Bot Screener is straightforward:
Set Up Your Screener : Choose the instruments you want to monitor and configure the columns to display the data most relevant to you.
Customize Parameters : Fine-tune the UT Bot parameters to align with your trading strategy. Filter and Sort: Apply filters to isolate the most promising trading opportunities and sort the results based on your priorities.
Monitor and Act: Keep an eye on the screener and act on the high-probability signals it generates. Set up alerts to ensure you never miss a critical trade.
Why Is the Ultimate UT Bot Screener Original and Worth Paying For?
Highly Customizable : our tool allows you to configure almost every element, from the set of columns and instruments to the UT Bot parameters and visual appearance.
User-Friendly Interface : Designed with traders in mind, the screener offers an intuitive interface that makes complex data easy to understand and act upon.
Time-Saving : By automating the market scanning and analysis process, it saves you valuable time and effort, allowing you to focus on executing your trades.
Real-Time Alerts : Stay ahead of the market with customizable alerts that notify you of important events and potential trades.
Disclaimer : Please remember that past performance may not be indicative of future results. Due to various factors, including changing market conditions, the strategy may no longer perform as well as in historical backtesting. This post and the script don't provide any financial advice.

Quarterly DFR [Dango]Introducing the Defining Range Indicator, a powerful tool designed to help traders identify and understand the important levels of highs, lows, and equilibrium within a selected quarterly cycle. This innovative script provides valuable insights into the key price levels that are likely to elicit a strong reaction in the market, enabling traders to make more informed decisions and enhance their trading strategies.
Key Features:
Identifies and displays the defining high, low, and equilibrium levels based on the selected quarterly cycle
Utilizes advanced algorithms to analyze price action and determine the most significant levels
Provides a visual representation of the defining range on the chart, making it easy for traders to identify potential support, resistance, and pivot points
Enables traders to backtest and understand how price has reacted to these levels in the past
How It Works:
The Defining Range Indicator employs a sophisticated algorithm to analyze price action within the selected quarterly cycle. By examining the price behavior and patterns within this timeframe, the script determines the most significant high, low, and equilibrium levels that are likely to influence future price movements.
The indicator takes into account various factors, such as price momentum, volatility, and volume, to identify the key levels that define the range. These levels are then visually represented on the chart, providing traders with a clear picture of the important price points to watch.
The Defining Range Indicator works in the following steps:
Quarterly Cycle Selection: Traders select the desired quarterly cycle timeframe (90-minute, daily, weekly, monthly, or yearly) to focus the analysis on.
High and Low Identification: The script analyzes the price action within the selected quarterly cycle to determine the most significant high and low points. These levels are considered the defining high and low of the range.
Equilibrium Calculation: The indicator calculates the equilibrium level, which represents the midpoint between the defining high and low. This level is considered a potential pivot point where price may find balance or reverse direction.
Visual Representation: The defining high, low, and equilibrium levels are plotted on the chart, providing traders with a clear visual representation of the key price levels to monitor.
Expected Usage:
The Defining Range Indicator is designed to help traders gain a better understanding of the important price levels within a selected quarterly cycle. By identifying the defining high, low, and equilibrium, traders can make more informed decisions and enhance their trading strategies.
Support and Resistance Identification: The defining high and low levels act as potential support and resistance areas. Traders can use these levels to plan their trades, set entry and exit points, and manage risk effectively.
Pivot Point Trading: The equilibrium level represents a potential pivot point where price may find balance or change direction. Traders can watch for price behavior around this level to identify potential trading opportunities.
Backtesting and Historical Analysis: The Defining Range Indicator enables traders to backtest their strategies and understand how price has reacted to the defining levels in the past. By analyzing historical price action, traders can gain valuable insights into the effectiveness of their trading approach and make necessary adjustments.
Confluence and Confirmation: Traders can use the Defining Range Indicator in conjunction with other technical analysis tools, such as the Quarterly High and Low Indicator or the Quarterly Cycles Indicator, to confirm trade setups and increase confidence in their trading decisions.
Risk Management: By understanding the location of the defining high, low, and equilibrium levels, traders can make more informed decisions about stop-loss placement and position sizing. Setting stop-losses beyond these key levels can help mitigate the risk of getting stopped out prematurely due to short-term price fluctuations.
Limitations and Disclaimer:
While the Defining Range Indicator is a valuable tool, it should not be used in isolation. Traders should combine the insights gained from this indicator with other forms of analysis, risk management, and sound trading psychology to develop a well-rounded and effective trading approach.
Please note that the indicator's accuracy may be impacted by extreme market volatility or unusual events, and the defining levels should not be relied upon in isolation. As with any trading tool, individual results may vary, and past performance does not guarantee future outcomes. Traders should always exercise caution, use appropriate risk management techniques, and continuously educate themselves to adapt to changing market conditions.
This indicator is provided for educational purposes only and should not be considered financial advice. Always conduct your own due diligence and consult with a financial professional before making any trading decisions.
Privacy of Code:
The underlying logic and specific calculations used in the Defining Range Indicator's algorithm are proprietary and not disclosed to protect the intellectual property of the script. The methods used to identify the defining high, low, and equilibrium levels are the result of extensive research, testing, and refinement. By keeping these details confidential, the script maintains its competitive edge and ensures the protection of its intellectual property.
To be Used in Pair with Quarterly Cycle Indicator

Wavelet & Fourier Smoothed Volume zone oscillator (W&)FSVZO Indicator id:
USER;e7a774913c1242c3b1354334a8ea0f3c
(only relevant to those that use API requests)
MEANINGFUL DESCRIPTION:
The Volume Zone oscillator breaks up volume activity into positive and negative categories. It is positive when the current closing price is greater than the prior closing price and negative when it's lower than the prior closing price. The resulting curve plots through relative percentage levels that yield a series of buy and sell signals, depending on level and indicator direction.
The Wavelet & Fourier Smoothed Volume Zone Oscillator (W&)FSVZO is a refined version of the Volume Zone Oscillator, enhanced by the implementation of the Discrete Fourier Transform. Its primary function is to streamline price data and diminish market noise, thus offering a clearer and more precise reflection of price trends.
By combining the Wavalet and Fourier aproximation with Ehler's white noise histogram, users gain a comprehensive perspective on volume-related market conditions.
HOW TO USE THE INDICATOR:
The default period is 2 but can be adjusted after backtesting. (I suggest 5 VZO length and NoiceR max length 8 as-well)
The VZO points to a positive trend when it is rising above the 0% level, and a negative trend when it is falling below the 0% level. 0% level can be adjusted in setting by adjusting VzoDifference. Oscillations rising below 0% level or falling above 0% level result in natural trend.
ORIGINALITY & USFULLNESS:
Personal combination of Fourier and Wavalet aproximation of a price which results in less noise Volume Zone Oscillator.
The Wavelet Transform is a powerful mathematical tool for signal analysis, particularly effective in analyzing signals with varying frequency or non-stationary characteristics. It dissects a signal into wavelets, small waves with varying frequency and limited duration, providing a multi-resolution analysis. This approach captures both frequency and location information, making it especially useful for detecting changes or anomalies in complex signals.
The Discrete Fourier Transform (DFT) is a mathematical technique that transforms discrete data from the time domain into its corresponding representation in the frequency domain. This process involves breaking down a signal into its individual frequency components, thereby exposing the amplitude and phase characteristics inherent in each frequency element.
This indicator utilizes the concept of Ehler's Universal Oscillator and displays a histogram, offering critical insights into the prevailing levels of market noise. The Ehler's Universal Oscillator is grounded in a statistical model that captures the erratic and unpredictable nature of market movements. Through the application of this principle, the histogram aids traders in pinpointing times when market volatility is either rising or subsiding.
DETAILED DESCRIPTION:
My detailed description of the indicator and use cases which I find very valuable.
What is oscillator?
Oscillators are chart indicators that can assist a trader in determining overbought or oversold conditions in ranging (non-trending) markets.
What is volume zone oscillator?
Price Zone Oscillator measures if the most recent closing price is above or below the preceding closing price.
Volume Zone Oscillator is Volume multiplied by the 1 or -1 depending on the difference of the preceding 2 close prices and smoothed with Exponential moving Average.
What does this mean?
If the VZO is above 0 and VZO is rising. We have a bullish trend. Most likely.
If the VZO is below 0 and VZO is falling. We have a bearish trend. Most likely.
Rising means that VZO on close is higher than the previous day.
Falling means that VZO on close is lower than the previous day.
What if VZO is falling above 0 line?
It means we have a high probability of a bearish trend.
Thus the indicator returns 0 when falling above 0 (or rising bellow 0) and we combine higher and lower timeframes to gauge the trend.
In the next Image you can see that trend is positive on 4h, neutral on 12h and positive on 1D. That means trend is positive.
I am sorry, the chart is a bit messy. The idea is to use the indicator over more than 1 Timeframe.
What is approximation and smoothing?
They are mathematical concepts for making a discrete set of numbers a
continuous curved line.
Fourier and Wavelet approximation of a close price are taken from aprox library.
Key Features:
You can tailor the indicator to your preferences with adjustable parameters such as VZO length, noise reduction settings, and smoothing length.
Volume Zone Oscillator (VZO) shows market sentiment with the VZO, enhanced with Exponential Moving Average (EMA) smoothing for clearer trend identification.
Noise Reduction leverages Euler's White noise capabilities for effective noise reduction in the VZO, providing a cleaner and more accurate representation of market dynamics.
Choose between the traditional Fast Fourier Transform (FFT), the innovative Double Discrete Fourier Transform (DTF32) and Wavelet soothed Fourier soothed price series to suit your analytical needs.
Image of Wavelet transform with FAST settings, Double Fourier transform with FAST settings. Improved noice reduction with SLOW settings, and standard FSVZO with SLOW settings:
Fast setting are setting by default:
VZO length = 2
NoiceR max Length = 2
Slow settings are:
VZO length = 5 or 7
NoiceR max Length = 8
As you can see fast setting are more volatile. I suggest averaging fast setting on 4h 12h 1d 2d 3d 4d W and M Timeframe to get a clear view on market trend.
What if I want long only when VZO is rising and above 15 not 0?
You have set Setting VzoDifference to 15. That reduces the number of trend changes.
Example of W&FSVZO with VzoDifference 15 than 0:
VZO crossed 0 line but not 15 line and that's why Indicator returns 0 in one case an 1 in another.
What is Smooth length setting?
A way of calculating Bullish or Bearish FSVZO.
If smooth length is 2 the trend is rising if:
rising = VZO > ta.ema(VZO, 2)
Meaning that we check if VZO is higher that exponential average of the last 2 elements.
If smooth length is 1 the trend is rising if:
rising = VZO_ > VZO_
Rising is boolean value, meaning TRUE if rising and FALSE if falling.
Mathematical equations presented in Pinescript:
Fourier of the real (x axis) discrete:
x_0 = array.get(x, 0) + array.get(x, 1) + array.get(x, 2)
x_1 = array.get(x, 0) + array.get(x, 1) * math.cos( -2 * math.pi * _dir / 3 ) - array.get(y, 1) * math.sin( -2 * math.pi * _dir / 3 ) + array.get(x, 2) * math.cos( -4 * math.pi * _dir / 3 ) - array.get(y, 2) * math.sin( -4 * math.pi * _dir / 3 )
x_2 = array.get(x, 0) + array.get(x, 1) * math.cos( -4 * math.pi * _dir / 3 ) - array.get(y, 1) * math.sin( -4 * math.pi * _dir / 3 ) + array.get(x, 2) * math.cos( -8 * math.pi * _dir / 3 ) - array.get(y, 2) * math.sin( -8 * math.pi * _dir / 3 )
Euler's Noice reduction with both close and Discrete Furrier approximated price.
w = (dft1*src - dft1 *src ) / math.sqrt(math.pow(math.abs(src- src ),2) + math.pow(math.abs(dft1 - dft1 ),2))
filt := na(filt ) ? 0 : c1 * (w*dft1 + nz(w *dft1 )) / 2.0 /math.abs(dft1 -dft1 ) + c2 * nz(filt ) - c3 * nz(filt )
Usecase:
First option:
Select the preferred version of DFT and noise reduction settings based on your analysis requirements.
Leverage the script to identify Bullish and Bearish trends, shown with green and red triangle.
Combine Different Timeframes to accurately determine market trend.
Second option:
Pull the data with API sockets to automate your trading journey.
plot(close, title="ClosePrice", display=display.status_line)
plot(open, title="OpenPrice", display=display.status_line)
plot(greencon ? 1 : redcon ? -1 : 0, title="position", display=display.status_line)
Use ClosePrice, OpenPrice and "position" titles to easily read and backtest your strategy utilising more than 1 Time Frame.
Indicator id:
USER;e7a774913c1242c3b1354334a8ea0f3c
(only relevant to those that use API requests)
