GKD-BT Baseline Backtest [Loxx]The Giga Kaleidoscope GKD-BT Baseline Backtest is a backtesting module included in Loxx's "Giga Kaleidoscope Modularized Trading System."
█ GKD-BT Baseline Backtest
The GKD-BT Baseline Backtest allows traders to backtest the Regular and Stepped baselines used in the GKD trading system. This module includes 65+ moving averages and 15+ types of volatility to choose from.
Additionally, this backtest module provides the option to test the GKD-B indicator with 1 to 3 take profits and 1 stop loss. The Trading backtest allows for the use of 1 to 3 take profits, while the Full backtest is limited to 1 take profit. The Trading backtest also offers the capability to apply a trailing take profit.
In terms of the percentage of trade removed at each take profit, this backtest module has the following hardcoded values:
Take profit 1: 50% of the trade is removed
Take profit 2: 25% of the trade is removed
Take profit 3: 25% of the trade is removed
Stop loss: 100% of the trade is removed
After each take profit is achieved, the stop loss level is adjusted. When take profit 1 is reached, the stop loss is moved to the entry point. Similarly, when take profit 2 is reached, the stop loss is shifted to take profit 1. The trailing take profit feature comes into play after take profit 2 or take profit 3, depending on the number of take profits selected in the settings. The trailing take profit is always activated on the final take profit when 2 or more take profits are chosen.
The backtest also offers the capability to restrict by a specific date range, allowing for simulated forward testing based on past data. Additionally, users have the option to display or hide a trading panel that provides relevant information about the backtest, statistics, and the current trade. It is also possible to activate alerts and toggle sections of the trading panel on or off. On the chart, historical take profit and stop loss levels are represented by horizontal lines overlaid for reference.
This backtest also includes an optional GKD-E Exit indicator that can be used to test early exits.
The GKD system utilizes volatility-based take profits and stop losses. Each take profit and stop loss is calculated as a multiple of volatility. You can change the values of the multipliers in the settings as well.
To utilize this strategy, follow these steps:
1. (Required) Import the value "Input into NEW GKD-BT Backtest" from the GKD-B Baseline indicator into the GKD-BT Baseline Backtest field "Import GKD-B Baseline"
2. (Optional) Import the value "Input into NEW GKD-BT Backtest" from the GKD-E Exit indicator into the GKD-BT Baseline Backtest field "Import GKD-E Exit". You can toggle the Exit on or off using the "Activate GKD-E Exit" option.
Baselines that are compatible with this backtest module:
GKD-B Baseline
GKD-B Stepped Baseline
Volatility Types Included
17 types of volatility are included in this indicator
Close-to-Close
Parkinson
Garman-Klass
Rogers-Satchell
Yang-Zhang
Garman-Klass-Yang-Zhang
Exponential Weighted Moving Average
Standard Deviation of Log Returns
Pseudo GARCH(2,2)
Average True Range
True Range Double
Standard Deviation
Adaptive Deviation
Median Absolute Deviation
Efficiency-Ratio Adaptive ATR
Mean Absolute Deviation
Static Percent
█ Giga Kaleidoscope Modularized Trading System
Core components of an NNFX algorithmic trading strategy
The NNFX algorithm is built on the principles of trend, momentum, and volatility. There are six core components in the NNFX trading algorithm:
1. Volatility - price volatility; e.g., Average True Range, True Range Double, Close-to-Close, etc.
2. Baseline - a moving average to identify price trend
3. Confirmation 1 - a technical indicator used to identify trends
4. Confirmation 2 - a technical indicator used to identify trends
5. Continuation - a technical indicator used to identify trends
6. Volatility/Volume - a technical indicator used to identify volatility/volume breakouts/breakdown
7. Exit - a technical indicator used to determine when a trend is exhausted
8. Metamorphosis - a technical indicator that produces a compound signal from the combination of other GKD indicators*
*(not part of the NNFX algorithm)
What is Volatility in the NNFX trading system?
In the NNFX (No Nonsense Forex) trading system, ATR (Average True Range) is typically used to measure the volatility of an asset. It is used as a part of the system to help determine the appropriate stop loss and take profit levels for a trade. ATR is calculated by taking the average of the true range values over a specified period.
True range is calculated as the maximum of the following values:
-Current high minus the current low
-Absolute value of the current high minus the previous close
-Absolute value of the current low minus the previous close
ATR is a dynamic indicator that changes with changes in volatility. As volatility increases, the value of ATR increases, and as volatility decreases, the value of ATR decreases. By using ATR in NNFX system, traders can adjust their stop loss and take profit levels according to the volatility of the asset being traded. This helps to ensure that the trade is given enough room to move, while also minimizing potential losses.
Other types of volatility include True Range Double (TRD), Close-to-Close, and Garman-Klass
What is a Baseline indicator?
The baseline is essentially a moving average, and is used to determine the overall direction of the market.
The baseline in the NNFX system is used to filter out trades that are not in line with the long-term trend of the market. The baseline is plotted on the chart along with other indicators, such as the Moving Average (MA), the Relative Strength Index (RSI), and the Average True Range (ATR).
Trades are only taken when the price is in the same direction as the baseline. For example, if the baseline is sloping upwards, only long trades are taken, and if the baseline is sloping downwards, only short trades are taken. This approach helps to ensure that trades are in line with the overall trend of the market, and reduces the risk of entering trades that are likely to fail.
By using a baseline in the NNFX system, traders can have a clear reference point for determining the overall trend of the market, and can make more informed trading decisions. The baseline helps to filter out noise and false signals, and ensures that trades are taken in the direction of the long-term trend.
What is a Confirmation indicator?
Confirmation indicators are technical indicators that are used to confirm the signals generated by primary indicators. Primary indicators are the core indicators used in the NNFX system, such as the Average True Range (ATR), the Moving Average (MA), and the Relative Strength Index (RSI).
The purpose of the confirmation indicators is to reduce false signals and improve the accuracy of the trading system. They are designed to confirm the signals generated by the primary indicators by providing additional information about the strength and direction of the trend.
Some examples of confirmation indicators that may be used in the NNFX system include the Bollinger Bands, the MACD (Moving Average Convergence Divergence), and the MACD Oscillator. These indicators can provide information about the volatility, momentum, and trend strength of the market, and can be used to confirm the signals generated by the primary indicators.
In the NNFX system, confirmation indicators are used in combination with primary indicators and other filters to create a trading system that is robust and reliable. By using multiple indicators to confirm trading signals, the system aims to reduce the risk of false signals and improve the overall profitability of the trades.
What is a Continuation indicator?
In the NNFX (No Nonsense Forex) trading system, a continuation indicator is a technical indicator that is used to confirm a current trend and predict that the trend is likely to continue in the same direction. A continuation indicator is typically used in conjunction with other indicators in the system, such as a baseline indicator, to provide a comprehensive trading strategy.
What is a Volatility/Volume indicator?
Volume indicators, such as the On Balance Volume (OBV), the Chaikin Money Flow (CMF), or the Volume Price Trend (VPT), are used to measure the amount of buying and selling activity in a market. They are based on the trading volume of the market, and can provide information about the strength of the trend. In the NNFX system, volume indicators are used to confirm trading signals generated by the Moving Average and the Relative Strength Index. Volatility indicators include Average Direction Index, Waddah Attar, and Volatility Ratio. In the NNFX trading system, volatility is a proxy for volume and vice versa.
By using volume indicators as confirmation tools, the NNFX trading system aims to reduce the risk of false signals and improve the overall profitability of trades. These indicators can provide additional information about the market that is not captured by the primary indicators, and can help traders to make more informed trading decisions. In addition, volume indicators can be used to identify potential changes in market trends and to confirm the strength of price movements.
What is an Exit indicator?
The exit indicator is used in conjunction with other indicators in the system, such as the Moving Average (MA), the Relative Strength Index (RSI), and the Average True Range (ATR), to provide a comprehensive trading strategy.
The exit indicator in the NNFX system can be any technical indicator that is deemed effective at identifying optimal exit points. Examples of exit indicators that are commonly used include the Parabolic SAR, the Average Directional Index (ADX), and the Chandelier Exit.
The purpose of the exit indicator is to identify when a trend is likely to reverse or when the market conditions have changed, signaling the need to exit a trade. By using an exit indicator, traders can manage their risk and prevent significant losses.
In the NNFX system, the exit indicator is used in conjunction with a stop loss and a take profit order to maximize profits and minimize losses. The stop loss order is used to limit the amount of loss that can be incurred if the trade goes against the trader, while the take profit order is used to lock in profits when the trade is moving in the trader's favor.
Overall, the use of an exit indicator in the NNFX trading system is an important component of a comprehensive trading strategy. It allows traders to manage their risk effectively and improve the profitability of their trades by exiting at the right time.
What is an Metamorphosis indicator?
The concept of a metamorphosis indicator involves the integration of two or more GKD indicators to generate a compound signal. This is achieved by evaluating the accuracy of each indicator and selecting the signal from the indicator with the highest accuracy. As an illustration, let's consider a scenario where we calculate the accuracy of 10 indicators and choose the signal from the indicator that demonstrates the highest accuracy.
The resulting output from the metamorphosis indicator can then be utilized in a GKD-BT backtest by occupying a slot that aligns with the purpose of the metamorphosis indicator. The slot can be a GKD-B, GKD-C, or GKD-E slot, depending on the specific requirements and objectives of the indicator. This allows for seamless integration and utilization of the compound signal within the GKD-BT framework.
How does Loxx's GKD (Giga Kaleidoscope Modularized Trading System) implement the NNFX algorithm outlined above?
Loxx's GKD v2.0 system has five types of modules (indicators/strategies). These modules are:
1. GKD-BT - Backtesting module (Volatility, Number 1 in the NNFX algorithm)
2. GKD-B - Baseline module (Baseline and Volatility/Volume, Numbers 1 and 2 in the NNFX algorithm)
3. GKD-C - Confirmation 1/2 and Continuation module (Confirmation 1/2 and Continuation, Numbers 3, 4, and 5 in the NNFX algorithm)
4. GKD-V - Volatility/Volume module (Confirmation 1/2, Number 6 in the NNFX algorithm)
5. GKD-E - Exit module (Exit, Number 7 in the NNFX algorithm)
6. GKD-M - Metamorphosis module (Metamorphosis, Number 8 in the NNFX algorithm, but not part of the NNFX algorithm)
(additional module types will added in future releases)
Each module interacts with every module by passing data to A backtest module wherein the various components of the GKD system are combined to create a trading signal.
That is, the Baseline indicator passes its data to Volatility/Volume. The Volatility/Volume indicator passes its values to the Confirmation 1 indicator. The Confirmation 1 indicator passes its values to the Confirmation 2 indicator. The Confirmation 2 indicator passes its values to the Continuation indicator. The Continuation indicator passes its values to the Exit indicator, and finally, the Exit indicator passes its values to the Backtest strategy.
This chaining of indicators requires that each module conform to Loxx's GKD protocol, therefore allowing for the testing of every possible combination of technical indicators that make up the six components of the NNFX algorithm.
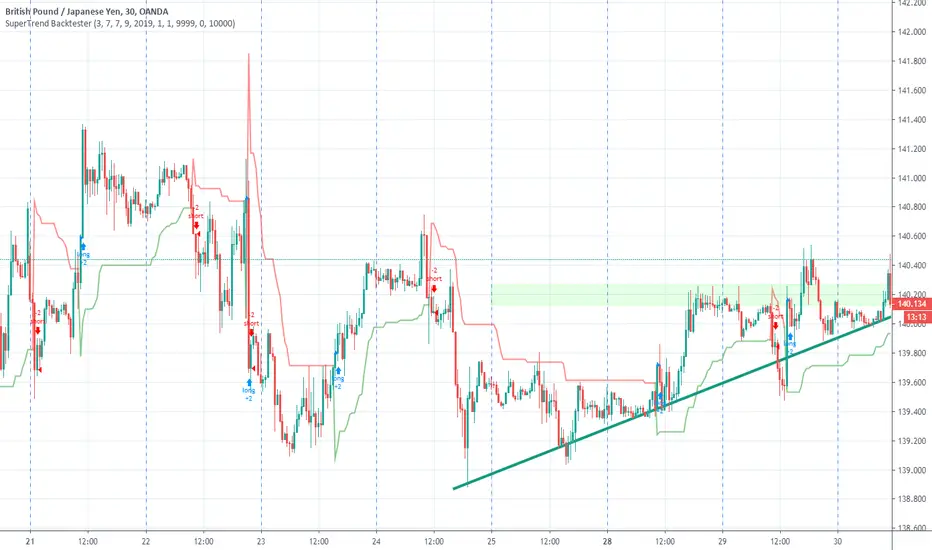
What does the application of the GKD trading system look like?
Example trading system:
Backtest: GKD-BT Baseline Backtest as shown on the chart above
Baseline: Hull Moving Average as shown on the chart above
Volatility/Volume: Hurst Exponent
Confirmation 1: Sherif's HiLo
Confirmation 2: uf2018
Continuation: Coppock Curve
Exit: Fisher Transform as shown on the chart above
Metamorphosis: Baseline Optimizer
Each GKD indicator is denoted with a module identifier of either: GKD-BT, GKD-B, GKD-C, GKD-V, GKD-M, or GKD-E. This allows traders to understand to which module each indicator belongs and where each indicator fits into the GKD system.
█ Giga Kaleidoscope Modularized Trading System Signals
Standard Entry
1. GKD-C Confirmation gives signal
2. Baseline agrees
3. Price inside Goldie Locks Zone Minimum
4. Price inside Goldie Locks Zone Maximum
5. Confirmation 2 agrees
6. Volatility/Volume agrees
1-Candle Standard Entry
1a. GKD-C Confirmation gives signal
2a. Baseline agrees
3a. Price inside Goldie Locks Zone Minimum
4a. Price inside Goldie Locks Zone Maximum
Next Candle
1b. Price retraced
2b. Baseline agrees
3b. Confirmation 1 agrees
4b. Confirmation 2 agrees
5b. Volatility/Volume agrees
Baseline Entry
1. GKD-B Baseline gives signal
2. Confirmation 1 agrees
3. Price inside Goldie Locks Zone Minimum
4. Price inside Goldie Locks Zone Maximum
5. Confirmation 2 agrees
6. Volatility/Volume agrees
7. Confirmation 1 signal was less than 'Maximum Allowable PSBC Bars Back' prior
1-Candle Baseline Entry
1a. GKD-B Baseline gives signal
2a. Confirmation 1 agrees
3a. Price inside Goldie Locks Zone Minimum
4a. Price inside Goldie Locks Zone Maximum
5a. Confirmation 1 signal was less than 'Maximum Allowable PSBC Bars Back' prior
Next Candle
1b. Price retraced
2b. Baseline agrees
3b. Confirmation 1 agrees
4b. Confirmation 2 agrees
5b. Volatility/Volume agrees
Volatility/Volume Entry
1. GKD-V Volatility/Volume gives signal
2. Confirmation 1 agrees
3. Price inside Goldie Locks Zone Minimum
4. Price inside Goldie Locks Zone Maximum
5. Confirmation 2 agrees
6. Baseline agrees
7. Confirmation 1 signal was less than 7 candles prior
1-Candle Volatility/Volume Entry
1a. GKD-V Volatility/Volume gives signal
2a. Confirmation 1 agrees
3a. Price inside Goldie Locks Zone Minimum
4a. Price inside Goldie Locks Zone Maximum
5a. Confirmation 1 signal was less than 'Maximum Allowable PSVVC Bars Back' prior
Next Candle
1b. Price retraced
2b. Volatility/Volume agrees
3b. Confirmation 1 agrees
4b. Confirmation 2 agrees
5b. Baseline agrees
Confirmation 2 Entry
1. GKD-C Confirmation 2 gives signal
2. Confirmation 1 agrees
3. Price inside Goldie Locks Zone Minimum
4. Price inside Goldie Locks Zone Maximum
5. Volatility/Volume agrees
6. Baseline agrees
7. Confirmation 1 signal was less than 7 candles prior
1-Candle Confirmation 2 Entry
1a. GKD-C Confirmation 2 gives signal
2a. Confirmation 1 agrees
3a. Price inside Goldie Locks Zone Minimum
4a. Price inside Goldie Locks Zone Maximum
5a. Confirmation 1 signal was less than 'Maximum Allowable PSC2C Bars Back' prior
Next Candle
1b. Price retraced
2b. Confirmation 2 agrees
3b. Confirmation 1 agrees
4b. Volatility/Volume agrees
5b. Baseline agrees
PullBack Entry
1a. GKD-B Baseline gives signal
2a. Confirmation 1 agrees
3a. Price is beyond 1.0x Volatility of Baseline
Next Candle
1b. Price inside Goldie Locks Zone Minimum
2b. Price inside Goldie Locks Zone Maximum
3b. Confirmation 1 agrees
4b. Confirmation 2 agrees
5b. Volatility/Volume agrees
Continuation Entry
1. Standard Entry, 1-Candle Standard Entry, Baseline Entry, 1-Candle Baseline Entry, Volatility/Volume Entry, 1-Candle Volatility/Volume Entry, Confirmation 2 Entry, 1-Candle Confirmation 2 Entry, or Pullback entry triggered previously
2. Baseline hasn't crossed since entry signal trigger
4. Confirmation 1 agrees
5. Baseline agrees
6. Confirmation 2 agrees
ค้นหาในสคริปต์สำหรับ "backtest"

WhaleCrew BacktesterBacktesting indicators is easy , just add the following line of code to your script:
plot(longEntry ? 1 : shortEntry ? -1 : longTP ? 0.5 : shortTP ? -0.5 : 0, color=na, editable=false, title='Backtest')
These numbers are defined as constants in the backtester source-code.
After adding this indicator to your chart:
1. Open Settings
2. Select supported indicator to backtest
3. Select if you want to enter Longs and/or Shorts
4. Open the 'Strategy Tester' at the bottom to check the performance
Remember:
past performance is not indicative of future results
repainting indicators will create wrong/unrealistic results

AstraAlgo BacktesterOVERVIEW
The AstraAlgo Backtester allows traders to simulate and evaluate trading strategies directly on TradingView. By simulating trades across different timeframes and markets, it provides valuable insights into win rates, drawdowns, and overall strategy effectiveness.
SIGNAL MODES
Signal Modes generate proprietary trade signals based on live price data. Users can choose between Off, Basic, Advanced, or Custom modes to evaluate strategies under different conditions and refine their trading approach.
ADJUSTABLE BACKTESTING
Parameters for historical simulations can be customized to test different market conditions and trading scenarios. This allows traders to measure strategy performance, including win rate, profit/loss, and risk/reward ratios, helping refine and optimize strategies before live execution.
BAR COLORING
Bar Coloring highlights bullish and bearish bars on historical charts, allowing traders to visually assess trend direction and trade outcomes during backtesting. This makes it easier to analyze momentum and strategy effectiveness at a glance.
ASTRA CLOUD
Astra Cloud overlays dynamic support and resistance levels on live price data. These zones adapt automatically to past market movements, helping traders identify areas where trades would have reacted, aiding strategy evaluation and optimization.

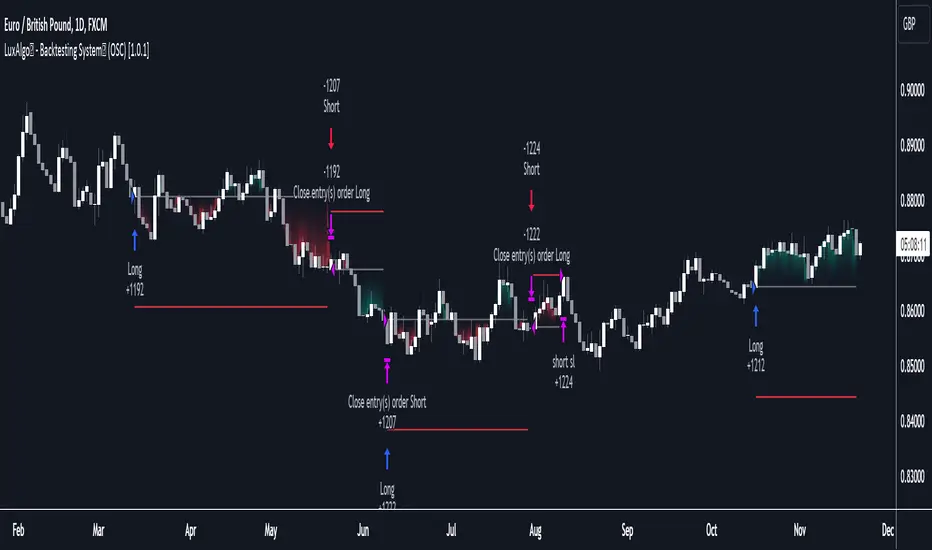
LuxAlgo - Backtester (OSC)The OSC Backtester is an innovative strategy script that allows users to create a wide variety of strategies using various unique oscillators.
By utilizing our 'Step' and 'Match' algorithms, users can create custom and complex strategy entries from each of the supported oscillators and included conditions, as well as any external sources, allowing users to create entries from a sequence of conditions and/or multiple matching conditions.
We included a complete alert system that will send a notification for each action taken by the strategy and we also allow users to set custom messages for each action taken by a strategy.
🔶 Features
🔹 Step & Match Algorithm
More complex entry rules can be created by using multiple conditions together, this is done thanks to the Step dropdown setting on the right of each condition.
The Step setting is directly related to the Step & Match algorithm and works in two ways:
When two or more conditions have the same step number, both conditions are evaluated. Used to test matching conditions.
When two or more conditions have different step numbers, each conditions will be evaluated in order, testing for the first step and switching to the next step once the previous one is true. When the final step is true the strategy will open a market order. Used to create sequence of conditions.
This operation is complementary, as you can create a sequence of conditions with one step consisting of two or more matching conditions as long as they have the same step number.
🔹 Fully Customizable Entries From Various Oscillators And Conditions
We allow the users to set entries using our unique HyperWave, Smart Money Flow, and their derived conditions as entries.
The Hyper Wave is a normalized adaptive oscillator aiming to reflect price trends without returning a high amount of noise.
The Smart Money Flow aims to detect trends based on market activity, by doing a comparative analysis between current volume and historical volume. A Smart Money Flow above 50 suggest market participants are bullish, else bearish. Derived from this oscillator we have Overflow indications, this indicator detects when market is overbought or oversold based on participants activity.
Other entries include proprietary reversal signals, real-time divergence detection, oscillator confluence (indicating how aligned each oscillator is), as well as entries using external sources.
🔹 Complete Alert System
Users can get alerted for any action executed by a strategy, from opening positions to closing them.
The message field in the Alert Messages setting section allows for the strategy to send a custom alert message depending on the action taken by the strategy, if no messages are set the strategy will send default messages.
🔶 Usage
Users can create a wide variety of strategies from this script, whether they are trend-following or contrarian traders.
Let's see a contrarian (revesal-based) strategy example using the following entry conditions:
Long: Hyperwave bullish divergence and oversold Hyperwave (lower than 20).
Short: Hyperwave bearish divergence and overbought Hyperwave (greater than 20).
We can also introduce take-profit and stop-loss exit conditions based on external indicators, allowing more control over exits in our strategy. For example:
Long: Hyperwave crossing over 50 while money flow is bearish.
Short: Hyperwave crossing under 50 while money flow is bullish.
Exit Long on a profit (long exit tp): Hyperwave crossing 80.
Exit Short on a profit (short exit tp): Hyperwave crossing 20.
While this strategy script can be used as a standalone, we recommend using other indicators creatively to assist with entries and exits as well as TP/SLs.
Our Step & Match algorithm can magnify interoperability, allowing for way more complete strategies through complex conditions, let's demonstrate this using the following entries:
Long: Any bullish reversal occurring after the price crosses over the lowest upper reversal zone of the Signals & Overlays™.
Short: Any bearish reversal occurring after the price crosses under the highest lower reversal zone of the Signals & Overlays™.
Long TP/SL: 5 ATR's away from the entry price.
Short TP/SL: 5 ATR's away from the entry price.
🔶 Strategy Properties (Important)
This script backtest is done on daily EURGBP, using the following backtesting properties:
Balance (default): 10 000 (default base currency)
Order Size: 10% of the equity
Comission: 3.4 pips (average spread for EURGBP)
Slippage: 3 tick
Stop Loss: 0.02 points away from entry price
We use these properties to ensure a realistic preview of the backtesting system, do note that default properties can be different for various reasons described below:
Order Size: 1 contract by default, this is to allow the strategy to run properly on most instruments such as futures.
Comission: Comission can vary depending on the market and instrument, there is no default value that might return realistic results.
We strongly recommend all users to ensure they adjust the Properties within the script settings to be in line with their accounts & trading platforms of choice to ensure results from the strategies built are realistic.
🔶 How To Access
You can see the Author's Instructions below to learn how to get access.
Strategy BackTest Display Statistics - TraderHalaiThis script was born out of my quest to be able to display strategy back test statistics on charts to allow for easier backtesting on devices that do not natively support backtest engine (such as mobile phones, when I am backtesting from away from my computer). There are already a few good ones on TradingView, but most / many are too complicated for my needs.
Found an excellent display backtest engine by 'The Art of Trading'. This script is a snippet of his hard work, with some very minor tweaks and changes. Much respect to the original author.
Full credit to the original author of this script. It can be found here: www.tradingview.com
I decided to modify the script by simplifying it down and make it easier to integrate into existing strategies, using simple copy and paste, by relying on existing tradingview strategy backtester inputs. I have also added 3 additional performance metrics:
- Max Run Up
- Average Win per trade
- Average Loss per trade
As this is a work in progress, I will look to add in more performance metrics in future, as I further develop this script.
Feel free to use this display panel in your scripts and strategies.
Thanks and enjoy :)

[MT] Strategy Backtest Template| Initial Release | | EN |
An update of my old script, this script is designed so that it can be used as a template for all those traders who want to save time when programming their strategy and backtesting it, having functions already programmed that in normal development would take you more time to program, with this template you can simply add your favorite indicator and thus be able to take advantage of all the functions that this template has.
🔴Stop Loss and 🟢Take Profit:
No need to mention that it is a Stop Loss and a Take Profit, within these functions we find the options of: fixed percentage (%), fixed price ($), ATR, especially for Stop Loss we find the Pivot Points, in addition to this, the price range between the entry and the Stop Loss can be converted into a trailing stop loss, instead, especially for the Take Profit we have an option to choose a 1:X ratio that complements very well with the Pivot Points.
📈Heikin Ashi Based Entries:
Heikin Ashi entries are trades that are calculated based on Heikin Ashi candles but their price is executed to Japanese candles, thus avoiding false results that occur in Heikin candlestick charts, this making in certain cases better results in strategies that are executed with this option compared to Japanese candlesticks.
📊Dashboard:
A more visual and organized way to see the results and necessary data produced by our strategy, among them we can see the dates between which our operations are made regardless if you have activated some time filter, usual data such as Profit, Win Rate, Profit factor are also displayed in this panel, additionally data such as the total number of operations, how many were gains and how many losses, the average profit and loss for each operation and finally the maximum profits and losses followed, which are data that will be very useful to us when we elaborate our strategies.
Feel free to use this template to program your own strategies, if you find errors or want to request a new feature let me know in the comments or through my social networks found in my tradingview profile.
| Update 1.1 | | EN |
➕Additions: '
Time sessions filter and days of the week filter added to the time filter section.
Option to add leverage to the strategy.
5 Moving Averages, RSI, Stochastic RSI, ADX, and Parabolic Sar have been added as indicators for the strategy.
You can choose from the 6 available indicators the way to trade, entry alert or entry filter.
Added the option of ATR for Take Profit.
Ticker information and timeframe are now displayed on the dashboard.
Added display customization and color customization of indicator plots.
Added customization of display and color plots of trades displayed on chart.
📝Changes:
Now when activating the time filter it is optional to add a start or end date and time, being able to only add a start date or only an end date.
Operation plots have been changed from plot() to line creation with line.new().
Indicator plots can now be controlled from the "plots" section.
Acceptable and deniable range of profit, winrate and profit factor can now be chosen from the "plots" section to be displayed on the dashboard.
Aesthetic changes in the section separations within the settings section and within the code itself.
The function that made the indicators give inputs based on heikin ashi candles has been changed, see the code for more information.
⚙️Fixes:
Dashboard label now projects correctly on all timeframes including custom timeframes.
Removed unnecessary lines and variables to take up less code space.
All code in general has been optimized to avoid the use of variables, unnecessary lines and avoid unnecessary calculations, freeing up space to declare more variables and be able to use fewer lines of code.
| Lanzamiento Inicial | | ES |
Una actualización de mi antiguo script, este script está diseñado para que pueda ser usado como una plantilla para todos aquellos traders que quieran ahorrar tiempo al programar su estrategia y hacer un backtesting de ella, teniendo funciones ya programadas que en el desarrollo normal te tomaría más tiempo programar, con esta plantilla puedes simplemente agregar tu indicador favorito y así poder aprovechar todas las funciones que tiene esta plantilla.
🔴Stop Loss y 🟢Take Profit:
No hace falta mencionar que es un Stop Loss y un Take Profit, dentro de estas funciones encontramos las opciones de: porcentaje fijo (%), precio fijo ($), ATR, en especial para Stop Loss encontramos los Pivot Points, adicionalmente a esto, el rango de precio entre la entrada y el Stop Loss se puede convertir en un trailing stop loss, en cambio, especialmente para el Take Profit tenemos una opción para elegir un ratio 1:X que se complementa muy bien con los Pivot Points.
📈Entradas Basadas en Heikin Ashi:
Las entradas Heikin Ashi son operaciones que son calculados en base a las velas Heikin Ashi pero su precio esta ejecutado a velas japonesas, evitando así́ los falsos resultados que se producen en graficas de velas Heikin, esto haciendo que en ciertos casos se obtengan mejores resultados en las estrategias que son ejecutadas con esta opción en comparación con las velas japonesas.
📊Panel de Control:
Una manera más visual y organizada de ver los resultados y datos necesarios producidos por nuestra estrategia, entre ellos podemos ver las fechas entre las que se hacen nuestras operaciones independientemente si se tiene activado algún filtro de tiempo, datos usuales como el Profit, Win Rate, Profit factor también son mostrados en este panel, adicionalmente se agregaron datos como el número total de operaciones, cuantos fueron ganancias y cuantos perdidas, el promedio de ganancias y pérdidas por cada operación y por ultimo las máximas ganancias y pérdidas seguidas, que son datos que nos serán muy útiles al elaborar nuestras estrategias.
Siéntete libre de usar esta plantilla para programar tus propias estrategias, si encuentras errores o quieres solicitar una nueva función házmelo saber en los comentarios o a través de mis redes sociales que se encuentran en mi perfil de tradingview.
| Actualización 1.1 | | ES |
➕Añadidos:
Filtro de sesiones de tiempo y filtro de días de la semana agregados al apartado de filtro de tiempo.
Opción para agregar apalancamiento a la estrategia.
5 Moving Averages, RSI, Stochastic RSI, ADX, y Parabolic Sar se han agregado como indicadores para la estrategia.
Puedes escoger entre los 6 indicadores disponibles la forma de operar, alerta de entrada o filtro de entrada.
Añadido la opción de ATR para Take Profit.
La información del ticker y la temporalidad ahora se muestran en el dashboard.
Añadido personalización de visualización y color de los plots de indicadores.
Añadido personalización de visualización y color de los plots de operaciones mostradas en grafica.
📝Cambios:
Ahora al activar el filtro de tiempo es opcional añadir una fecha y hora de inicio o fin, pudiendo únicamente agregar una fecha de inicio o solamente una fecha de fin.
Los plots de operaciones han cambiados de plot() a creación de líneas con line.new().
Los plots de indicadores ahora se pueden controlar desde el apartado "plots".
Ahora se puede elegir el rango aceptable y negable de profit, winrate y profit factor desde el apartado "plots" para mostrarse en el dashboard.
Cambios estéticos en las separaciones de secciones dentro del apartado de configuraciones y dentro del propio código.
Se ha cambiado la función que hacía que los indicadores dieran entradas en base a velas heikin ashi, mire el código para más información.
⚙️Arreglos:
El dashboard label ahora se proyecta correctamente en todas las temporalidades incluyendo las temporalidades personalizadas.
Se han eliminado líneas y variables innecesarias para ocupar menos espacio en el código.
Se ha optimizado todo el código en general para evitar el uso de variables, líneas innecesarias y evitar los cálculos innecesarios, liberando espacio para declarar más variables y poder utilizar menos líneas de código.

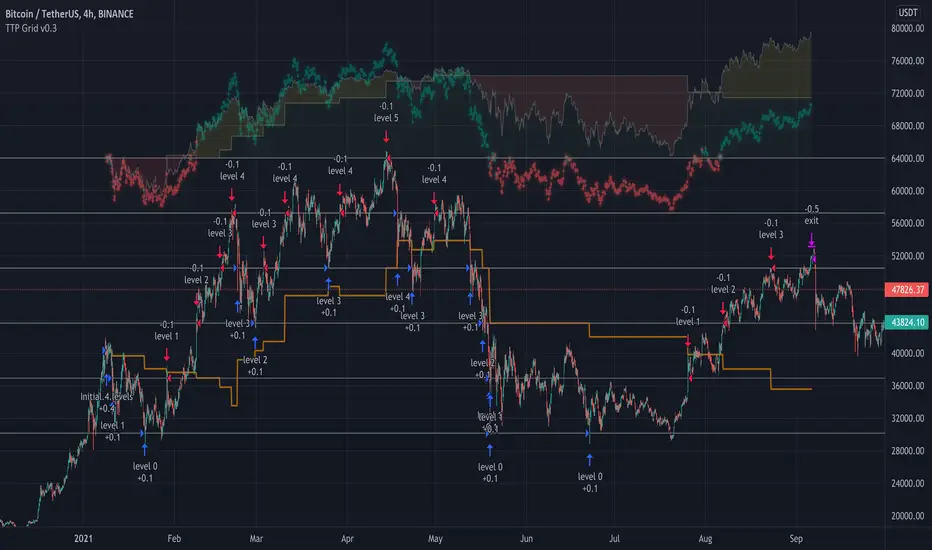
TTP Grid BacktesterThis pine script strategy allows to backtest Grid bots.
This initial version offers the following features:
- Set the top and bottom limits of the grid
- Plots the average position price, realised and unrealised profits
- Set the value to invest
- This script is a strategy so you can check each individual buy/sell, stats and all included with strategies
What does it do:
- Depending where is located the initial close price relative to the grid (above, below, inside) it will buy for as many levels are above the price.
- It will disable a level that recently filled an order (in the way grids bot do)
- When the grid starts it will disable the closest grid level
- It places limit orders in the active levels and many levels can be filled in a single candle
- You can activate recalculate on each order filled, which will allow to fill further needed orders if the price swings up and down crossing multiple times multiple grid levels but I have found that doing this can compromise the accuracy of the price used on those levels (there are minor gaps between the filled price and the original level price)
How to use it:
- When you add this strategy to the chart you will be asked to select the top and bottom limits of the grid
- Notice you can always select the strategy in the chart and drag and drop the limits to adjust the grid
- Once the grid is in place, you can use either lower chart timeframes for higher accuracy of the stats, or higher timeframes if you want to privilege longer periods of testing
How to set the correct "initial capital"
In order to prevent getting wrong stats you need to make sure you are using the correct initial capital. If you put less than what you are actually using your results will be over inflated. If you set an initial capital below what the bot requires, your results will be smaller than they should.
- If you want to use exactly 100% of the capital for the grid use then first select what amount per level you want to use. Set this value in the settings of the indicator (if you are trading BTCUSD pair, how much BTC you want to use per level, 0.01 for example).
- Once you have set this value, then open the TradingView "Data Window" to be able to visualise the calculation of cash required to run the grid that the strategy is giving you. In our example with BTCUSD this value will be given in USD.
- Enter this amount in the "Properties" tab, "Initial Capital". If you enter the exact amount you will be using all for the grid usage.
- The grid first action will be to buy 0.01 for each level that is above the current price in the first candle of the chart. If there are no levels above it won't do any initial investment.
- The rest of the cash will be use to buy levels below if the price goes to the lower range of the grid later
Intention of this script
I built this script to help me understand better how grid bots work.
Understanding the flow of realised vs unrealised profits in a grid can help me understand why sometimes even if you are in red on unrealised profits, you can still compensate with realised profits and many other tricky scenarios with grids.
Sometimes I'm running a grid bot and would like to simulate how much better (or worst) it would have been to run it using different limits.
Future work and ideas
Initially I'm focusing on confirming that the grid behaves correctly and that the stats are as accurate as possible.
That is the first priority.
Once I feel more confident with the accuracy I will consider adding some of the following ideas (not in any particular order):
- Table with stats including: price of each level, times the level filled an order, times it was use for selling/buying, etc. Time it took to become in realised profit. Comparison against profits from buy & hold.
- Trailing TP/SL
- Entry/exit price
- Trading time window: only trade between the specified dates/times
- Alerts
Zendog Backtest-DCA-Bot-3commasHi everyone,
This is a strategy that serves as a basic Backtester for 3commas DCA bots.
You can plugin your own studies into the Backtester, play around with their parameters as well with the DCA parameters and see how they can provide best result on historical data.
Features:
- Meaningful statistics that actually group orders under the same deal.
(base order + safety orders are the same deal, but Tradingview Strategy Tester shows them as separate trades)
See how many safety orders were used for each deal.
- Deal start condition: built in RSI-7 or external indicator
(main purpose of this strategy is to connect your own studies, so using external indicator is recommended)
- Base order and safety orders configs similar to 3commas
(order size, percent deviation, safety orders, percent scale and volume scale)
- Support for Long strategy for now (plan to add Short)

xGhozt Consecutive Candle Count - BacktestxGhozt Consecutive Candle Count with Backtest simply counts consecutive positive or negative candles, and allows you to get the live statistics of how many times this consecutive candle series occurred in the past, with the probabilities of the next candle to be a reversal, and the average past gains from that reversal. You can select the number of consecutive candles you're tracking, and select a start and end date. When your desired pattern is met by the indicator, it will indicate you on the chart if it's worth shorting or longing the next candle.
You also have the possibility to set up alerts when your consecutive candles patterns are met. To do so, go into the indicator's settings, select your time frame, the consecutive number of candles you are tracking, your success rate, and the number this pattern occurred in the past. Once it's done, open the alerts box, and set up your alerts accordingly.
You will have 2 options:
- Green Candles Followed by Red = short next candle.
- Red Candles Followed by Green = long next candle
Now that the backtest is added, you can try different combinations and figure the best outcome to get the best returns!
One thing to note with the backtest: you cannot run the backtest with take profits / stop loss AND candle closing, it has to be one of the two.

Cyato Grid Basic Buy & Sell [BACKTEST]Private indicator
This Grid bot strategy creates buy orders when the price goes down one level or more, and sell order when the price goes up one level or more.
To avoid useless trades, the lastest traded level is disabled until another level is crossed.
To create the grid, one upper level and one lower level is calculated. Those 2 levels are either given by the user using "MANUAL" mode or automatically calculated by an AI. The space between these two levels are then divided equally into several steps, creating the grid. The number of steps is chosen by the user, from 3 to 20.
HOW IT WORKS
This is the Backtest version meaning this is the one you should use with the Strategy Tester (more below).
Select either "MANUAL" or "AI" mode.
When using "MANUAL", you have to configure an upper level and a lower level.
When using "AI", the upper and lower level are automatically calculated from last 7 days high/low plus a 3% deviation. You can configure the timeframe and the deviation.
Select the grid quantity, from 3 to 20.
Example with 3:
Example with 10:
Example with 20:
You can choose between "Once Per Bar Close" or "Once Per Bar" alert type.
"Once Per Bar Close" will wait candle close to confirm a trade.
"Once Per Bar" will trigger a trade if the price crossed a step anytime inside a candle. Note that the backtest will still use bar close price in its calculation.
BACKTESTING
The strategy will buy 1 contract when a BUY signal appears and sell 1 contract when a SELL signal appears.
Here 1 contract = 1 BTC
The strategy can buy up to 20 contracts. Pyramiding is enabled.
The Backtest info panel is here to show how many trades are open in the backtest.
I know very well that a backtest has no value if several trades are left open. That is why I coded a feature to close all open trades at once on the last candle. This feature can be turned on and off.
To get this indicator, use the link in my signature below, thanks!

Zendog V2 backtest DCA bot 3commasHi everyone,
After a few iterations and additional implemented features this version of the Backtester is now open source.
The Strategy is a Backtester for 3commas DCA bots. The main usage scenario is to plugin your external indicator, and backtest it using different DCA settings.
Before using this script please make sure you read these explanations and make sure you understand how it works.
Features:
- Because of Tradingview limitations on how orders are grouped into Trades, this Strategy statistics are calculated by the script, so please ignore the Strategy Tester statistics completely
Statistics Table explained:
- Status: either all deals are closed or there is a deal still running, in which case additional info
is provided below, as when the deal started, current PnL, current SO
- Finished deals: Total number of closed deals both Winning and Losing.
A deal is comprised as the Base Order (BO) + all Safety Orders (SO) related to that deal, so this number
will be different than the Strategy Tester List of Trades
- Winning Deals: Deal ended in profit
- Losing deals: Deals ended with loss due to Stop Loss. In the future I might add a Deal Stop condition to
the script, so that will count towards this number as well.
- Total days ( Max / Avg days in Deal ):
Total Days in the Backtest given by either Tradingview limitation on the number of candles or by the
config of the script regarding "Limit Date Range".
Max Days spent in a deal + which period this happened.
Avg days spent in a deal.
- Required capital: This is the total capital required to run the Backtester and it is automatically calculated by
the script taking into consideration BO size, SO size, SO volume scale. This should be the same as 3commas.
This number overwrites strategy.initial_capital and is used to calculate Profit and other stats, so you don't need
to update strategy.initial_capital every time you change BO/SO settings
- Profit after commission
- Buy and Hold return: The PnL that could have been obtained by buying at the close of the first candle of the
backtester and selling at the last.
- Covered deviation: The % of price move from initial BO order covered by SO settings
- Max Deviation: Biggest market % price move vs BO price, in the other direction (for long
is down, for short it is up)
- Max Drawdown: Biggest market % price move vs Avg price of the whole Trade (BO + any SO), in the other
direction (for long price goes down, for short it goes up)
This is calculated for the whole Trade so it is different than List of Trades
- Max / Avg bars in deal
- Total volume / Commission calculated by the strategy. For correct commission please set Commission in the
Inputs Tab and you may ignore Properties Tab
- Close stats for deals: This is a list of how many Trades were closed at each step, including Stop Loss (if
configured), together with covered deviation for that step, the number of deals, and the percentage of this
number from all the deals
TODO: Might add deal avg value for each step
- Settings Table that can be enabled / disabled just to have an overview of your configs on the chart, this is a
drawn on bottom left
- Steps Table similar to 3commas, this is also drawn on bottom left, so please disable Settings table if you want
to see this one
TODO: Might add extra stats here
- Deal start condition: built in RSI-7 or plugin any external indicator and compare with any value the indicator plots
(main purpose of this strategy is to connect your own studies, so using external indicator is recommended)
- Base order and safety orders configs similar to 3commas (order size, percent deviation, safety orders,
percent scale and volume scale)
- Long and Short
- Stop Loss
- Support for Take profit from base order or from Total volume of the deal
- Configs help (besides self explanatory):
- Chart theme: Adjust according to the theme you run on. There is no way to detect theme at the moment.
This adjust different colors
- Deal Start Type: Either a builtin RSI7 or "External indicator"
- Indicator Source an value: If using External Indicator then select source, comparison and value.
For example you could start a deal when Volume is greater than xxxx, or code a custom indicator that plots
different values based on your conditions and test those values
- Visuals / Decimals for display: Adjust according to your symbol
- BO Entry Price for steps table: This is the BO start deal price used to calculate the steps in the table

TBO Backtesting StrategyThe TBO Backtesting Strategy is the TBO Indicator equivalent but gives you the ability to backtest data on different charts.
How Does This Work?
You will initially see the original settings for the TBO, those are unchanged and will feel familiar. Below that is where the backtesting options come into play.
There are two sections: BUY & SELL
BUY
Checking a buy option means you are now including that buy trigger as an additional BUY signal. If you have LONG checked, then only the TBO LONG signal will be sent to open a buy order. Likewise, if you have LONG and CLOSE SHORT checked, both of those will be sending buy orders in the backtest.
SELL
The SELL section offers the ability to toggle sell orders. Additionally, you are able to specify what KIND of relationship it has with the buy orders. By default, each sell order has a direct relationship to its counterpart buy signal:
Example 1:
BUY: LONG Signal
SELL: SHORT Signal || Mapping: "Long" || Result: Will close LONG orders
Example 2:
BUY: CLOSE SHORT Signal
SELL: TBO SELL Signal || Mapping: "CLOSE SHORT" || Result: Will close CLOSE SHORT orders
Example 3:
BUY: LONG Signal
BUY: CLOSE SHORT Signal
SELL: TBO Sell || Mapping: "Long" || Result: Will close LONG orders
SELL: SHORT Signal || Mapping: "All" || Result: Will close ALL orders
Example 4:
BUY: LONG Signal
BUY: CLOSE SHORT Signal
SELL: SHORT Signal || Mapping: "LONG" || Result: Will close LONG orders
SELL: TBO Sell || Mapping: "CLOSE SHORT" || Result: Will close CLOSE SHORT orders
Hopefully, you get the idea buy now. You can map the closing orders to different buy orders to find the best types of entry and exit points.
Please note this is invite-only and requires an active Poobah Crypto Services subscription. If you are interested in using the strategy or TBO Indicator please visit the website in my signature below. Thanks!

Grid Bot BacktestingBinance, Bybit, Bitget, and other cross-exchange (grid) trading bot backtesting.
Auto bound: Automatically setting upper and lower price bounds.
Manual: Setting upper and lower price bounds manually.
The graph below represents the overall asset changes (initial investment amount + current position profit + grid profit).
Try using backtesting when setting up a grid bot on the exchange!
바이낸스, 바이비트, 비트겟 등 교차거래(그리드) 봇 백테스팅
Auto bound : 자동으로 상,하단 가격 설정
Manual : 직접 상,하단 가격 설정
아래 그래프는 총 자산 변화입니다.(초기투자금액 + 현재 포지션 수익 + 그리드 수익)
거래소에서 그리드 봇 설정할 때 백테스팅 유용하게 써보세요!

Cyatophilum 3Commas DCA Bot BacktesterAn indicator to backtest and automate 3Commas DCA Bots.
═════════════════════════════════════════════════════════════════════════
█ HOW IT WORKS
The indicator allows you to replicate your bot settings and get backtest results from the Strategy Tester and also a backtest panel with additional information on the safety orders.
You can also create alerts for each of the strategy events.
█ HOW TO USE
Choose a symbol that corresponds to your bot pair and exchange.
Pick a chart time frame as small as possible, usually 1 minute. The timeframe should always be smaller or equal to the deal start conditions timeframes.
Always use regular candle type.
Configure your deal start condition . You can combine several technical indicators to trigger an entry using a AND logical gate.
Configure your profit target
Use the Take Profit feature to set a target in percentage of price. You can also make it trail.
There is also a Stop Loss feature that is turned off by default.
Configure your safety orders
Replicate the safety orders from your bot into the indicator inputs.
Check your backtest parameters
Make sure that the initial capital and order size make sense. Since it is a pyramiding strategy with safety orders, the sum of all deals should not be bigger than the initial capital.
In this example: Initial capital is 0.02 BTC, which around 600$. I used 1000$ to be safe.
If you use % equity as order size, please note that it will create compounding.
Check the fees, by default they are set to 0.1%.
I also recommend to set a slippage that corresponds to your exchange's spread.
█ FEATURES
• Strategy direction
Configure wether to go long or short.
• Deal Start Conditions
The current conditions available are:
- Up to 4 MTF Trading View ratings conditions (Buy/Sell, Strong Buy/Sell)
- Up to 4 MTF RSI with configurable start conditions (Less/Greater than, Crossing Up/Down)
- Up to 2 MTF Ultimate Oscillator with configurable start conditions (Less/Greater than, Crossing Up/Down)
- MTF BB%-20-1 (length-deviation) with configurable start conditions (Less/Greater than, Crossing Up/Down)
- MTF BB%-20-2 (length-deviation) with configurable start conditions (Less/Greater than, Crossing Up/Down)
- Up to 2 MTF TA presets with the following options (Bollinger Bands, MFI, CCI, MACD, PSAR, SMA crosses, Heikin Ashi)
• Stop Loss and Take Profit
Configure your stop loss and take profit for long and short trades.
You can also make a trailing take profit.
• DCA (Safety orders)
Create up to 100 safety orders with configurable options for step and volume scaling, take profit from total volume, base and safety order size.
• Backtest Settings
Choose a backtest period, longs or shorts, wether to use limit orders or not.
Graphics
A Configuration panel with all the indicator settings, useful for sharing/saving a strategy.
A Backtest Results panel with additional information from the strategy tester.
█ ALERTS
The indicator is using the alert() calls: it only uses 1 alert slot to send order messages for each event (Long/Short entry, stop loss, take profit, safety order). This means free TV plans can create 1 complete strategy.
To set your alert messages, open the indicator settings and scroll to the bottom of the "inputs" tab.
Create your alert after you set the messages in the indicator settings, and make sure "Any alert() function call" is set in the alert option.
█ BACKTEST RESULTS
The backtest settings used in this snapshot are the following:
Initial Capital: 1000€
Order size: 0.003 BTC
Commission: 0.1 % per order
Slippage : 1 tick
Please read the author instructions below for access.

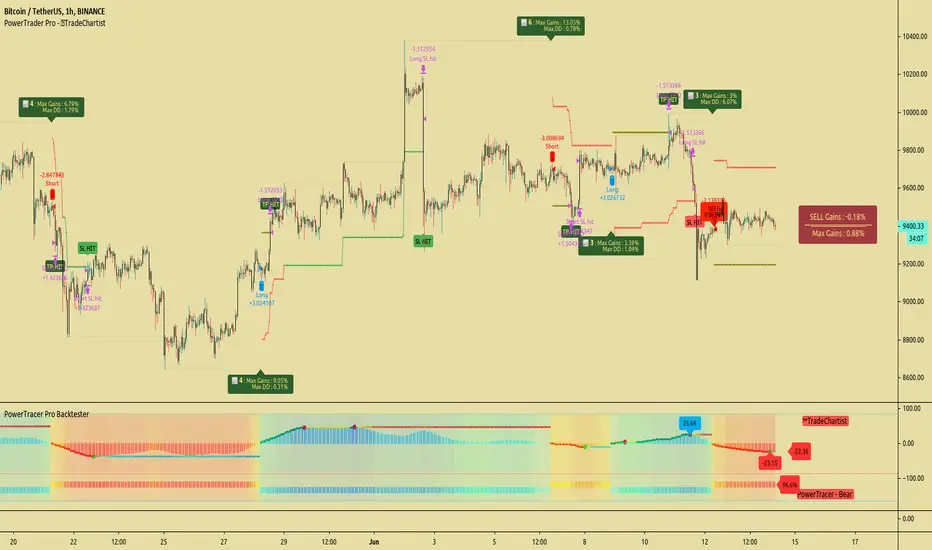
TradeChartist PowerTracer Pro Backtester™TradeChartist PowerTracer Pro Backtester is the strategy script for backtesting ™TradeChartist PowerTracer Pro for best performance settings which can then be used with ™TradeChartist PowerTrader Pro to plot Trades emulating the backtester and use Alerts (once per bar) on real time price chart.
PowerTracer Backtester includes the following options in the settings.
PowerTracer setting - Power Plot Type - (PowerTracer, Bar-wise Power Holder)
PowerTracer setting - Timeframe Multiplier
PowerTracer setting - Smoothing Factor
Backtester setting - Trade Direction - (Both Longs and Shorts, Only Longs, Only Shorts)
Backtester setting - SL Type (Fixed Stop Loss, Trailing Stop Loss)
Backtester setting - Reference for Trailing SL (Close, High/Low)
Backtester setting - Stop Loss %
Backtester setting - Take Profit %
Backtester setting - Quantity to trade at TP %
Using combinations of the settings, the user can find optimal settings for the asset to deliver lucrative entry and exit signals with high ROI and minimal Drawdown which can then be used on PowerTracer Pro and PowerTrader Pro to plot signals and create alerts to start trading in real-time.
Example charts:
GBP-USD 1hr chart - (2,1,Trailing SL, close, 1,1,25)
BTC-USDT 15m chart - (4,5, Trailing SL, high/low, 3.9,1.2,15)
SPX 1hr chart - (1,3, Trailing SL, high/low, 3, 2, 50)
This backtester needs the following scripts to generate signals and plots on main price chart and for real-time alerts
™TradeChartist PowerTracer Pro
™TradeChartist PowerTrader Pro
===================================================================================================================
This is not a free to use indicator. Get in touch with me (PM me directly if you would like trial access to test the indicator)
Premium Scripts - Trial access and Information
Trial access offered on all Premium scripts.
PM me directly to request trial access to the scripts or for more information.
===================================================================================================================
SuperTrend BacktesterThis is a backtesting script for the famous Super Trend.
Features
- Custom Date Range
- Custom Targets and Risks
Requested by Dlatrella
FreedX Grid Backtest█ FreedX Grid Backtest is an open-source tool that offers accurate GRID calculations for GRID trading strategies. This advanced tool allows users to backtest GRID trading parameters with precision, accurately reflecting exchange functionalities. We are committed to enhancing trading strategies through precise backtesting solutions and address the issue of unreliable backtesting practices observed on GRID trading strategies. FreedX Grid Backtest is designed for optimal calculation speed and plotting efficiency, ensuring users to achieve fastest calculations during their analysis.
█ GRID TRADING STRATEGY SETTINGS
The core of the FreedX Grid Backtest tool lies in its ability to simulate grid trading strategies. Grid trading involves placing orders at regular intervals within a predefined price range, creating a grid of orders that capitalize on market volatility.
Features:
⚙️ Backtest Range:
→ Purpose: Allows users to specify the backtesting range of GRID strategy. Closes all positions at the end of this range.
→ How to Use: Drag the dates to fit the desired backtesting range.
⚙️ Investment & Compounding:
→ Purpose: Allows users to specify the total investment amount and select between fixed and compound investment strategies. Compounding adjusts trade quantities based on performance, enhancing the grid strategy's adaptability to market changes.
→ How to Use: Set the desired investment amount and choose between "Fixed" or "Compound" for the investment method.
⚙️ Leverage & Grid Levels:
→ Purpose: Leverage amplifies the investment amount, increasing potential returns (and risks). Users can define the number of grid levels, which determines how the investment is distributed across the grid.
→ How to Use: Input the desired leverage and number of grids. The tool automatically calculates the distribution of funds across each grid level.
⚙️ Distribution Type & Mode:
→ Purpose: Users can select the distribution type (Arithmetic or Geometric) to set how grid levels are determined. The mode (Neutral, Long, Short) dictates the direction of trades within the grid.
→ How to Use: Choose the distribution type and mode based on the desired trading strategy and market outlook.
⚙️ Enable LONG/SHORT Grids exclusively:
█ MANUAL LEVELS AND STOP TRIGGERS
Beyond automated settings, the tool offers manual adjustments for traders seeking finer control over their grid strategies.
Features:
⚙️ Manual Level Adjustment:
→ Purpose: Enables traders to manually set the top, reference, and bottom levels of the grid, offering precision control over the trading range.
→ How to Use: Activate manual levels and adjust the top, reference, and bottom levels as needed to define the grid's scope.
⚙️ Stop Triggers:
→ Purpose: Provides an option to set upper and lower price limits, acting as stop triggers to close or terminate trades. This feature safeguards investments against significant market movements outside the anticipated range.
→ How to Use: Enable stop triggers and specify the upper and lower limits. The tool will automatically manage positions based on these parameters.
---
This guide gives you a quick and clear overview of the FreedX Grid Backtest tool, explaining how you can use this cutting-edge tool to improve your trading strategies.

How To Set Backtest Time Ranges
Example how to set the time range window to be backtested for both entries and exits. Additional examples are also included showing how to set the date range and toggle plot visibility.
By incorporating this code with your own strategy's logic, it will allow you to backtest various time windows.
Much gratitude to @LucF and @a.tesla2018 for help with including ':1234567' for time ranges on weekends. Thank you both!
NOTICE: This is an example script and not meant to be used as an actual strategy. By using this script or any portion thereof, you acknowledge that you have read and understood that this is for research purposes only and I am not responsible for any financial losses you may incur by using this script!

Smoothed Heikin Ashi Trend on Chart - TraderHalai BACKTESTSmoothed Heikin Ashi Trend on chart - Backtest
This is a backtest of the Smoothed Heikin Ashi Trend indicator, which computes the reverse candle close price required to flip a Heikin Ashi trend from red to green and vice versa. The original indicator can be found in the scripts section of my profile.
This particular back test uses this indicator with a Trend following paradigm with a percentage-based stop loss.
Note, that backtesting performance is not always indicative of future performance, but it does provide some basis for further development and walk-forward / live testing.
Testing was performed on Bitcoin , as this is a primary target market for me to use this kind of strategy.
Sample Backtesting results as of 10th June 2022:
Backtesting parameters:
Position size: 10% of equity
Long stop: 1% below entry
Short stop: 1% above entry
Repainting: Off
Smoothing: SMA
Period: 10
8 Hour:
Number of Trades: 1046
Gross Return: 249.27 %
CAGR Return: 14.04 %
Max Drawdown: 7.9 %
Win percentage: 28.01 %
Profit Factor (Expectancy): 2.019
Average Loss: 0.33 %
Average Win: 1.69 %
Average Time for Loss: 1 day
Average Time for Win: 5.33 days
1 Day:
Number of Trades: 429
Gross Return: 458.4 %
CAGR Return: 15.76 %
Max Drawdown: 6.37 %
Profit Factor (Expectancy): 2.804
Average Loss: 0.8 %
Average Win: 7.2 %
Average Time for Loss: 3 days
Average Time for Win: 16 days
5 Day:
Number of Trades: 69
Gross Return: 1614.9 %
CAGR Return: 26.7 %
Max Drawdown: 5.7 %
Profit Factor (Expectancy): 10.451
Average Loss: 3.64 %
Average Win: 81.17 %
Average Time for Loss: 15 days
Average Time for Win: 85 days
Analysis:
The strategy is typical amongst trend following strategies with a less regular win rate, but where profits are more significant than losses. Most of the losses are in sideways, low volatility markets. This strategy performs better on higher timeframes, where it shows a positive expectancy of the strategy.
The average win was positively impacted by Bitcoin’s earlier smaller market cap, as the percentage wins earlier were higher.
Overall the strategy shows potential for further development and may be suitable for walk-forward testing and out of sample analysis to be considered for a demo trading account.
Note in an actual trading setup, you may wish to use this with volatility filters, combined with support resistance zones for a better setup.
As always, this post/indicator/strategy is not financial advice, and please do your due diligence before trading this live.
Original indicator links:
On chart version -
Oscillator version -
Update - 27/06/2022
Unfortunately, It appears that the original script had been taken down due to auto-moderation because of concerns with no slippage / commission. I have since adjusted the backtest, and re-uploaded to include the following to address these concerns, and show that I am genuinely trying to give back to the community and not mislead anyone:
1) Include commission of 0.1% - to match Binance's maker fees prior to moving to a fee-less model.
2) Include slippage of 10 ticks (This is a realistic slippage figure from searching online for most crypto exchanges)
3) Adjust account balance to 10,000 - since most of us are not millionaires.
The rest of the backtesting parameters are comparable to previous results:
Backtesting parameters:
Initial capital: 10000 dollars
Position size: 10% of equity
Long stop: 2% below entry
Short stop: 2% above entry
Repainting: Off
Smoothing: SMA
Period: 10
Slippage: 10 ticks
Commission: 0.1%
This script still remains to shows viability / profitablity on higher term timeframes (with slightly higher drawdown), and I have included the backtest report below to document my findings:
8 Hour:
Number of Trades: 1082
Gross Return: 233.02%
CAGR Return: 14.04 %
Max Drawdown: 7.9 %
Win percentage: 25.6%
Profit Factor (Expectancy): 1.627
Average Loss: 0.46 %
Average Win: 2.18 %
Average Time for Loss: 1.33 day
Average Time for Win: 7.33 days
Once again, please do your own research and due dillegence before trading this live. This post is for education and information purposes only, and should not be taken as financial advice.

AltS Swing [Backtester]
PLEASE READ THIS DESCRIPTION TO SAVE TIME AND UNDERSTAND WHAT THIS INDICATOR DOES
This is the backtesting version for this script
In this back tested version I have shown it to be used on regular candles with realistic calculations in regards to positions sizes, slippage, fees and more
Kind Regards
This is a official version of AltSignals Long/Short Reverse Indicator
Description:
This indicator uses various indicators in combination with each other, some of the key ones to mention is Hulls, EMA , MA. Along with that it uses EMA crossovers to get the precise entries and exits.
The recommended time frames with this indictor are shorter ones, for example 5m,10m,15m work well, along with that I have found that some of the more unique time frames also work well such as 20m,45m,2hr and so on.
This indicator is not super advanced but it's still very powerful, with only 130 lines of code.
This indicator works on every chart, time, and candle type but you must play with the settings to find what is best, the same setting will not work on every pair etc.
With AltSignals Swing Indicator it trades one way, that means it gives 3 pieces of information. BUY/TakeProfit/StopLoss.
Unlike most indicators which Buy and Sell both ways this one focuses on one direction of trading so please take into account when using this.
I have added in a reverse strategy which basically shows the opposite values of of the buy, so if you select the box in the settings and un-tick it, then it will show opposite directions so sells only.
This feature is very useful especially in general bear markets when buying is difficult.
I have also added in the option for no stop losses to be used, if you set the stop loss value = 100 then it will show no stop losses.
I suggest a stop loss somewhere in the region of 1-2-3%, please note that you can use decimal stop losses too so for example 0.1 or 0.5.
This indicator is NOT a once size fits all, every chart is different, time frame and candles also, so i would suggest spending some time going through and playing with the channel length settings, which will change the EMA numbers.
Using this along with the back script to find the ideal settings is the best way to use this script, once you have done that make sure to save those values somewhere.
Its important to remember that the Regular script and the back testing script values should be the same for them to match up on the chart, so the channel lengths, stop losses and so on values should be the same.
Side note
This is not financial advice.
We will continue making updates as time goes on.
If you would like to try this script for free please visit our website or message us on Tradingview live chat.

Ema BacktesterA simple, but useful script for backtesting purposes. Find the optimal Settings for your strategy.
tips are always welcome at: 38uGQJDDZDL6wX48x4gYTccPeQ3ZHVYmY4 (btc)
I hope you enjoy the script :)

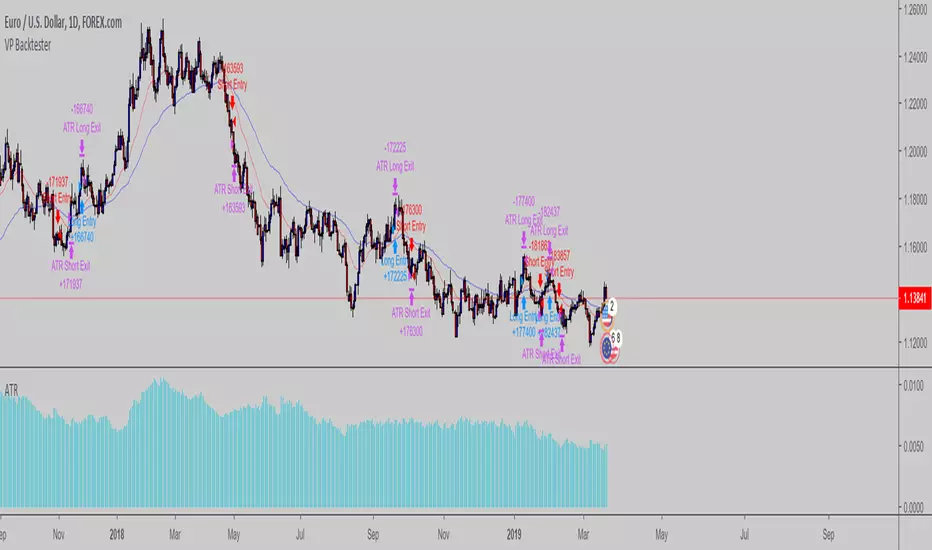
VP Backtester skeletonSimple backtesting skeleton script which uses ATR based stop & profit targets based on the no-nonsense forex way of trading
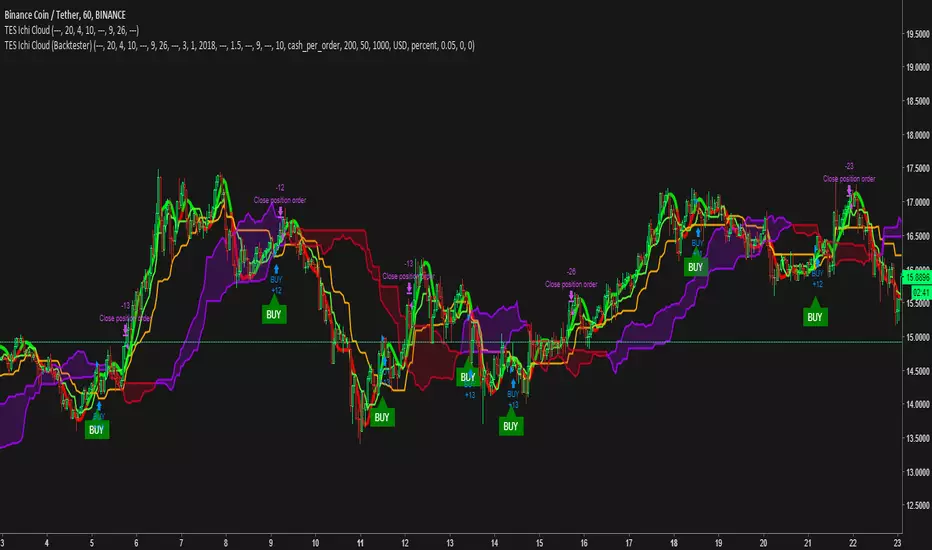
TES Ichimoku Cloud Signals v2 (Backtester)TES Ichimoku Cloud Signals v2 (Backtester)
A signal indicator that can sends buy signals to your exchange via Autoview.
This backtester works together with the "TES Ichimoku Cloud Signals v2" witch requires invite to use.
Look at this backtester and play with the settings to see if you like and request access to the signal indicator by PM.
- Use the moving average to sort out any bad signals. This trend is individual for each coin and by adjusting it, you can make the signals perfect for each coin you want to trade. Scroll through them all and find the best fit.
- Set stop loss % or leave it to let the signals buy on the downtrend
- Show your DCA %, if used in combination with ProfitTrailer.
Support the development and the future of great signal trading by donating.
BTC: 13qeJRZ1S2wGNYdHCNvKyieugWcVt2fiVg
ETH: 0xe73bfe4d981af78c2695cee4d495ca910ee8f49b
BNB: 0xe73bfe4d981af78c2695cee4d495ca910ee8f49b