Jack MA Cross Backtester with TP, SL, TSLJack MA Cross is works based on a MA Crossover. What makes this script unique is the framework built behind it. With the ability of adding TP, SL, and TSL. It makes this script more advanced compare to other traditional MA Crossover scripts.
Will add more Moving Averages in the future, making this the Jack of all Trades .
To request a trial for this script, please PM me.
-----------------
Jack MA Cross V1.0.0
- Initial release
ค้นหาในสคริปต์สำหรับ "backtest"

Power Penguin - Trend Trading Script BacktesterPower Penguin is a script that detects a trend and determines entry into the market based on the strength and price action.
Thanks to all my early backers for believing in my work!
This script is optimal for use in any market at this time.
To request a trial for this script, please PM me.
-----------------
Power Penguin V1.0.0
- Initial release


Market Facilitation Index (MFI) Backtest The Market Facilitation Index is an indicator that relates price range to
volume and measures the efficency of price movement. Use the indicator to
determine if the market is trending. If the Market Facilitation Index increased,
then the market is facilitating trade and is more efficient, implying that the
market is trending. If the Market Facilitation Index decreased, then the market
is becoming less efficient, which may indicate a trading range is developing that
may be a trend reversal.
You can change long to short in the Input Settings
WARNING:
- For purpose educate only
- This script to change bars colors.

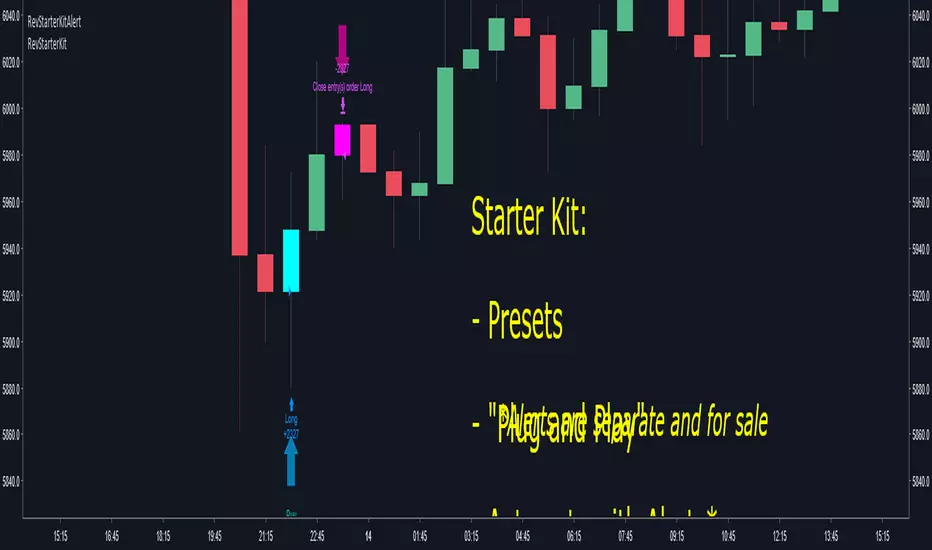
Crypto Reversal Scalper STARTER KIT BacktesterThis is a starter kit for people to try out.
Since many people were confused to how to properly config the original script, I decided to create this script.
This script uses the original script but is compiled to have presets.
Simple to use, EASY AS 1,2,3
1. Choose PAIR
2. Sync chart with chosen pair (Symbol and Timeframe)
3. DONE!
4. (Optional) Adjust Stoploss and Takeprofit
This will be FREE for people to consider giving it a try.
To automate the trades, you will need to have the alerts for the script.
If you want to automate the trades, PM me.
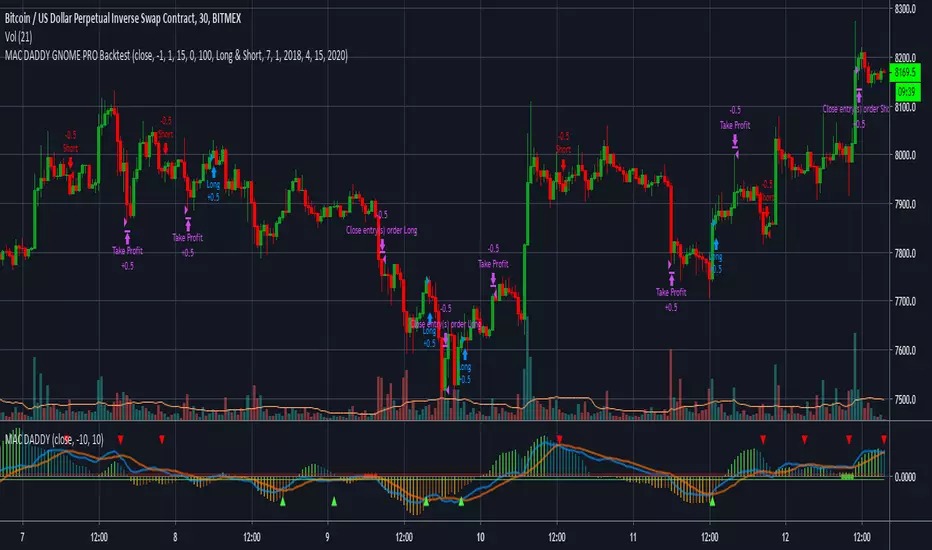
MAC DADDY GNOME PRO BacktestHello Fellow Traders!
-------------------------------------------
This is the newest addition to Gnome Alerts PRO!
This is one of the newer scripts that we are using for scalping on the lower time frames on Bitmex & Binance.
This is a script that can be used on all time frames and includes back-testing. All of our scripts included back-testing and BUY & SELL alerts.
This Script allows you to fire Long, Short, or Flip with Both
Also Includes TTM 2.77% Squeeze Bubbles for Manual trading.
INCLUDES:
------------------------
*Autoview Ready*
BUY ALERTS
- supports pyramiding
- sell based of %gain
SELL ALERTS
- supports pyramiding
- sell based of %gain
- stop loss configured
- sell on gain configured
Backtesting is also available!
More info on how gain access in my profile!
Crypto Reversal Scalper DEMO / FREE BacktesterCrypto Reversal Scalper Lite
This is a lite version of:
This script allows anyone to try out the capability of the script with restrictions to some features. If you want to unlock all the features, consider upgrading.
Full version also includes alerts for automated trading.

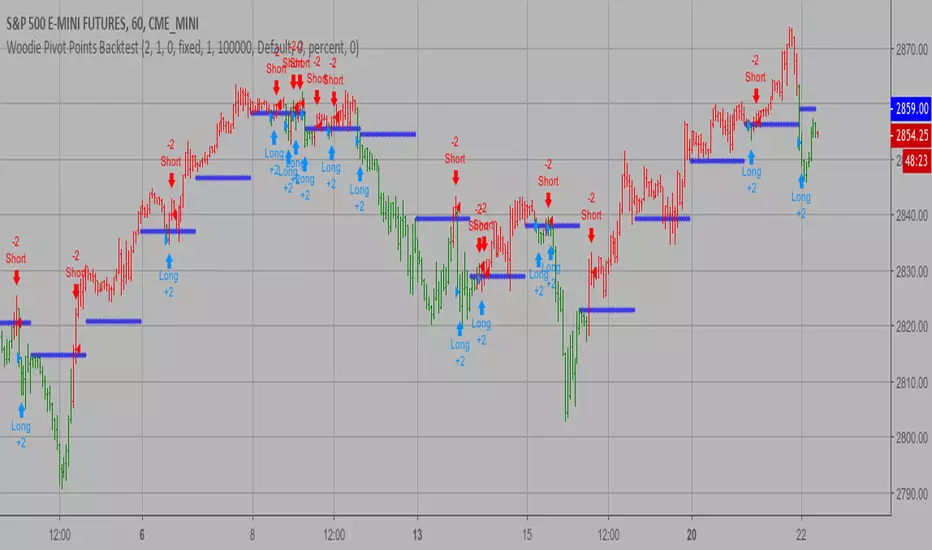
Woodie Pivot Points Backtest Simply input the vales of the high, low and closing price of the previous
period to calculate the Woodie pivot point and the associated resistance
and support levels for the present period.
You can change long to short in the Input Settings
WARNING:
- For purpose educate only
- This script to change bars colors.
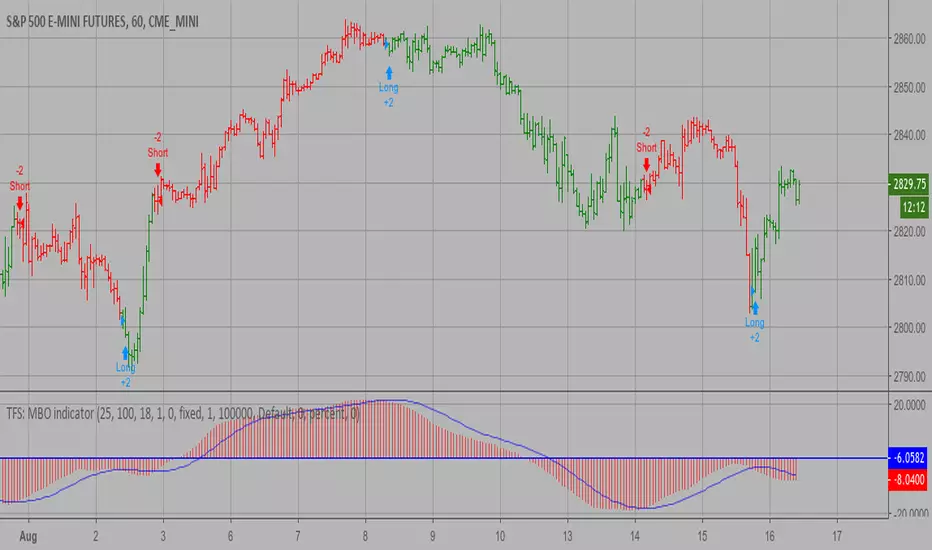
TFS: MBO Backtest MBO indicator is the third component of TFS trading system. This indicator
was developed by Bryan Strain and Mark Whitley.
The idea of MBO is similar to moving average convergence/divergence (MACD)
indicator. It is calculated by subtracting the 200-day moving average from
the 25-day moving average.
You can change long to short in the Input Settings
WARNING:
- For purpose educate only
- This script to change bars colors.
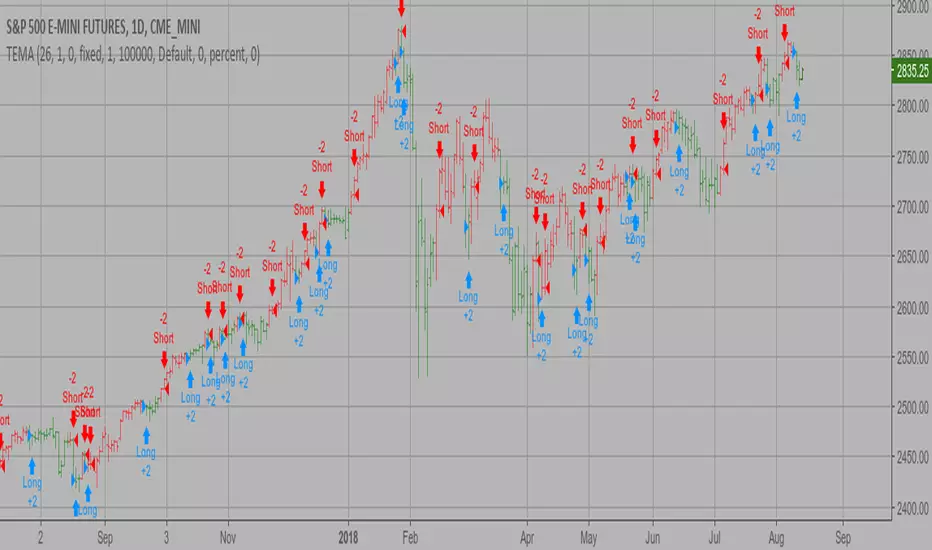
TEMA1 Backtest This study plots the TEMA1 indicator. TEMA1 ia s triple MA (Moving Average),
and is calculated as 3*MA - (3*MA(MA)) + (MA(MA(MA)))
You can change long to short in the Input Settings
WARNING:
- For purpose educate only
- This script to change bars colors.
DEMI GNOME PRO BacktestHello Fellow Traders!
-------------------------------------------
This is the newest addition to Gnome Alerts PRO
This is one of the newer scripts that we are using for scalping on the lower time frames on Bitmex & Binance.
This is a transformed version of GODMODE that adapts to market swings.
INCLUDES:
------------------------
*Autoview Ready*
BUY ALERTS
- multiple long positions
SELL ALERTS
- sell with oversold alerts
- sell based of %gain
Short Alerts For Bitmex
Backtesting is also available!
More info on how gain access in my profile!

Percent difference between price and MA Backtest Percent difference between price and MA
You can change long to short in the Input Settings
WARNING:
- For purpose educate only
- This script to change bars colors.

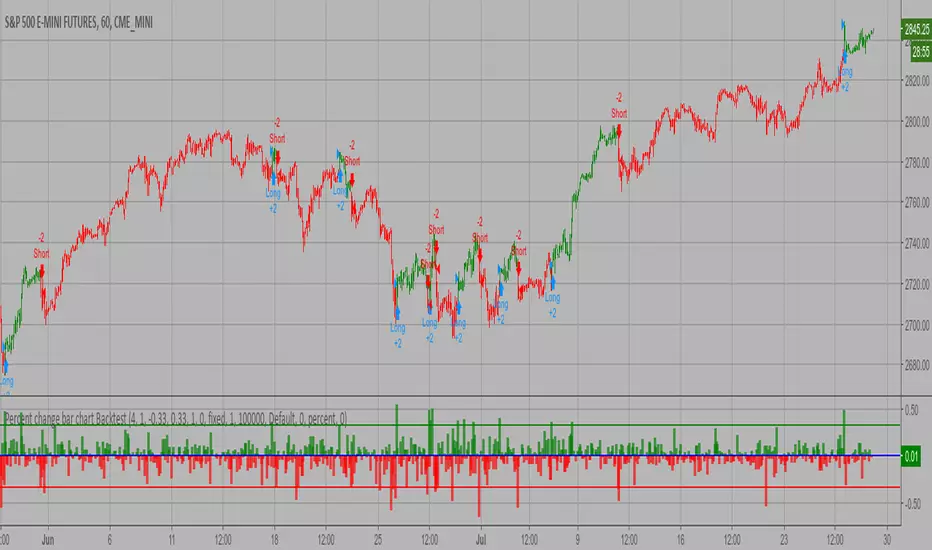
Percent change bar chart Backtest This histogram displays price or % change from previous bar.
You can change long to short in the Input Settings
WARNING:
- For purpose educate only
- This script to change bars colors.
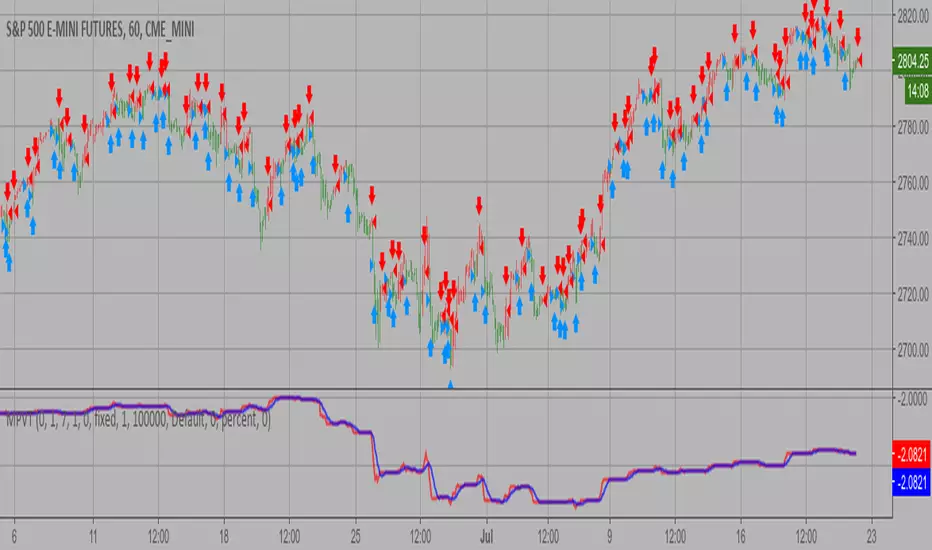
Modified Price-Volume Trend Backtest The related article is copyrighted material from
Stocks & Commodities.
Strategy by HPotter.
You can change long to short in the Input Settings
WARNING:
- For purpose educate only
- This script to change bars colors.
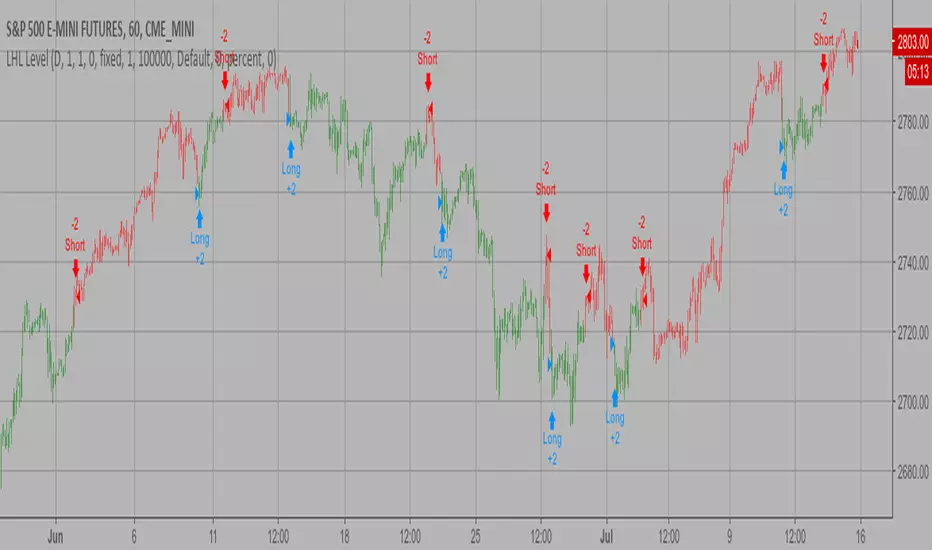
Last High and Low Level Backtest This script shows a high and low period value.
SelectPeriod - Day or Week or Month and etc.
LookBackPeriods - Shift levels 0 - current period, 1 - previous and etc.
You can change long to short in the Input Settings
WARNING:
- For purpose educate only
- This script to change bars colors.
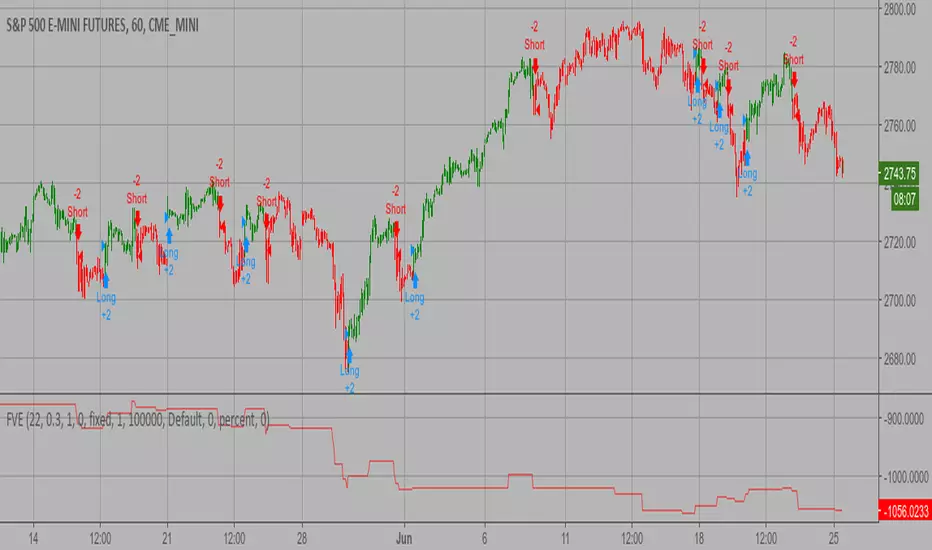
Finite Volume Elements (FVE) Backtest The FVE is a pure volume indicator. Unlike most of the other indicators
(except OBV), price change doesn?t come into the equation for the FVE (price
is not multiplied by volume), but is only used to determine whether money is
flowing in or out of the stock. This is contrary to the current trend in the
design of modern money flow indicators. The author decided against a price-volume
indicator for the following reasons:
- A pure volume indicator has more power to contradict.
- The number of buyers or sellers (which is assessed by volume) will be the same,
regardless of the price fluctuation.
- Price-volume indicators tend to spike excessively at breakouts or breakdowns.
You can change long to short in the Input Settings
WARNING:
- For purpose educate only
- This script to change bars colors.
Ergodic CSI Backtest This is one of the techniques described by William Blau in his book
"Momentum, Direction and Divergence" (1995). If you like to learn more,
we advise you to read this book. His book focuses on three key aspects
of trading: momentum, direction and divergence. Blau, who was an electrical
engineer before becoming a trader, thoroughly examines the relationship between
price and momentum in step-by-step examples. From this grounding, he then looks
at the deficiencies in other oscillators and introduces some innovative techniques,
including a fresh twist on Stochastics. On directional issues, he analyzes the
intricacies of ADX and offers a unique approach to help define trending and
non-trending periods.
This indicator plots Ergotic CSI and smoothed Ergotic CSI to filter out noise.
You can change long to short in the Input Settings
WARNING:
- For purpose educate only
- This script to change bars colors.

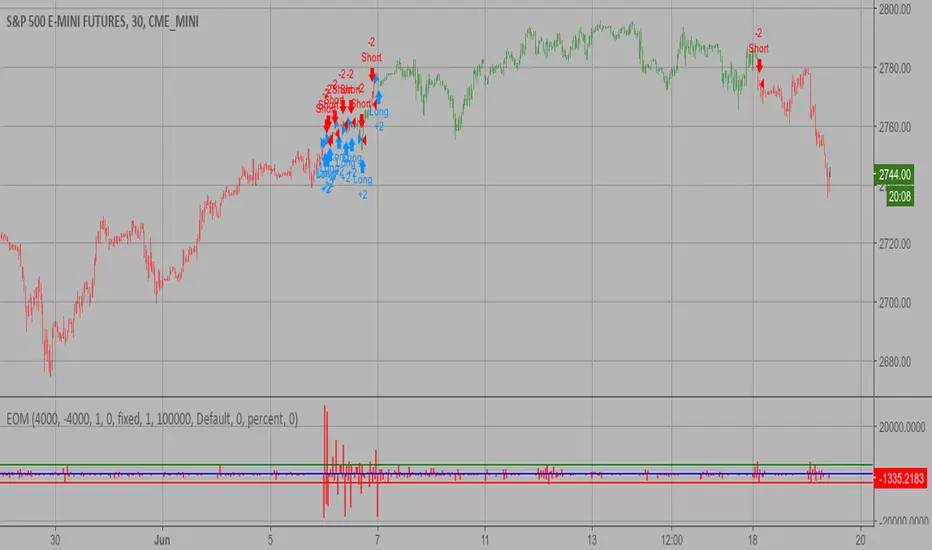
Ease of Movement (EOM) Backtest This indicator gauges the magnitude of price and volume movement.
The indicator returns both positive and negative values where a
positive value means the market has moved up from yesterday's value
and a negative value means the market has moved down. A large positive
or large negative value indicates a large move in price and/or lighter
volume. A small positive or small negative value indicates a small move
in price and/or heavier volume.
A positive or negative numeric value. A positive value means the market
has moved up from yesterday's value, whereas, a negative value means the
market has moved down.
You can change long to short in the Input Settings
WARNING:
- For purpose educate only
- This script to change bars colors.
Dynamic Momentum Index (DMI) Backtest This indicator plots Dynamic Momentum Index indicator. The Dynamic Momentum
Index (DMI) was developed by Tushar Chande and Stanley Kroll. The indicator
is covered in detail in their book The New Technical Trader.
The DMI is identical to Welles Wilder`s Relative Strength Index except the
number of periods is variable rather than fixed. The variability of the time
periods used in the DMI is controlled by the recent volatility of prices.
The more volatile the prices, the more sensitive the DMI is to price changes.
In other words, the DMI will use more time periods during quiet markets, and
less during active markets. The maximum time periods the DMI can reach is 30
and the minimum is 3. This calculation method is similar to the Variable
Moving Average, also developed by Tushar Chande.
The advantage of using a variable length time period when calculating the RSI
is that it overcomes the negative effects of smoothing, which often obscure short-term moves.
The volatility index used in controlling the time periods in the DMI is based
on a calculation using a five period standard deviation and a ten period average
of the standard deviation.
You can change long to short in the Input Settings
WARNING:
- For purpose educate only
- This script to change bars colors.

Average Directional Movement Index Rating Backtest The Average Directional Movement Index Rating (ADXR) measures the strength
of the Average Directional Movement Index (ADX). It's calculated by taking
the average of the current ADX and the ADX from one time period before
(time periods can vary, but the most typical period used is 14 days).
Like the ADX, the ADXR ranges from values of 0 to 100 and reflects strengthening
and weakening trends. However, because it represents an average of ADX, values
don't fluctuate as dramatically and some analysts believe the indicator helps
better display trends in volatile markets.
You can change long to short in the Input Settings
WARNING:
- For purpose educate only
- This script to change bars colors.

Vertical Horizontal Filter BacktestVertical Horizontal Filter was initiated by Adam White. It was first published
in a magazine called “Issues of Futures” in August, 1991. The Vertical Horizontal
Filter (VHF) is a very common Indicator used by traders to find out the Phase of
a Price Trend. Normally, a price trend can be in a Trending Phase or a Congestion
Phase/Choppy Movement Phase. Adam White created this particular Technical Indicator
to determine whether prices are trending in a particular direction or are they going
through a transitional period. He used it to measure the range of Futures available
in the market.
You can change long to short in the Input Settings
WARNING:
- For purpose educate only
- This script to change bars colors.
