SMU Quantum Thermo BallsThis script is the enhanced version of Market Thermometer with one difference. This one has Quantum Thermo balls shooting out of the thermometer tube when overheated. Quantum psychology, Quantum observation, call it what you like
My scripts are designed to beat ALGO, so the behavior of indicators is not like traditional indicators. Don't try to overthink it and compare it to other established functions.
If you knew ALGo as much as I do, then you would also ditch old indicators and design your own weird scripts to match the ALGO's personality. Oh yes, each AlGo for each stock has its own programming personality. Most my scripts are tuned to beat SPX ALGO meniac
Enjoy and think outside the box, the only way to beat the ALGO
ค้นหาในสคริปต์สำหรับ "algo"

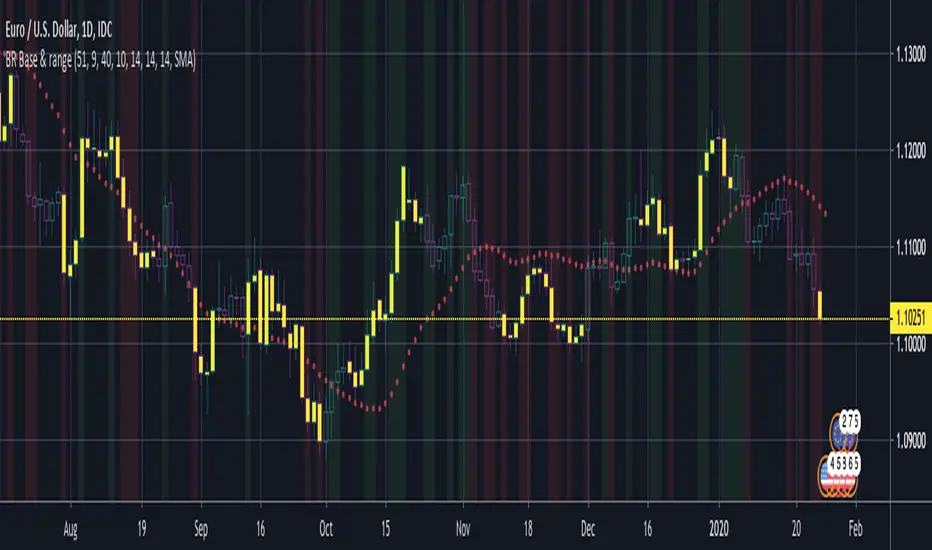
BERLIN Renegade - Baseline & RangeThis is the baseline and range candles part of a larger algorithm called the "BERLIN Renegade". It is based on the NNFX way of trading, with some modifications.
The baseline is used for price crossover signals, and consists of the LSMA. When price is below the baseline, the background turns red, and when it is above the baseline, the background turns green.
It also includes a modified version of the Range Identifier by LazyBear. This version calculates the same, but draws differently. It remove the baseline signal color if the Range Identifier signals there is a possible trading range forming.
The main way of identifying ranges is using the BERLIN Range Index. A panel version of this indicator is included in another part of the algorithm, but the bar color version is included here, to make the ranges even more visible and easier to avoid.
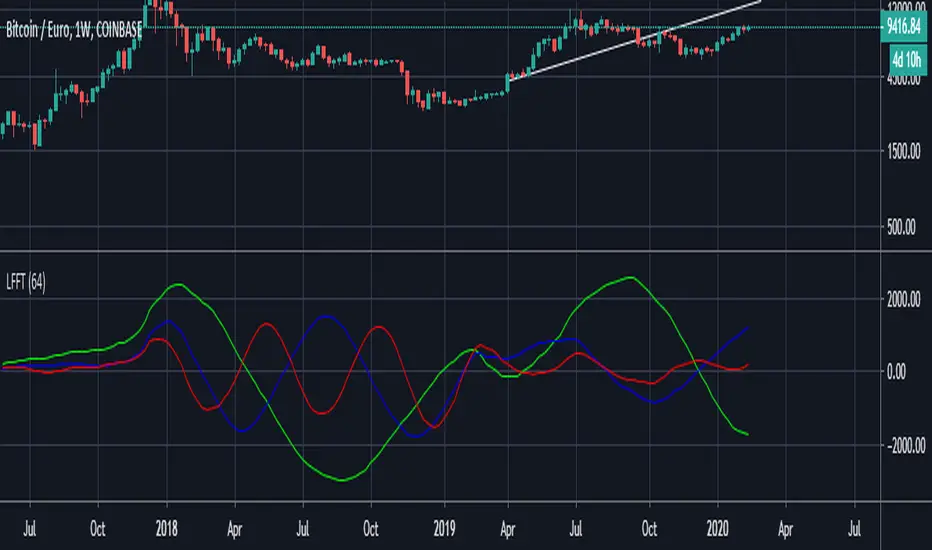
Low Frequency Fourier TransformThis Study uses the Real Discrete Fourier Transform algorithm to generate 3 sinusoids possibly indicative of future price.
I got information about this RDFT algorithm from "The Scientist and Engineer's Guide to Digital Signal Processing" By Steven W. Smith, Ph.D.
It has not been tested thoroughly yet, but it seems that that the RDFT isn't suited for predicting prices as the Frequency Domain Representation shows that the signal is similar to white noise, showing no significant peaks, indicative of very low periodicity of price movements.
Correlation MATRIX (Flexible version)Hey folks
A quick unrelated but interesting foreword
Hope you're all good and well and tanned
Me? I'm preparing the opening of my website where we're going to offer the Algorithm Builder Single Trend, Multiple Trends, Multi-Timeframe and plenty of others across many platforms (TradingView, FXCM, MT4, PRT). While others are at the beach and tanning (Yes I'm jealous, so what !?!), we're working our a** off to deliver an amazing looking website and great indicators and strategies for you guys.
Today I worked in including the Trade Manager Pro version and the Risk/Reward Pro version into all our Algorithm Builders. Here's a teaser
We're going to have a few indicators/strategies packages and subscriptions will open very soon.
The website should open in a few weeks and we still have loads to do ... (#no #summer #holidays #for #dave)
I see every message asking me to allow access to my Algorithm Builders but with the website opening shortly, it will be better for me to manage the trials from there - otherwise, it's duplicated and I can't follow all those requests
As you can probably all understand, it becomes very challenging to publish once a day with all that workload so I'll probably slow down (just a bit) and maybe posting once every 2/3 days until the website will be over (please forgive me for failing you). But once it will open, the daily publishing will resume again :) (here's when you're supposed to be clapping guys....)
While I'm so honored by all the likes, private messages and comments encouraging me, you have to realize that a script always takes me about 2/3 hours of work (with research, coding, debugging) but I'm doing it because I like it. Only pushing the brake a bit because of other constraints
INDICATOR OF THE DAY
I made a more flexible version of my Correlation Matrix .
You can now select the symbols you want and the matrix will update automatically !!! Let me repeat it once more because this is very cool... You can now select the symbols you want and the matrix will update automatically :)
Actually, I have nothing more to say about it... that's all :) Ah yes, I added a condition to detect negative correlation and they're being flagged with a black dot
Definition : Negative correlation or inverse correlation is a relationship between two variables whereby they move in opposite directions.
A negative correlation is a key concept in portfolio construction, as it enables the creation of diversified portfolios that can better withstand portfolio volatility and smooth out returns.
Correlation between two variables can vary widely over time. Stocks and bonds generally have a negative correlation, but in the decade to 2018, their correlation has ranged from -0.8 to 0.2. (Source : www.investopedia.com
See you maybe tomorrow or in a few days for another script/idea.
Be sure to hit the thumbs up to cheer me up as your likes will be the only sunlight I'll get for the next weeks.... because working on building a great offer for you guys.
Dave
____________________________________________________________
- I'm an officially approved PineEditor/LUA/MT4 approved mentor on codementor. You can request a coaching with me if you want and I'll teach you how to build kick-ass indicators and strategies
Jump on a 1 to 1 coaching with me
- You can also hire for a custom dev of your indicator/strategy/bot/chrome extension/python

SMA/pivot/Bollinger/MACD/RSI en pantalla gráficoMulti-indicador con los indicadores que empleo más pero sin añadir ventanas abajo.
Contiene:
Cruce de 3 medias móviles
La idea es no tenerlas en pantalla, pero están dibujadas también. Yo las dejo ocultas salvo que las quiera mirar para algo.
Lo que presento en pantalla es la media lenta con verde si el cruce de las 3 marca alcista, amarillo si no está claro y rojo si marca bajista.
Pivot
Normalmente los tengo ocultos pero los muestro cuando me interesa. Están todos aunque aparezcan 2 seguidos.
Bandas de Bollinger
No dibujo la línea central porque empleo la media como tal.
Parabollic SAR
Lo empleo para dibujar las ondas de Elliott como postula Matías Menéndez Larre en el capítulo 11 de su libro "Las ondas de Elliott". Así que, aunque se puede mostrar, lo mantengo oculto y lo que muestro es dónde cambia (SAR cambio).
MACD
No está dibujado porque necesitaría sacarlo del gráfico.
Marco en la parte superior cuándo la señal sobrepasa al MACD hacia arriba o hacia abajo con un flecha indicando el sentido de esta señal.
RSI
Similar al MACD pero en la parte inferior.
Probablemente, programe otro indicador para visualizar en una ventanita MACD, RSI y volumen todo junto. El volumen en la principal hay veces que no te permite ver bien alguna sombra y los otros 2 te quitan mucho espacio para graficar si los tienes permanentemente en 2 ventanas separadas.
DFT - Dominant Cycle Period 8-50 bars - John EhlerThis is the translation of discret cosine tranform (DCT) usage by John Ehler for finding dominant cycle period (DC).
The price is first filtered to remove aliasing noise(bellow 8 bars) and trend informations(above 50 bars), then the power is computed.
The trick here is to use a normalisation against the maximum power in order to get a good frequency resolution.
Current limitation in tradingview does not allow to display all of the periods, still the DC period is plot after beeing computed based on the center of gravity algo.
The DC period can be used to tune all of the indicators based on the cycles of the markets. For instance one can use this (DC period)/2 as an input for RSI.
Hope you find this of some interrest.
[naoligo] Simple ADXI'm publishing this indicator just for study purposes, because the result is exactly the same as DMI without the smoothing factor. It is exactly the same as ADX Wilder from MT5.
I was looking for the algorithm all over and it was a pain to find the right formula, meaning: one that would match with the built-in ones. After several study and comparison, I still didn't find the algorithm that match with the MT5's built-in simple ADX ...
Enjoy!

Patrones de entrada/salida V.1.0 -BETA-Este algoritmo intenta identificar patrones o fractales dentro de los movimientos de precios para dar señales de compra o venta de activos.

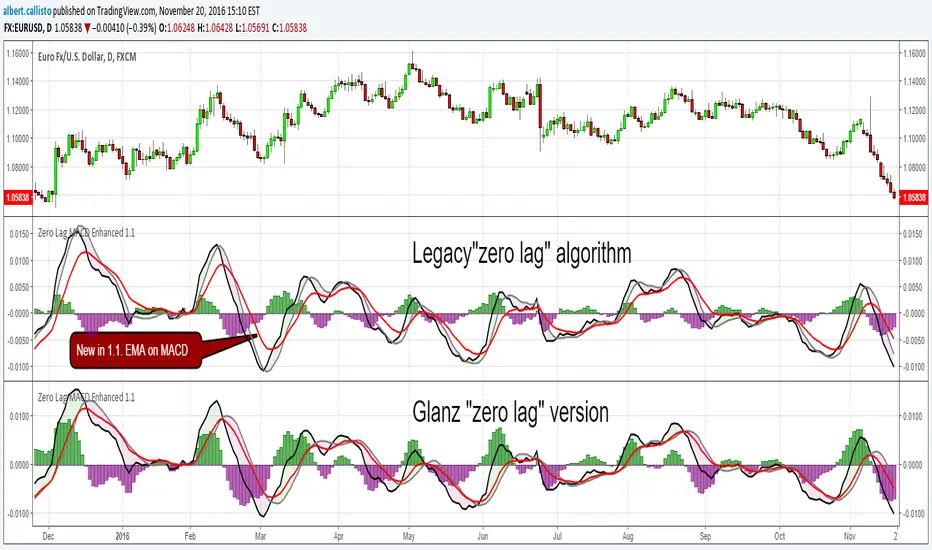
Zero Lag MACD Enhanced - Version 1.1ENHANCED ZERO LAG MACD
Version 1.1
Based on ZeroLag EMA - see Technical Analysis of Stocks and Commodities, April 2000
Original version by user Glaz. Thanks !
Ideas and code from @yassotreyo version.
Tweaked by Albert Callisto (AC)
New features:
Added original signal line formula
Added optional EMA on MACD
Added filling between the MACD and signal line
I looked at other versions of the zero lag and noticed that the histogram was slightly different. After looking at other zero lags on TV, I noticed that the algorithm implementation of Glanz generated a modified signal line. I decided to add the old version to be compliant with the original algorithm that you will find in other platforms like MT4, FXCM, etc.
So now you can choose if you want the original algorithm or Glanz version. It's up to you then to choose which one you prefer. I also added an extra EMA applied on the MACD. This is used in a system I am currently studying and can be of some interest to filter out false signals.
Acc/Dist. Cloud with Fractal Deviation Bands by @XeL_ArjonaACCUMULATION / DISTRIBUTION CLOUD with MORPHIC DEVIATION BANDS
Ver. 2.0.beta.23:08:2015
by Ricardo M. Arjona @XeL_Arjona
DISCLAIMER
The Following indicator/code IS NOT intended to be a formal investment advice or recommendation by the author, nor should be construed as such. Users will be fully responsible by their use regarding their own trading vehicles/assets.
The embedded code and ideas within this work are FREELY AND PUBLICLY available on the Web for NON LUCRATIVE ACTIVITIES and must remain as is.
Pine Script code MOD's and adaptations by @XeL_Arjona with special mention in regard of:
Buy (Bull) and Sell (Bear) "Power Balance Algorithm by Vadim Gimelfarb published at Stocks & Commodities V. 21:10 (68-72).
Custom Weighting Coefficient for Exponential Moving Average (nEMA) adaptation work by @XeL_Arjona with contribution help from @RicardoSantos at TradingView @pinescript chat room.
Morphic Numbers (PHI & Plastic) Pine Script adaptation from it's algebraic generation formulas by @XeL_Arjona
Fractal Deviation Bands idea by @XeL_Arjona
CHANGE LOG:
ACCUMULATION / DISTRIBUTION CLOUD: I decided to change it's name from the Buy to Sell Pressure. The code is essentially the same as older versions and they are the center core (VORTEX?) of all derived New stuff which are:
MORPHIC NUMBERS: The "Golden Ratio" expressed by the result of the constant "PHI" and the newer and same in characteristics "Plastic Number" expressed as "PN". For more information about this regard take a look at: HERE!
CUSTOM(K) EXPONENTIAL MOVING AVERAGE: Some code has cleaned from last version to include as custom function the nEMA , which use an additional input (K) to customise the way the "exponentially" is weighted from the custom array. For the purpose of this indicator, I implement a volatility algorithm using the Average True Range of last 9 periods multiplied by the morphic number used in the fractal study. (Golden Ratio as default) The result is very similar in response to classic EMA but tend to accelerate or decelerate much more responsive with wider bars presented in trending average.
FRACTAL DEVIATION BANDS: The main idea is based on the so useful Standard Deviation process to create Bands in favor of a multiplier (As John Bollinger used in it's own bands) from a custom array, in which for this case is the "Volume Pressure Moving Average" as the main Vortex for the "Fractallitly", so then apply as many "Child bands" using the older one as the new calculation array using the same morphic constant as multiplier (Like Fibonacci but with other approach rather than %ratios). Results are AWSOME! Market tend to accelerate or decelerate their Trend in favor of a Fractal approach. This bands try to catch them, so please experiment and feedback me your own observations.
EXTERNAL TICKER FOR VOLUME DATA: I Added a way to input volume data for this kind of study from external tickers. This is just a quicky-hack given that currently TradingView is not adding Volume to their Indexes so; maybe this is temporary by now. It seems that this part of the code is conflicting with intraday timeframes, so You are advised.
This CODE is versioned as BETA FOR TESTING PROPOSES. By now TradingView Admins are changing lot's of things internally, so maybe this could conflict with correct rendering of this study with special tickers or timeframes. I will try to code by itself just the core parts of this study in order to use them at discretion in other areas. ALL NEW IDEAS OR MODIFICATIONS to these indicator(s) are Welcome in favor to deploy a better and more accurate readings. I will be very glad to be notified at Twitter or TradingView accounts at: @XeL_Arjona

Gold Intelligence - Final Sniper v12 by Herman Sangivera(Papua)🚀 Gold Intelligence - Final Sniper v12 by Herman Sangivera ( Papua )
Overview
Gold Intelligence - Final Sniper v12 is a cutting-edge technical indicator specifically engineered for high-volatility instruments like XAU/USD (Gold). This indicator merges advanced Price Action candlestick recognition algorithms with institutional volume analysis and real-time market sentiment to deliver precision entry signals.
The primary goal of this tool is to filter out market "noise" and highlight only High Probability Setups that meet strict technical criteria.
🛡️ Key Features
Smart Pattern Recognition: Automatically identifies high-impact patterns: Pin Bars (psychological rejection) and Engulfing Candles (institutional dominance).
Probability Scoring: Every signal is assigned a percentage (%) score based on volume confirmation and price intensity. Signals only trigger when they exceed the minimum threshold (default 75%).
Real-Time Sentiment Dashboard: An exclusive on-chart panel that monitors the balance of Buy/Sell pressure instantly.
Dynamic Risk Management: Automatically projects Take Profit (TP) and Stop Loss (SL) boxes using Average True Range (ATR) calculations, ensuring your targets stay adaptive to current market volatility.
Institutional Volume Check: Validates entries by cross-referencing significant volume spikes (Smart Money footprints) to help you avoid market traps and fakeouts.
📖 How to Use (Trading Guide)
Identify the Signal: Wait for the "SNAPSHOT GOLD" label to appear on the chart.
🟢 Green Label: Buy Signal (Bullish).
🔴 Red Label: Sell Signal (Bearish).
Check Probability Score: It is highly recommended to only take signals with a score of >75%. A higher score indicates stronger technical confluence.
Execution & Targets:
Enter the trade at the close of the signal candle.
Target the Green transparent box for profit and use the Red box for risk management.
Dashboard Confirmation: Ensure the Sentiment percentage aligns with your trade direction (e.g., Sentiment > 60% Buy for Long positions).
⚙️ Input Parameters
Min Probability: The minimum accuracy threshold for a signal to be displayed.
TP & SL Multiplier: Customize your reward-to-risk ratio based on ATR multiples.
Alerts: Fully compatible with real-time notifications for Mobile, Email, or Webhooks.
⚠️ Disclaimer
This indicator is an analytical tool and does not guarantee profits. Gold trading involves significant risk. Always use proper money management and backtest on a demo account before trading live funds.

Bitcoin Halving Cycles [DotGain]Halving Cycles
A lightweight, time-anchored Bitcoin halving cycle visualizer built for clean charting, repeatable process planning, and simple profit/DCA timing references.
This Code was heavily inspired by KevinSvenson_ who created Bitcoin Halving Cycle Profit .
What this indicator does
This script plots the key “cycle landmarks” relative to each halving date:
Halving (⛏) – the cycle anchor
Profit START – marks the beginning of the post-halving profit window (default: 40 weeks )
Profit END / Last Call – marks the final phase of the profit window (default: 77 weeks )
DCA START – marks the point where long-term accumulation becomes the focus again (default: 135 weeks )
How to read it
Vertical lines = the exact cycle milestones
Bottom labels = description of each milestone aligned to its line (keeps the chart clean)
Green background (optional) = active Profit Zone on existing bars
Red background (optional) = optional warning zone after Profit END
HUD Panel (top-right)
The HUD gives you a fast “where are we in the cycle?” view with two modes:
Current Cycle
Shows: Halving date, Weeks since, and time remaining to Profit START / Last Call / DCA START within the current cycle.
Next Halving (Projection)
Shows: Countdown to the next enabled future halving, plus the projected weeks from today to Profit START / Last Call / DCA START after that future halving.
Future Halvings (manual)
You can manually add up to 3 future halving dates (Halving #1–#3).
This is useful for forward planning and cycle projection even before the event happens.
Enable Halving #1 / #2 / #3
Set Year / Month / Day for each
Optional: show/hide future markers & projections
Note: background zones only shade existing bars . Future projections are shown via lines/labels.
Settings overview
Show all cycles – plots every enabled cycle (historical + optional future). If disabled, only the current cycle is drawn.
Show Profit Zone background – green shading during the active profit window (current cycle only).
Show vertical markers + labels – toggles all milestone lines + labels.
Show HUD – toggles the HUD panel.
HUD Mode – switch between Current Cycle and Next Halving (Projection).
Cycle Logic – edit offsets in weeks (Profit START / Profit END / DCA START).
Optional Warning Zone – show a post-profit warning shading for a chosen number of weeks.
Have fun :)
Disclaimer
This Halving Cycles indicator is provided for informational and educational purposes only. It does not, and should not be construed as, financial, investment, or trading advice.
This indicator is an independent implementation of a time-based Bitcoin halving cycle visualization tool and is not affiliated with, or endorsed by, any third-party trading systems, strategies, protocols, or trademarked methodologies. The cycle zones, milestone markers, and countdown values displayed by this indicator are generated by a predefined set of algorithmic rules based on historical halving dates and user-defined time offsets. They do not constitute a direct recommendation to buy, sell, or hold any financial instrument or digital asset.
All trading and investing in financial markets involves a substantial risk of loss. You may lose part or all of your invested capital. Past performance does not guarantee future results. This indicator highlights historical and projected time-based market cycles and may produce false, lagging, incomplete, or misleading signals. Market behavior is influenced by many external factors and can deviate significantly from historical patterns or expectations.
The creator DotGain assumes no responsibility or liability for any financial losses, damages, or decisions made based on the use of this indicator or the information it provides. You are solely responsible for your own trading and investment decisions. Always conduct your own research (DYOR), use proper risk management, validate insights with additional tools or analysis, and consider your personal financial situation and risk tolerance before making any financial decision.

SMC Liquidity Engine Pro SMC Liquidity Engine Pro - Complete Trading Guide & Documentation
📊 Introduction: Understanding Smart Money Concepts
The SMC Liquidity Engine Pro is a comprehensive, institutional-grade trading indicator that brings professional Smart Money Concepts (SMC) methodology directly to your TradingView charts. This isn't just another technical indicator—it's a complete framework for understanding how institutional traders, market makers, banks, and hedge funds manipulate and move the markets.
What Makes This Different?
While most retail traders rely on lagging indicators like moving averages or RSI, this indicator reveals the real-time footprints of institutional activity. It shows you:
Where large players are accumulating or distributing positions
How they engineer liquidity to trigger retail stop losses
When they're shifting from one directional bias to another
Where price inefficiencies exist that institutions will likely revisit
The markets don't move randomly—they move based on liquidity. Understanding this fundamental truth is what separates consistently profitable traders from those who struggle. This indicator decodes that liquidity-driven behavior and presents it in clear, actionable visual signals.
The Philosophy Behind Smart Money Concepts
Smart Money Concepts is built on several core principles:
1. Liquidity is King: Price doesn't move because of patterns or indicators—it moves to collect liquidity (stop losses and pending orders). Institutions need massive liquidity to fill their large positions, so they engineer price movements to create that liquidity before making their real directional move.
2. Market Structure Reveals Intent: The way price forms highs and lows tells a story about who's in control. When structure breaks, it signals a shift in institutional positioning.
3. Inefficiencies Get Filled: When price moves too quickly in one direction, it leaves behind "fair value gaps"—areas of imbalance. Institutions frequently return to these areas to fill orders and restore balance.
4. Manipulation Precedes True Moves: The most explosive directional moves are often preceded by liquidity sweeps in the opposite direction—trapping retail traders before the real move begins.
This indicator automates the identification of all these concepts, allowing you to trade alongside the smart money rather than being their exit liquidity.
🎯 Core Features - Deep Dive
1. Market Structure Detection & Visualization
What It Is: Market structure forms the foundation of all Smart Money analysis. This indicator automatically identifies and tracks swing highs and swing lows using a sophisticated pivot detection algorithm. These aren't just any price points—they represent areas where the market showed a significant shift in supply and demand dynamics.
How It Works: The indicator uses a customizable lookback period to identify valid swing points. A swing high must have lower highs on both sides within the lookback period, and a swing low must have higher lows on both sides. This ensures that only significant structural points are marked, filtering out minor noise and consolidation.
Visual Presentation:
Bullish Structure (Cyan Lines): Horizontal lines extending from each identified swing high, showing resistance levels that price previously respected
Bearish Structure (Red Lines): Horizontal lines extending from each identified swing low, showing support levels where buying pressure emerged
Trading Application: These structure levels serve multiple purposes:
Target Zones: Previous highs become targets in uptrends; previous lows become targets in downtrends
Invalidation Levels: If expecting a bullish move, breaking below the last swing low invalidates the setup
Context for Other Signals: All BOS, CHOCH, and liquidity sweep signals gain meaning from their relationship to structure
Multi-Timeframe Anchors: Higher timeframe structure provides context for lower timeframe entries
Advanced Tip: When multiple timeframe structures align (e.g., a daily swing low coincides with a 4-hour swing low), these levels carry significantly more weight and are more likely to be defended or, when broken, lead to explosive moves.
2. Break of Structure (BOS) - Trend Confirmation
What It Is: A Break of Structure occurs when price definitively closes beyond a previous swing high (bullish BOS) or swing low (bearish BOS). This signals that the current trend maintains its momentum and is likely to continue in the same direction.
The Institutional Perspective: When institutions want to continue pushing price in a direction, they need to break through previous resistance or support. A clean BOS indicates that:
There's sufficient institutional buying/selling to overcome the supply/demand at previous structure
The trend has enough momentum to attract more participants
Stop losses above/below structure have been triggered, providing liquidity for continuation
Signal Characteristics:
Bullish BOS Label: Appears below the bar that closes above the previous swing high
Bearish BOS Label: Appears above the bar that closes below the previous swing low
Confirmation: Requires a full candle close, preventing false signals from wicks
Trading Strategies:
Trend Continuation Entries: After a BOS, wait for a pullback to a Fair Value Gap or minor structure, then enter in the direction of the break
Breakout Trading: Enter immediately on BOS confirmation with a stop below the broken structure
Momentum Confirmation: Use BOS to confirm that your existing position is aligned with institutional flow
Scaling Strategy: Add to positions on each successive BOS in trending markets
What to Watch For:
Volume: Strong BOS movements should be accompanied by above-average volume
Speed: Rapid price movement through structure suggests institutional urgency
Follow-Through: The best BOS signals see price continue strongly without immediately reversing
Higher Timeframe Alignment: BOS on higher timeframes (4H, Daily) carry more weight than lower timeframe breaks
Common Pitfalls:
Not all structure breaks are equal—BOS during ranging markets are less reliable
A BOS immediately followed by a reversal back into the range may indicate a failed breakout
During major news events, structure can be broken temporarily without institutional intent
3. Liquidity Sweep Detection - Spotting Manipulation
What It Is: Liquidity sweeps (also called "stop hunts" or "liquidity grabs") occur when price temporarily breaks beyond a key level to trigger stop losses and pending orders, then immediately reverses back. This is one of the most important concepts in SMC trading because it reveals intentional manipulation.
Why Institutions Do This: Large institutional orders can't be filled at a single price point—they need massive liquidity. The biggest pools of liquidity sit just beyond obvious highs and lows where retail traders place their stops. By briefly pushing price into these zones, institutions:
Trigger retail stop losses (creating market orders)
Activate pending buy/sell orders
Fill their large positions at favorable prices
Trap late breakout traders before reversing
Detection Methodology: The indicator identifies sweeps using multiple criteria:
Price must penetrate beyond the structural high/low (creating the sweep)
The candle must close back on the opposite side of the structure (confirming rejection)
The sweep distance is measured against ATR to distinguish manipulation from normal volatility
The sweep multiplier setting allows you to adjust sensitivity based on market conditions
Visual Indicators:
Orange Down Arrows: Mark liquidity sweeps above structural highs
Lime Up Arrows: Mark liquidity sweeps below structural lows
Liquidity Zone Boxes: Semi-transparent colored boxes highlight the exact range of the swept area
Persistent Display: Zones remain visible for several bars to maintain context
Trading Applications:
Reversal Trading: Liquidity sweeps often mark excellent reversal points. After a sweep:
Wait for the sweep to complete (candle closes back inside structure)
Look for a Change of Character signal for confirmation
Enter in the direction opposite to the sweep
Place stops beyond the sweep high/low
Target the opposite side of the range or next structural level
Continuation Filtering: Not all sweeps lead to reversals. During strong trends:
Sweeps of minor structure in a trending market often precede continuation
Use higher timeframe structure to determine if a sweep is counter-trend (likely reversal) or with-trend (likely continuation)
Entry Refinement: In ranging markets, trade from swept lows to highs and vice versa, as institutions accumulate at the extremes.
Advanced Sweep Analysis:
Double Sweeps: When both sides of a range are swept, expect a strong breakout
Sweep Rejection Quality: Fast, strong rejections of sweeps are more reliable than slow grinding returns
Timeframe Consideration: Daily timeframe sweeps are significantly more important than 15-minute sweeps
Volume Profile: Sweeps with low volume followed by high volume reversals confirm manipulation
What Makes a High-Quality Sweep Signal: ✅ Penetrates structure by at least 0.5-1x ATR
✅ Strong rejection candle (long wick, decisive close)
✅ Occurs at a higher timeframe structural level
✅ Creates a Change of Character on the following move
✅ Sweeps an obvious level where retail stops cluster
4. Change of Character (CHOCH) - Major Reversal Signals
What It Is: A Change of Character represents the most significant shift in market dynamics—when the entire structural bias of the market flips from bullish to bearish or bearish to bullish. CHOCH signals are the crown jewel of SMC trading because they identify the exact moment when institutional positioning fundamentally changes.
The Anatomy of a CHOCH: A valid CHOCH requires a specific sequence:
Established Trend: A clear directional bias with multiple BOS in one direction
Liquidity Engineering: A sweep of structure in the current trend direction (the manipulation phase)
Structural Break: Price then breaks structure in the OPPOSITE direction (the revelation phase)
This combination shows that institutions have:
Completed their accumulation/distribution at favorable prices (via the sweep)
Shifted their positioning from bullish to bearish (or vice versa)
Begun a new directional campaign
Visual Presentation:
Bullish CHOCH (Cyan Triangle Up): Appears when bearish structure is broken after a low sweep, signaling the shift to bullish control
Bearish CHOCH (Red Triangle Down): Appears when bullish structure is broken after a high sweep, signaling the shift to bearish control
Prominent Markers: Larger and more visually distinct than BOS signals, reflecting their importance
Why CHOCH Signals Are So Powerful:
Trend Reversal Identification: They mark the earliest possible confirmation of a trend change
High Win Rate: When combined with proper risk management, CHOCH signals have among the highest success rates in SMC trading
Risk-Reward Ratio: Entering at CHOCH gives you the best possible risk-reward since you're entering at the beginning of a new trend
Institutional Confirmation: The sequence of sweep + structure break proves institutional repositioning, not just retail sentiment
Trading CHOCH Signals:
The Perfect CHOCH Setup:
Identify the Sweep: Watch for a liquidity sweep of structural lows (for bullish) or highs (for bearish)
Wait for the Break: Don't enter on the sweep—wait for structure to break in the opposite direction
CHOCH Confirmation: The indicator fires the CHOCH signal—this is your entry trigger
Entry Execution:
Aggressive: Enter immediately on CHOCH confirmation
Conservative: Wait for a pullback to the first Fair Value Gap or broken structure (now turned support/resistance)
Stop Placement: Beyond the swept liquidity point
Target Selection: Previous swing in the opposite direction, or let it run to the next CHOCH
Multiple Timeframe CHOCH Strategy: The most powerful setups occur when CHOCHs align across timeframes:
Daily CHOCH: Signals major institutional trend change, target 500+ pips (Forex) or significant point moves
4H CHOCH: Confirms daily direction, provides swing trade opportunities
1H CHOCH: Offers precise entry timing within the higher timeframe trend
15M CHOCH: Used for position scaling and intraday management
Example Trade Flow:
Daily Chart: Bullish CHOCH appears after weeks of downtrend
↓
4H Chart: Wait for pullback after the daily CHOCH, then catch the 4H bullish CHOCH
↓
1H Chart: Enter on the 1H bullish CHOCH that aligns with both higher timeframes
↓
Result: You've entered at the beginning of a major trend with multiple confirmations
CHOCH Quality Grading:
A-Grade CHOCH (Highest Probability):
Occurs at major higher timeframe structure
Following a clear liquidity sweep
Volume spike on the structural break
Multiple timeframe alignment
Creates a large Fair Value Gap on the break
B-Grade CHOCH (Good Probability):
Valid sweep and structure break
Single timeframe signal
Moderate volume
Occurs at minor structure
C-Grade CHOCH (Lower Probability):
Choppy, ranging market context
Weak sweep or unclear structure
Counter to higher timeframe trend
Low volume confirmation
Common Mistakes with CHOCH Trading: ❌ Entering on the sweep instead of waiting for the structure break
❌ Ignoring higher timeframe context
❌ Taking every CHOCH regardless of quality
❌ Not waiting for pullbacks on aggressive trends
❌ Placing stops too tight, getting caught in volatility
Advanced CHOCH Concepts:
Failed CHOCH: Occasionally, what appears to be a CHOCH will fail (price reverses back into the previous trend). This often indicates:
Insufficient institutional conviction for the reversal
Fake-out to grab liquidity in the opposite direction
Need to wait for a higher timeframe CHOCH for confirmation
When a CHOCH fails, it often sets up an even stronger continuation of the original trend.
CHOCH vs BOS Decision Matrix:
If in doubt about trend direction → wait for CHOCH
If confident in trend → trade BOS continuations
After a CHOCH → next signals in the new direction are BOS
5. Fair Value Gaps (FVG) - Institutional Retracement Zones
What It Is: Fair Value Gaps represent price imbalances where the market moved so quickly that it left behind inefficient pricing. These gaps form when there's no overlap between the current candle's wick and the candle from two bars ago—a void in the price action that creates a "gap" in the order flow.
The Institutional Logic: When institutions execute large market orders, they can push price rapidly through levels without allowing normal two-way trading. This creates unfilled orders and imbalanced order books. Institutions often return to these gaps to:
Fill additional orders at more favorable prices
Allow the market to "breathe" before the next push
Create support/resistance at the gap for the next move
Restore balance to the order book
FVG Formation Criteria: This indicator uses enhanced FVG detection logic:
Bullish FVG (Upward Gap):
Current candle's low is above the high from 2 candles ago
Creates a visible gap where no trading occurred
Gap size must exceed 30% of ATR (filtering minor gaps)
Typically forms on strong bullish momentum candles
Market moved up so fast it left unfilled sell orders
Bearish FVG (Downward Gap):
Current candle's high is below the low from 2 candles ago
Creates a visible gap where no trading occurred
Gap size must exceed 30% of ATR
Typically forms on strong bearish momentum candles
Market moved down so fast it left unfilled buy orders
Visual Presentation:
Bullish FVG Zones: Semi-transparent cyan boxes extending from gap bottom to top
Bearish FVG Zones: Semi-transparent red boxes extending from gap top to bottom
Dynamic Management: Gaps automatically removed when filled or expired
Clean Display: Only active, unfilled gaps shown to prevent chart clutter
FVG Trading Strategies:
Strategy 1: FVG Retracement Entries After a CHOCH or strong BOS, wait for price to retrace into the FVG for entry:
Identify trend direction via CHOCH or BOS
Locate the nearest FVG in the direction of the trend
Set limit orders within the FVG zone
Stop loss beyond the FVG
Target the next structural level or previous swing
Strategy 2: FVG Breakout Confirmation When price breaks through an FVG without filling it:
Signals extreme institutional urgency
Indicates the move is likely to continue strongly
The unfilled gap becomes a "no-go zone" for counter-trend entries
Strategy 3: Multiple FVG Management When multiple FVGs form in sequence:
The first FVG is most likely to be filled
If price skips the first FVG, it signals exceptional strength
Sequential gaps create a "gap ladder" for scaling into positions
FVG Quality Assessment:
High-Quality FVGs (Best Trading Zones):
Large gap size (1.5x+ ATR)
Formed on high volume impulse moves
Aligned with higher timeframe structure
Created during CHOCH or strong BOS
Positioned between current price and key structure
Low-Quality FVGs (Use Caution):
Small gaps (< 0.5 ATR)
Formed during choppy, ranging conditions
Multiple overlapping gaps in the same area
Counter to higher timeframe trend
Very old gaps (50+ bars ago)
FVG Lifecycle Management:
The indicator intelligently manages FVG zones:
Gap Filling:
Bullish FVG is "filled" when price touches the bottom of the gap
Bearish FVG is "filled" when price touches the top of the gap
Filled gaps are automatically removed from the chart
Partial fills count as complete fills (institutions got their orders)
Gap Expiration:
Gaps older than the extension period (default 10 bars) are removed
This keeps the chart clean and focuses on relevant levels
Adjustable from 5-50 bars based on timeframe and trading style
Gap Priority: When multiple gaps exist, closest gap to current price is most relevant
Advanced FVG Concepts:
Nested FVGs: Sometimes FVGs form within larger FVGs. The smaller, more recent gap typically gets filled first, providing a secondary entry within the larger gap.
FVG Clusters: When 3+ FVGs stack in the same zone, this area becomes a major institutional reaccumulation zone—excellent for swing entries.
Inverted FVGs: Bullish FVGs in downtrends or bearish FVGs in uptrends can act as resistance/support where rallies/dips fail.
FVG + Liquidity Sweep Combination: The ultimate entry setup:
Liquidity sweep occurs
CHOCH confirms reversal
Price retraces into FVG created during the CHOCH move
Enter with exceptional risk-reward ratio
FVG Statistics & Probabilities:
Research on FVG behavior shows:
Approximately 70% of FVGs get filled within 20 bars
FVGs formed during CHOCH have 80%+ fill rate
Larger gaps (2x+ ATR) have lower but higher-quality fill rates
Higher timeframe FVGs are more magnetic than lower timeframe
Timeframe Considerations:
Daily FVGs:
Can remain unfilled for weeks
Major institutional zones
Often mark the absolute best entry prices for swing trades
When filled, usually result in strong reactions
4H FVGs:
Typically fill within 3-7 days
Excellent for swing trading
Balance between frequency and reliability
1H FVGs:
Usually fill within 1-3 days
Good for short-term position trading
More frequent signals
15M FVGs:
Often fill same day
Best used for intraday refinement
Should align with higher timeframe gaps
🔧 Customization & Settings Guide
Structure Detection Settings
Swing Lookback Period (3-50 bars): This is arguably the most important setting as it determines what the indicator considers "structure."
Low Values (3-7):
Identifies minor swings and frequent structure points
More BOS and CHOCH signals
Better for scalping and day trading
Risk: More false signals in choppy markets
Best for: 15M-1H charts, active traders
Medium Values (8-15):
Balanced approach capturing meaningful swings
Default setting works well for most traders
Good signal-to-noise ratio
Best for: 1H-4H charts, swing traders
High Values (16-50):
Only major structural points identified
Fewer but higher-quality signals
Cleaner charts with less noise
Better for trending markets
Best for: 4H-Daily charts, position traders
ATR Period (1-50): Controls how volatility is measured for liquidity sweep detection.
Shorter Periods (7-14):
More responsive to recent volatility changes
Better during high volatility events
May overreact to short-term spikes
Longer Periods (15-30):
Smoother, more stable volatility measurement
Better for swing trading
Reduces sensitivity to short-term noise
Liquidity Sweep Multiplier (0.5-3.0): Determines how far beyond structure price must move to qualify as a sweep.
Low Multiplier (0.5-0.9):
Catches smaller, more frequent sweeps
More signals but lower reliability
Good for scalping or high-frequency trading
Use in ranging markets
Medium Multiplier (1.0-1.5):
Balanced sensitivity
Default 1.2 works for most situations
Good signal quality
High Multiplier (1.6-3.0):
Only major, obvious sweeps detected
Fewer but very high-quality signals
Best for trending markets
Use when you want only the clearest setups
Display Options
Toggle Controls: Each component can be individually enabled/disabled:
Show Market Structure:
Turn off when chart becomes too cluttered
Essential for understanding context, generally keep ON
Disable only when you know structure from higher timeframe
Show Liquidity Zones:
Highlights swept areas with boxes
Can be disabled if you prefer cleaner charts
Keep ON when learning to spot manipulation
Show Break of Structure:
BOS labels can be disabled if trading only reversals
Keep ON for trend following strategies
Show Change of Character:
Core SMC signal, usually keep ON
Only disable if focusing purely on continuation trading
Show Fair Value Gaps:
OFF by default to prevent overwhelming new users
Turn ON once comfortable with basic structure
Can generate many zones on lower timeframes
FVG Extension Period (5-50 bars): Determines how long unfilled gaps remain displayed.
Short Extension (5-10):
Keeps charts very clean
Only shows very recent gaps
Good for day trading
May remove gaps before they fill
Medium Extension (11-25):
Balanced approach
Captures most gap fills
Good for swing trading
Long Extension (26-50):
Shows historical gap context
Better for position trading
Higher timeframe analysis
Can make charts busy on lower timeframes
Color Scheme Customization
Why Colors Matter: Visual clarity is crucial for quick decision-making. The color scheme should:
Clearly distinguish bullish vs bearish elements
Work well with your chart background (dark/light mode)
Be visible but not distracting
Match your personal preference for aesthetics
Default Colors:
Bullish: Cyan (
#00ffff) - visibility and association with "cool" buying
Bearish: Red (
#ff0051) - visibility and universal danger/selling association
FVG Bullish: 85% transparent cyan - visible but not overpowering
FVG Bearish: 85% transparent red - visible but not overpowering
Customization Tips:
Increase transparency if zones overwhelm price action
Use higher contrast colors on light backgrounds
Keep bullish/bearish colors visually distinct
Test colors across different market conditions
Optimization by Market Type
Forex (24-hour markets):
Structure Lookback: 10-15
ATR Period: 14-21
Sweep Multiplier: 1.0-1.5
Best Timeframes: 15M, 1H, 4H
Stocks (Session-based):
Structure Lookback: 8-12
ATR Period: 14
Sweep Multiplier: 1.2-1.8
Best Timeframes: 5M, 15M, 1H, Daily
Note: Gaps at market open/close aren't FVGs
Cryptocurrency (High volatility):
Structure Lookback: 12-20 (filter noise)
ATR Period: 10-14 (responsive to volatility)
Sweep Multiplier: 1.5-2.5 (larger sweeps)
Best Timeframes: 15M, 1H, 4H
Indices (Moderate volatility):
Structure Lookback: 10-15
ATR Period: 14-20
Sweep Multiplier: 1.0-1.5
Best Timeframes: 1H, 4H, Daily
📈 Complete Trading System & Strategies
The Complete SMC Trading Process
Step 1: Higher Timeframe Analysis (Daily/4H) Begin every trading session by analyzing higher timeframes:
Identify the prevailing market structure (bullish or bearish)
Mark key swing highs and lows
Note any recent CHOCHs that signal trend changes
Identify major Fair Value Gaps that could act as targets or entry zones
Determine areas of liquidity (obvious highs/lows where stops cluster)
Step 2: Trading Timeframe Setup (1H/4H) Move to your primary trading timeframe:
Wait for alignment with higher timeframe bias
Look for CHOCH signals if expecting reversal
Look for BOS signals if expecting continuation
Identify liquidity sweeps that create trading opportunities
Note nearby FVGs for entry refinement
Step 3: Entry Timeframe Execution (15M/1H) Use lower timeframe for precise entry:
After higher timeframe signal, wait for lower timeframe confirmation
Enter on FVG fills, structure breaks, or CHOCH signals
Place stop beyond swept liquidity or broken structure
Set targets at next structure level or opposite side of range
Step 4: Management Active trade management increases profitability:
Move stop to breakeven after price moves 1R (risk unit)
Take partial profits at first target (structure level)
Let remainder run to major targets
Trail stop using FVGs or structure breaks in your direction
Exit if a counter-trend CHOCH appears
High-Probability Trading Setups
Setup 1: The Classic CHOCH Reversal
Market Context:
Extended trend in one direction
Price reaching obvious highs/lows where liquidity pools
Setup Requirements:
Liquidity sweep of the high/low
CHOCH signal fires
(Optional) Wait for pullback to FVG
Entry: On CHOCH confirmation or FVG fill
Stop: Beyond swept liquidity
Target: Previous swing in opposite direction
Example (Bullish):
Market in downtrend for 2 weeks
Price sweeps below obvious daily low
Bullish CHOCH fires (breaks previous lower high)
Enter immediately or wait for pullback to bullish FVG
Stop below swept low
Target: Previous lower high, then previous high
Risk-Reward: Typically 1:3 to 1:5+
Setup 2: BOS Continuation with FVG Entry
Market Context:
Established trend with recent CHOCH
Strong momentum in trend direction
Setup Requirements:
Recent CHOCH established trend direction
BOS signal confirms continuation
Wait for pullback into FVG created on the BOS move
Entry: Limit order within FVG zone
Stop: Beyond FVG (invalid if exceeded)
Target: Next structural level
Example (Bearish):
Bearish CHOCH 2 days ago
Price makes BOS breaking new low
Large bearish FVG created during the break
Price retraces into FVG zone
Enter short at FVG fill
Stop above FVG
Target: Next major low or daily FVG below
Risk-Reward: 1:2 to 1:4
Setup 3: Liquidity Sweep Fade
Market Context:
Ranging market between defined highs/lows
Obvious liquidity on both sides of range
Setup Requirements:
Clear range established (minimum 20-30 bars)
Price sweeps one side of range (high or low)
Strong rejection back into range
Entry: After sweep rejection confirmed
Stop: Beyond swept level
Target: Opposite side of range
Example:
Range between 1.0850-1.0920 (EUR/USD)
Price sweeps above 1.0920 to 1.0935
Strong bearish rejection candle back below 1.0920
Enter short at 1.0915
Stop at 1.0940 (above sweep high)
Target: 1.0850 (range low)
Risk-Reward: 1:2.6
Setup 4: Multi-Timeframe CHOCH Alignment
Market Context:
Major trend change occurring
Multiple timeframes showing reversal signals
Setup Requirements:
Daily timeframe shows CHOCH
Wait for 4H CHOCH in same direction
Enter on 1H CHOCH that aligns
Entry: 1H CHOCH confirmation
Stop: Below 4H structure
Target: Daily structural level
Example (Bullish):
Daily bearish trend for months
Daily bullish CHOCH appears
4H shows bullish CHOCH next day
1H bullish CHOCH provides entry
Enter long on 1H signal
Stop: Below 4H swing low
Target: Daily previous high
Risk-Reward: 1:5 to 1:10+
Position: Larger size due to alignment
Setup 5: Failed CHOCH Continuation
Market Context:
Strong trend temporarily looks like reversing
"False" CHOCH creates trap for counter-trend traders
Setup Requirements:
Apparent CHOCH against main trend
Price fails to follow through
Original trend resumes with strong BOS
Entry: On BOS in original trend direction
Stop: Recent swing
Target: Extension of original trend
Example:
Strong daily uptrend
Bearish CHOCH appears (potential reversal)
Price consolidates but doesn't follow through down
Bullish BOS breaks above recent consolidation
Enter long on BOS
Stop: Below failed CHOCH low
Target: New high extension
Risk-Reward: 1:3 to 1:6
Note: Failed reversals often lead to explosive continuations
Risk Management Framework
Position Sizing: Never risk more than 1-2% of account per trade, even on A+ setups.
Risk Calculation:
Position Size = (Account Size × Risk %) / (Entry - Stop Loss in pips/points)
Example:
Account: $10,000
Risk: 1% = $100
Entry: 1.0900
Stop: 1.0870 (30 pips)
Position Size: $100 / 30 pips = $3.33 per pip
Lot Size (Forex): 0.33 lots
Stop Loss Placement:
For CHOCH Reversals:
Place stop 5-10 pips beyond swept liquidity
Gives room for volatility while protecting capital
If swept liquidity is violated, setup is invalidated
For BOS Continuations:
Place stop beyond the FVG or structure that provided entry
Typically tighter stops (closer to entry)
Can trail stop to breakeven quickly
For Range Trading:
Stop beyond the swept level
Generally tight stops work well in ranges
Exit quickly if range boundaries break
Take Profit Strategy:
Scaling Out Method (Recommended):
First Target (50% of position): First structural level (1:1 to 1:2)
Second Target (30% of position): Major structure (1:3 to 1:5)
Trail Stop (20% of position): Let run to full extension
Full Exit Method:
Hold entire position to predetermined target
Requires more discipline
Higher reward but also higher risk of giveback
Trade Management Rules:
Breakeven Rule: Move stop to breakeven after 1R profit
Partial Profit Rule: Take partials at structure levels
Trailing Rule: Trail stop

Trade Manager + MOST RSI📌 Trade Manager + MOST RSI — Adaptive Position Management Strategy
Overview
This strategy combines the MOST‑RSI trend‑reversal model with a fully customizable position management system.
It is designed for traders who want a flexible, visual, and systematic approach to scaling into positions, managing risk, and automating exits.
The script supports both automatic entries (based on MOST‑RSI signals) and manual entries (user‑defined price levels), making it suitable for hybrid discretionary + algorithmic trading.
✨ Key Features
MOST‑RSI Entry Logic
Adaptive RSI‑based trend detection
VAR‑smoothed moving average
Automatic LONG/SHORT signal generation
Configurable sensitivity through MOST Percent, MA Type, and RSI Length
Smart Position Management
Initial order + cascading Safety Orders (SO)
Adjustable deviation, step scaling, and volume scaling
Independent LONG and SHORT deviation settings
Breakeven after N safety orders
Automatic TP placement based on average entry price
Clean Visual Structure
TP lines visible only when a position is open
NEXT SO level with dynamic labeling
Average price line with subtle styling
Transparent background zones for TP, SO, and AVG
Real‑time mini‑table showing position metrics
Manual Entry Mode
Set custom LONG/SHORT entry levels
Automatic line drawing
One‑click reset
Perfect for discretionary setups
📊 Recommended Timeframes
1H — balanced
4H — conservative
MOST‑RSI adapts well across different market conditions.
🔧 Optimization Recommendations
1. Deviation (%)
Trending markets: 4–7%
Ranging markets: 2–3%
Optimize LONG and SHORT separately
2. Safety Order Volume Scale
Typical range: 1.3–1.6
Higher = faster averaging, higher risk
3. Safety Order Step Scale
1.4–1.7 for safer spacing
1.1–1.3 for tighter spacing
4. Take‑Profit
Volatile assets: 2–5%
Stable assets: 1.5–2%
5. Risk Management
Max SO: 5–10 depending on volatility
More SO = safer but more capital required
6. MOST‑RSI Parameters
RSI Length: 14
MA Length: 5
MOST Percent: 7–12%
7. Backtesting
Use at least 1 year of data
Include high‑volatility periods
8. Drawdown Control
If drawdown is too high:
Lower SO volume scale
Reduce max SO
Increase SO step scale
📌 Disclaimer
This script does not guarantee profits and is not financial advice.
Always test strategies on historical data and use proper risk management.

world market Zones (IST) + Prev Day S/R + Pivot🧠 PART 1 — SESSION VOLATILITY ENGINE (SCRIPT 1)
This part does time-based market behavior mapping, not price indicators.
✅ What it Detects
All times are locked to IST (Asia/Kolkata):
Zone Purpose Why it matters
London (13:00–17:30) EU money flow Trend initiations often start here
NY (18:30–23:30) US volatility Expansion + reversals
Overlap (17:30–21:30) Highest liquidity window Breakouts + fakeouts
EIA (Wed 20:30–21:30) Crude inventory release Explosive oil moves
IMPORTANT FOR ANALYSING session START SHOCK POINTS.
🧠 What this section REALLY gives you
You now see:
When liquidity enters
When algos reset
When news shock candles form
Where false breakouts happen (often at session flips)
This is behavioral timing, not lagging math.
Not suitable for:
1D+ charts (session logic loses meaning)
Assets without clear London/NY behavior
🏆 What type of trader this script is for
This is NOT indicator trading.
This is for traders who:
✔ Trade liquidity sweeps
✔ Watch session opens
✔ Understand dealer positioning
✔ Trade crude, indices, forex
It’s basically a smart money timing + institutional level combo.
HAPPY TRADING

Smart RSI Candles [DotGain]Smart RSI Candles – Description
Smart RSI Candles is a minimalist yet powerful overlay indicator that visualizes RSI conditions directly on price candles. Instead of plotting a separate RSI oscillator, this tool colors the chart bars based on customizable RSI threshold levels, allowing traders to instantly identify overbought and oversold regimes within the price action itself.
The indicator is built on the classic Wilder RSI and supports up to three upper (overbought) and three lower (oversold) levels. Each level can be individually enabled or disabled, making the indicator fully modular and adaptable to different trading styles and market conditions.
Key Features
RSI-based candle coloring (no separate panel required)
Up to 6 customizable RSI levels
Individual On/Off toggle for each level
Extreme conditions highlighted in blue
Works on any market and timeframe
Clean, non-intrusive visual design
Color Logic
Overbought (Upper Levels)
Level 1: Light green → mild overbought
Level 2: Dark green → strong overbought
Level 3: Blue → extreme overbought
Oversold (Lower Levels)
Level 1: Light red → mild oversold
Level 2: Dark red → strong oversold
Level 3: Blue → extreme oversold
Neutral RSI values keep the original candle color.
How to Use
Use upper levels to identify potential exhaustion in bullish moves.
Use lower levels to spot potential panic or capitulation zones.
Combine with trend analysis, support/resistance, or volume for confirmations.
Disable specific levels to create conservative or aggressive RSI regimes.
Use Cases
Mean reversion strategies
Momentum exhaustion detection
Visual risk regime mapping
Multi-timeframe RSI context
Smart RSI Candles is designed for traders who want RSI information integrated directly into price, without clutter — fast, intuitive, and highly customizable.
Have fun :)
Disclaimer
This Smart RSI Candles indicator is provided for informational and educational purposes only. It does not, and should not be construed as, financial, investment, or trading advice.
This indicator is an independent implementation of a Relative Strength Index (RSI) based visualization tool and is not affiliated with, or endorsed by, any third-party trading systems, strategies, or trademarked methodologies. The colored candles displayed by this indicator are generated by a predefined set of algorithmic conditions based on RSI threshold levels. They do not constitute a direct recommendation to buy or sell any financial instrument.
All trading and investing in financial markets involves a substantial risk of loss. You may lose part or all of your invested capital. Past performance does not guarantee future results. This indicator highlights potential overbought and oversold market conditions and may produce false, lagging, or misleading signals. Market conditions can change rapidly and remain irrational longer than expected.
The creator DotGain assumes no responsibility or liability for any financial losses, damages, or decisions made based on the use of this indicator or the information it provides.You are solely responsible for your own trading and investment decisions. Always conduct your own research (DYOR), use proper risk management, validate signals with additional tools or analysis, and consider your personal financial situation and risk tolerance before entering any trade.
