teril 1H EMA50 Harami Reversal Alerts BB Touch teril Harami Reversal Alerts BB Touch (Wick Filter Added + 1H EMA50)
teril Harami Reversal Alerts BB Touch (Wick Filter Added + 1H EMA50)
teril Harami Reversal Alerts BB Touch (Wick Filter Added + 1H EMA50)
teril Harami Reversal Alerts BB Touch (Wick Filter Added + 1H EMA50)
ค้นหาในสคริปต์สำหรับ "alert"

teril Harami Reversal Alerts BB Touch (Wick Filter Added) teril Harami Reversal Alerts BB Touch (Wick Filter Added)
teril Harami Reversal Alerts BB Touch (Wick Filter Added) teril Harami Reversal Alerts BB Touch (Wick Filter Added) teril Harami Reversal Alerts BB Touch (Wick Filter Added)
teril Harami Reversal Alerts BB Touch (Wick Filter Added)

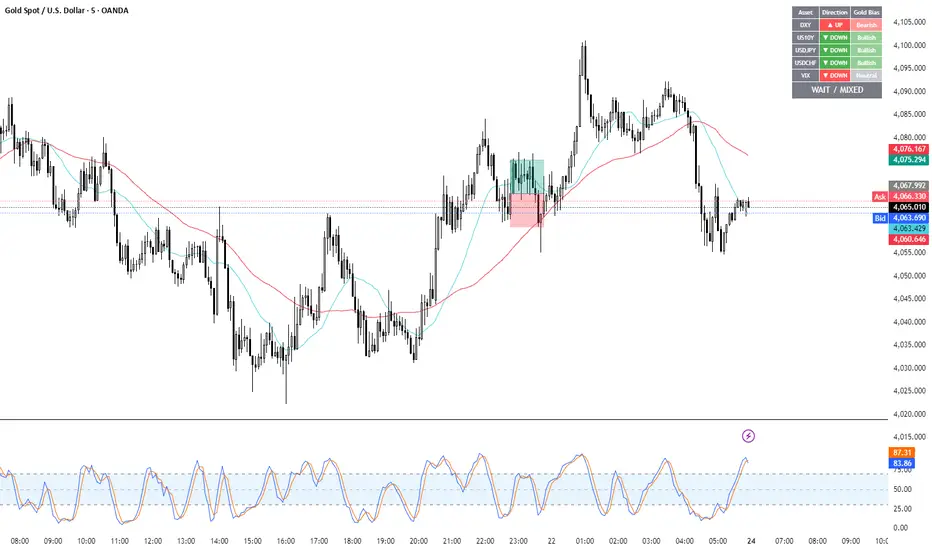
Gold Correlation Dashboard + Alerts [XAUUSD Helper]這是一個專為黃金 (XAUUSD) 交易者設計的 **跨市分析儀表板 (Intermarket Correlation Dashboard)**。
這個指標的核心邏輯基於基本面與資金流向,協助交易者在 10 秒內快速判斷黃金的當前趨勢。它自動監控與黃金高度負相關的資產(美元、美債、日圓),並在圖表上直接顯示多空傾向。
### 📊 監控資產與邏輯
本腳本即時抓取以下關鍵市場數據,並分析其對黃金的影響:
1. **DXY (美元指數)**:黃金最大競爭對手。
- DXY 跌 📉 → 黃金偏多
- DXY 漲 📈 → 黃金偏空
2. **US10Y (10年期美債殖利率)**:黃金的持有成本指標。
- 殖利率跌 📉 → 黃金偏多
- 殖利率漲 📈 → 黃金偏空
3. **USDJPY (美日)** & **USDCHF (美瑞)**:避險資金流向參考。
- 匯率跌 (日圓/瑞郎強) 📉 → 黃金偏多
4. **VIX (恐慌指數)**:市場情緒指標。
- VIX 飆升 📈 → 黃金通常受惠 (避險屬性)
### 🚀 主要功能
1. **即時儀表板**:無需切換視窗,直接在黃金圖表角落查看所有關鍵資產的漲跌狀態。
2. **智能信號總結**:
- 系統會自動計算 **DXY + US10Y + USDJPY** 的綜合方向。
- 當這三大核心指標方向一致時,系統會顯示 **★ STRONG BUY (強力做多)** 或 **★ STRONG SELL (強力做空)**。
- 根據歷史經驗,當這三者同步時,趨勢準確度極高。
3. **警報系統 (Alerts)**:
- 內建警報功能,當出現「強力做多」或「強力做空」信號時,可設定推播通知,不錯過進場機會。
### ⚙️ 如何使用
- 將此指標加載到 XAUUSD (黃金) 的圖表上。
- 建議搭配 H1, H4 或 Daily 時框使用。
- **綠色背景** = 利多黃金 (Bullish)
- **紅色背景** = 利空黃金 (Bearish)
---
*免責聲明:此腳本僅供輔助分析與教育用途,不構成任何投資建議。交易請做好風險控管。*
**Gold (XAUUSD) Intermarket Correlation Dashboard & Alerts**
This indicator is designed for Gold traders who want to combine Technical Analysis with **Fundamental Intermarket Analysis**. It provides a real-time dashboard overlay that monitors key assets highly correlated with XAUUSD.
According to market logic, Gold is heavily influenced by the US Dollar (DXY), US Treasury Yields (US10Y), and global risk sentiment (USDJPY/VIX). This script helps you spot the trend in seconds.
### 📊 Monitored Assets & Logic
The dashboard tracks the real-time direction of the following assets and calculates their impact on Gold:
1. **DXY (US Dollar Index)**: Inverse correlation.
* DXY ↓ = Bullish for Gold
* DXY ↑ = Bearish for Gold
2. **US10Y (US 10-Year Treasury Yield)**: Inverse correlation (Cost of Holding).
* Yields ↓ = Bullish for Gold
* Yields ↑ = Bearish for Gold
3. **USDJPY & USDCHF**: Risk sentiment and currency flow.
* Pair ↓ (Strong JPY/CHF) = Bullish for Gold
4. **VIX (Volatility Index)**: Fear gauge.
* VIX ↑ = Generally Bullish for Gold (Safe Haven demand)
### 🚀 Key Features
**1. Real-Time Dashboard**
View the status of all 5 key assets directly on your XAUUSD chart without switching tabs. The dashboard indicates the "Gold Bias" (Bullish/Bearish) for each asset based on the current timeframe.
**2. Smart Bias Signal ("The 3-Storyline Confirmation")**
The script automatically analyzes the three most critical indicators: **DXY, US10Y, and USDJPY**.
* **★ STRONG BUY ★**: When DXY, US10Y, and USDJPY are **ALL Falling** simultaneously. (High probability setup).
* **★ STRONG SELL ★**: When DXY, US10Y, and USDJPY are **ALL Rising** simultaneously.
**3. Integrated Alerts**
Never miss a setup. You can set alerts to notify you immediately when the "Strong Buy" or "Strong Sell" conditions are met.
### ⚙️ How to Use
1. Add this script to your XAUUSD chart.
2. Works best on H1, H4, or Daily timeframes.
3. Look for the **Summary Row** at the bottom of the dashboard:
* **Green (Strong Buy)**: Look for Long entries.
* **Red (Strong Sell)**: Look for Short entries.
---
*Disclaimer: This script is for educational and informational purposes only. It does not constitute financial advice. Always manage your risk.*
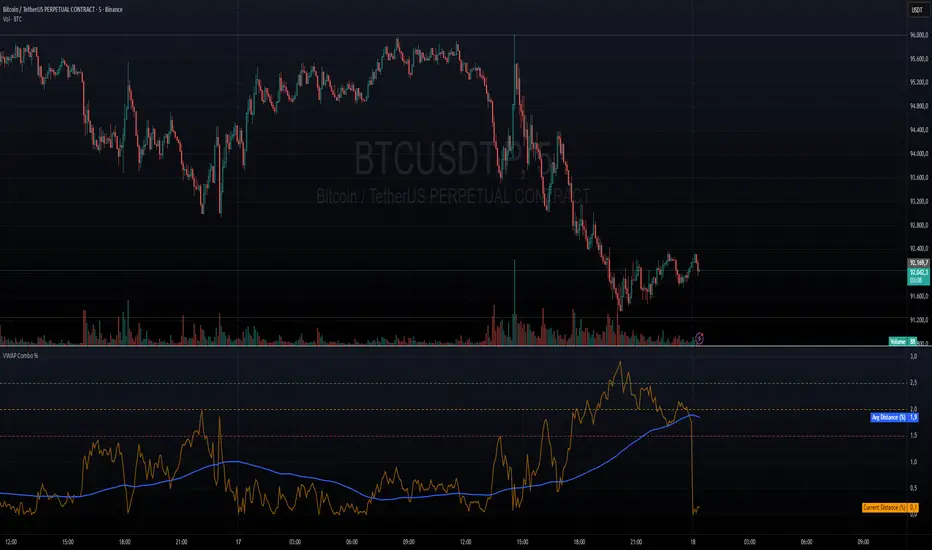
VWAP + VWAP Distance Avg + Alert Lines (%)VWAP Distance & Average Distance Indicator – Detailed Description
The VWAP + VWAP Distance Avg + Alert Lines (%) indicator is designed to measure the distance of the current price from the VWAP (Volume Weighted Average Price), as well as the average distance over a specified period. This tool is particularly useful for traders who use the VWAP as a magnet for price, helping to identify potential trend changes and areas where price may revert toward the VWAP.
Key Features
Current Distance (%)
Calculates the absolute percentage difference between the current price and the VWAP
This line shows how far the price has moved away from the VWAP at any given moment.
Average Distance (%)
Calculates a simple moving average (SMA) of the distance over a specified lookback period.
This provides a reference for typical price deviations from the VWAP, helping traders assess whether the current distance is unusually high or low.
Alert Lines (%)
Allows up to three customizable horizontal alert lines, which can be turned on or off individually.
Each line can be configured with:
Value in percent.
Color.
Line thickness.
These lines serve as visual thresholds, helping traders detect extreme deviations from the VWAP that may precede trend reversals.
Use Case – Detecting Potential Trend Changes
Traders often treat the VWAP as a price magnet, where price tends to revert after significant deviations.
When the current distance exceeds typical average levels or crosses an alert line, it can signal that the price may revert toward the VWAP, potentially indicating a shift in trend or a high-probability mean-reversion scenario.
Disclaimer
This indicator is provided for educational and analytical purposes only. It does not constitute financial advice, and trading decisions are always the sole responsibility of the individual trader. Users should carefully evaluate market conditions and their own risk tolerance before taking any trade.
Better used with VWAP on chart , and be careful around the end of session, for now this works just for session...
still improving on this....
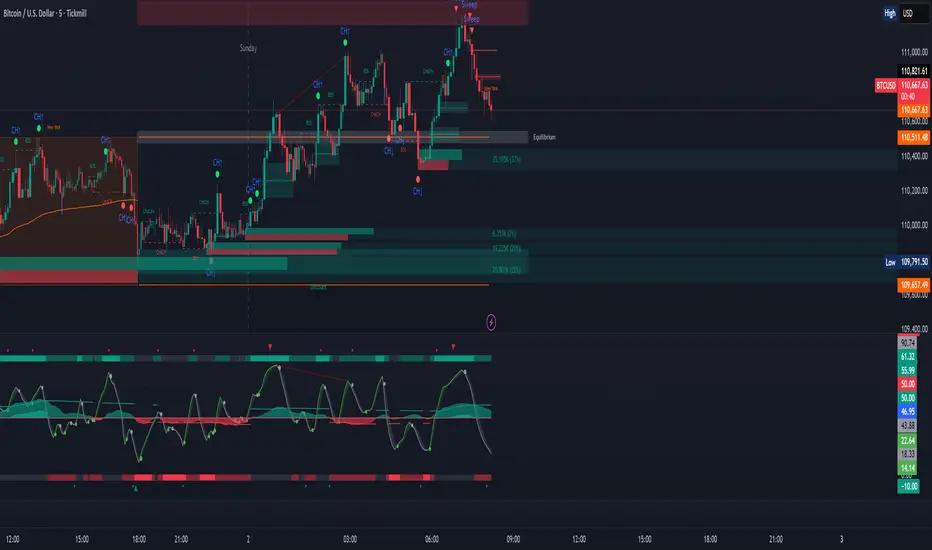
ICT Sweep + CHoCH + FVG Alerts
### 🔥 ICT Sweep + CHoCH + FVG Alerts
Script designed to automate ICT entry confirmations using:
• Liquidity Sweep (Buy/Sell Stops taken)
• Change of Character (CHoCH)
• Fair Value Gap (FVG) confirmation
### ✅ Conditions
**Long signal when:**
1. Bearish liquidity sweep
2. Bullish CHoCH
3. Bullish FVG forms and gets respected
**Short signal when:**
1. Bullish liquidity sweep
2. Bearish CHoCH
3. Bearish FVG forms and gets respected
### 🎯 Purpose
This script helps traders detect smart-money setup entries based on ICT logic and receive alerts in real time.
### 📡 Alerts
Supports webhook automation for bots, signal servers, or trading platforms.
*This script does not place trades automatically, alerts only.*
### ⚠️ Disclaimer
This tool is for educational purposes.
Always backtest and use proper risk management.
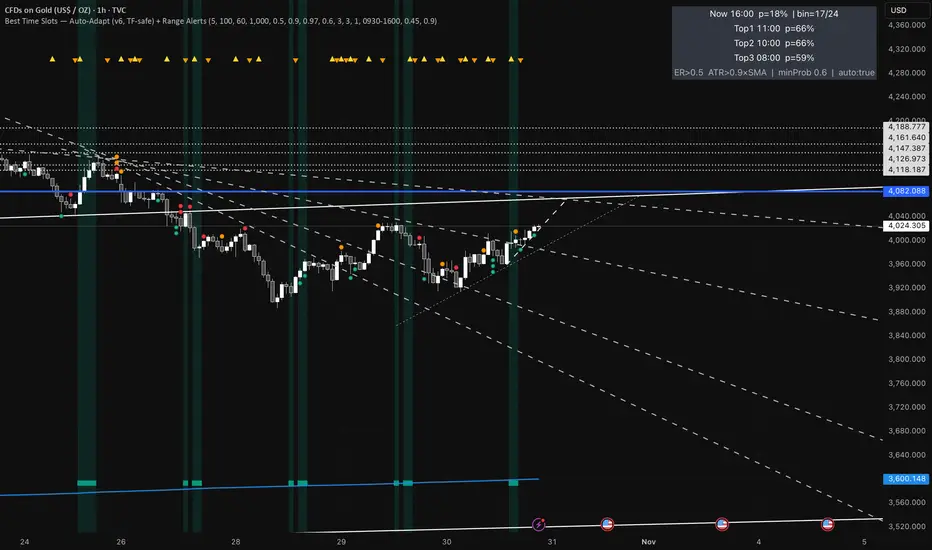
Best Time Slots — Auto-Adapt (v6, TF-safe) + Range AlertsTime & binning
Auto-adapt to timeframe
Makes all time windows scale to your chart’s bar size (so it “just works” on 1m, 15m, 4H, Daily).
• On = recommended. • Off = fixed default lengths.
Minimum Bin (minutes)
The size of each daily time slot we track (e.g., 5-min bins). The script uses the larger of this and your bar size.
• Higher = fewer, broader slots; smoother stats. • Lower = more, narrower slots; needs more history.
• Try: 5–15 on intraday, 60–240 on higher TFs.
Lookback windows (used when Auto-adapt = ON)
Target ER Window (minutes)
How far back we look to judge Efficiency Ratio (how “straight” the move was).
• Higher = stricter/smoother; fewer bars qualify as “movement”. • Lower = more sensitive.
• Try: 60–120 min intraday; 240–600 min for higher TFs.
Target ATR Window (minutes)
How far back we compute ATR (typical range).
• Higher = steadier ATR baseline. • Lower = reacts faster.
• Try: 30–120 min intraday; 240–600 min higher TFs.
Target Normalization Window (minutes)
How far back for the average ATR (the baseline we compare to).
• Higher = stricter “above average range” check. • Lower = easier to pass.
• Try: ~500–1500 min.
What counts as “movement”
ER Threshold (0–1)
Minimum efficiency a bar must have to count as movement.
• Higher = only very “clean, one-direction” bars count. • Lower = more bars count.
• Try: 0.55–0.65. (0.60 = balanced.)
ATR Floor vs SMA(ATR)
Requires range to be at least this many × average ATR.
• Higher (e.g., 1.2) = demand bigger-than-usual ranges. • Lower (e.g., 0.9) = allow smaller ranges.
• Try: 1.0 (above average).
How history is averaged
Recent Days Weight (per-day decay)
Gives more weight to recent days. Example: 0.97 ≈ each day old counts ~3% less.
• Higher (0.99) = slower fade (older days matter more). • Lower (0.95) = faster fade.
• Try: 0.97–0.99.
Laplace Prior Seen / Laplace Prior Hit
“Starter counts” so early stats aren’t crazy when you have little data.
• Higher priors = probabilities start closer to average; need more real data to move.
• Try: Seen=3, Hit=1 (defaults).
Min Samples (effective)
Don’t highlight a slot unless it has at least this many effective samples (after decay + priors).
• Higher = safer, but fewer highlights early.
• Try: 3–10.
When to highlight on the chart
Min Probability to Highlight
We shade/mark bars only if their slot’s historical movement probability is ≥ this.
• Higher = pickier, fewer highlights. • Lower = more highlights.
• Try: 0.45–0.60.
Show Markers on Good Bins
Draws a small square on bars that fall in a “good” slot (in addition to the soft background).
Limit to market hours (optional)
Restrict to Session + Session
Only learn/score inside this time window (e.g., “0930-1600”). Uses the chart/exchange timezone.
• Turn on if you only care about RTH.
Range (chop) alerts
Range START if ER ≤
Triggers range when efficiency drops below this level (price starts zig-zagging).
• Higher = easier to call “range”. • Lower = stricter.
Range START if ATR ≤ this × SMA(ATR)
Also triggers range when ATR shrinks below this fraction of its average (volatility contraction).
• Higher (e.g., 1.0) = stricter (must be at/under average). • Lower (e.g., 0.9) = easier to call range.
Alerts on bar close
If ON, alerts fire once per bar close (cleaner). If OFF, they can trigger intrabar (faster, noisier).
Quick “what happens if I change X?”
Want more highlighted times? ↓ Min Probability, ↓ ER Threshold, or ↓ ATR Floor (e.g., 0.9).
Want stricter highlights? ↑ Min Probability, ↑ ER Threshold, or ↑ ATR Floor (e.g., 1.2).
Want recent days to matter more? ↑ Recent Days Weight toward 0.99.
On 4H/Daily, widen Minimum Bin (e.g., 60–240) and maybe lower Min Probability a bit.
HA Color Change Alerts (fixed v3)📌 Heikin Ashi Color Change Alerts
This indicator notifies you whenever a Heikin Ashi candle changes color (from red → green or green → red).
🔎 Features
Automatic Heikin Ashi calculation
Uses TradingView’s built-in Heikin Ashi source, so you don’t need to switch your chart to HA candles.
Signals on chart
Plots ▲ (green triangle) when HA changes from red → green and ▼ (red triangle) when HA changes from green → red.
Customizable alerts
You can set TradingView alerts for:
“Heikin Ashi Turned GREEN”
“Heikin Ashi Turned RED”
Options
Show/Hide the Heikin Ashi candles on top of your normal chart.
Choose whether alerts trigger only after bar close, or intrabar as soon as the color flips.
Show or hide the signal markers.
🔔 Use cases
Trend following: enter when HA flips to green, exit when it flips back to red.
Early reversal spotting: get notified when the candle momentum shifts.
Works on any symbol and timeframe.

Pro Market Toolkit (TH) v2.4 — S/R + Zones + ATR Bands + Alertsรายละเอียด (ภาษาไทย):
อินดิเคเตอร์ชุดเครื่องมือครบวงจรสำหรับนักเทรด
คำนวณ แนวรับ–แนวต้าน (Support / Resistance) อัตโนมัติจากสวิง (Pivot High/Low)
สร้าง Supply/Demand Zones จาก ATR เพื่อหาพื้นที่กลับตัวสำคัญ
วาดเส้น Moving Average และ ATR Bands เพื่อประเมินแนวโน้มและความผันผวน
แสดงสัญญาณ Breakout และ Bounce/Reject อย่างชัดเจนบนกราฟ
รองรับ Alerts สำหรับ 4 เงื่อนไขสำคัญ: Breakout ขึ้น/ลง, Demand Bounce, Supply Reject
มีตารางแสดง Trend และค่า ATR ปัจจุบัน
เหมาะสำหรับผู้ที่ต้องการดูแนวโน้ม, หาจุดเข้า/ออก และรับการแจ้งเตือนอัตโนมัติ โดยไม่ต้องเฝ้ากราฟตลอดเวลา
Description (English):
A comprehensive trading toolkit indicator for professional traders.
Automatically detects Support/Resistance levels using swing pivots
Generates Supply/Demand Zones based on ATR to highlight potential reversal areas
Plots Moving Average and ATR Bands for trend and volatility analysis
Displays clear signal markers for Breakouts and Zone Bounces/Rejects
Provides Alerts for 4 key conditions: Breakout Up/Down, Demand Bounce, Supply Reject
Includes an on-chart table showing the current Trend and ATR value
Ideal for traders who want automatic key levels, zones, and signal alerts without the need to monitor the chart constantly.

💎 ENJOYBLUE ⏰ Open Price AlertThis Pine Script (version 6) is designed for TradingView to monitor the closing of a user-selected Timeframe (TF) — for example, M30, H1, H4, or D1 — and trigger an alert immediately when that TF’s candle closes. Along with the alert, it displays the current open prices from four higher-level timeframes:
Open MN: Open price of the current monthly candle
Open W1: Open price of the current weekly candle
Open D1: Open price of the current daily candle
Open H4: Open price of the current 4-hour candle
The alert message is formatted into a single compact line to ensure it is fully visible on mobile devices!
~ENJOYBLUE 💎

Smart RSI Divergence PRO | Auto Lines + Alerts📌 Purpose
This indicator automatically detects Regular and Hidden RSI Divergences between price action and the RSI oscillator.
It plots divergence lines directly on the chart, labels signals, and includes alerts for automated monitoring.
🧠 How It Works
1. RSI Calculation
RSI is calculated using the selected Source (default: Close) and RSI Length (default: 14).
2. Divergence Detection via Fractals
Swing points on both price and RSI are detected using fractal logic (5-bar patterns).
Regular Divergence:
Bearish: Price forms a higher high, RSI forms a lower high.
Bullish: Price forms a lower low, RSI forms a higher low.
Hidden Divergence:
Bearish: Price forms a lower high, RSI forms a higher high.
Bullish: Price forms a higher low, RSI forms a lower low.
3. Auto Drawing Lines
Lines are drawn automatically between divergence points:
Red = Regular Bearish
Green = Regular Bullish
Orange = Hidden Bearish
Blue = Hidden Bullish
Line width and transparency are adjustable.
4. Labels and Alerts
Labels mark divergence points with up/down arrows.
Alerts trigger for each divergence type.
📈 How to Use
Use Regular Divergences to anticipate trend reversals.
Use Hidden Divergences to confirm trend continuation.
Combine with support/resistance, trendlines, or volume for higher probability setups.
Recommended Timeframes: Works on all timeframes; more reliable on 1h, 4h, and Daily.
Markets: Forex, Crypto, Stocks.
⚙️ Inputs
Source (Close, HL2, etc.)
RSI Length
Toggle Regular / Hidden Divergence visibility
Toggle Lines / Labels
Line Width & Line Transparency
⚠️ Disclaimer
This script is for educational purposes only. It does not constitute financial advice.
Always test thoroughly before using in live trading.

EMA 8/21/50 + VWAP Crossover Alert IndicatorOverview of the Indicator
This is a custom Pine Script v5 indicator for TradingView titled "EMA 8/21/50 + VWAP Crossover Alert Indicator" (short title: "EMA+VWAP Cross Alert"). It's designed as an overlay indicator, meaning it plots directly on your price chart rather than in a separate pane. The primary purpose is to detect and alert on crossovers between the 8-period Exponential Moving Average (EMA) and the 21-period EMA, which can signal potential bullish or bearish momentum shifts. These are classic short-term trend reversal or continuation signals often used in trading strategies like momentum or swing trading.
To enhance analysis, it also includes:
A 50-period EMA for medium-term trend context (e.g., to confirm if the overall trend aligns with the crossover).
A Volume Weighted Average Price (VWAP) line, which provides a benchmark for the average price weighted by volume, useful for identifying intraday value areas or fair price levels.
The indicator works across all timeframes (e.g., Daily, 4H, 1H, 15M, 5M, 3M) because the calculations are based on the chart's current bars and adapt to volatility and data resolution. It's not a trading strategy (no entry/exit logic or backtesting), but an alert tool—signals are visual and can trigger notifications in TradingView. Always combine it with risk management, as crossovers can produce false signals in ranging or choppy markets.

A.K Dynamic EMA/SMA / MTF S&R Zones Toolkit with AlertsThe A.K Dynamic EMA/SMA / MTF Support & Resistance Zones Toolkit is a powerful all-in-one technical analysis tool designed for traders who want a clean yet comprehensive market view. Whether you're scalping lower timeframes or swing trading higher timeframes, this indicator gives you both the structure and signals to take action with confidence.
Key Features:
✅ Customizable EMA/SMA Suite
Display key Exponential and Simple Moving Averages including 5, 9, 20, 50, 100, and 200 EMAs, plus optional 50 SMA for trend filtering. Each line can be toggled individually and color-customized.
✅ Multi-Timeframe Support & Resistance Zones
Automatically detects dynamic S/R zones on key timeframes (5min, 15min, 30min, 1H, 4H, 1D) using swing highs/lows. Zones are color-coded by strength and whether they're broken or active, providing a clear visual roadmap for price reaction levels.
✅ Zone Strength & Break Detection
Distinguishes between strong and weak zones based on price proximity and reaction depth, with visual shading and automatic label updates when a level is broken.
✅ Price Action-Based Buy/Sell Signals
Generates BUY signals when bullish candles react to strong support (supply) zones, and SELL signals when bearish candles react to strong resistance (demand) zones. All logic is adjustable — including candle body vs wick detection, tolerance range, and strength thresholds.
✅ Alerts Engine
Built-in TradingView alerts for price touching support/resistance or triggering buy/sell signals. Perfect for automation or hands-free monitoring.
✅ Optional Candle & Trend Filters
Highlight bullish/bearish candles visually for additional confirmation.
Optional RSI display and 50-period SMA trend filter to guide directional bias.
🧠 Use Case Scenarios:
Identify dynamic supply & demand zones across multiple timeframes.
Confirm trend direction with EMAs and SMA filters.
React quickly to clean BUY/SELL signals based on actual price interaction with strong zones.
Customize it fully to suit scalping, day trading, or swing trading strategies.
📌 Recommended Settings:
Use default zone transparency (65%) and offset (250 bars) for optimal visual clarity.
Enable alerts to get notified when price enters key S/R levels or when a trade signal occurs.
Combine this tool with your entry/exit plan for better decision-making under pressure.
💡 Pro Tip: Add this indicator to a clean chart and let the zones + EMAs guide your directional bias. Use alerts to avoid screen-watching and improve discipline.
Created by:
Version: Pine Script v6
Platform: TradingView

MACD Bullish Cross Alert📘 Indicator Description – MACD Bullish Cross Alert
This indicator is designed to detect bullish momentum shifts using the classic MACD (Moving Average Convergence Divergence) crossover strategy.
Key Features:
Calculates the MACD Line and Signal Line using customizable inputs (default: 12, 26, 9).
Triggers an alert when the MACD Line (blue) crosses above the Signal Line (orange).
Helps identify early bullish trend reversals or momentum entry points.
Ideal for swing traders, position traders, and crypto investors using the weekly timeframe.
How to Use:
Add to any chart and set the timeframe to 1W (weekly).
Create an alert using the built-in MACD Bullish Crossover condition.
Combine with price action, volume, or RSI for higher conviction entries.
Use Cases:
Spotting early entry points after long downtrends.
Confirming a trend reversal in high timeframes.
Generating high-probability entries in trend-following systems.

ORB with Alerts - Current Day OnlyORB with Alerts - Current Day Only
This script plots the Opening Range Breakout (ORB) levels and provides alerts when price breaks above or below the range. It is designed for intraday trading and resets daily.
How It Works:
The ORB time in settings should be set to 15 minutes.
The Session Time should be set to 09:30 - 09:45.
The script marks the high and low of the ORB period and tracks price action for breakouts.
Alerts trigger when price crosses above the ORB high or below the ORB low.
This tool helps traders identify breakout opportunities based on early price action, aiding in momentum-based strategies
RSI Failure Swing Pattern (with Alerts & Targets)RSI Failure Swing Pattern Indicator – Detailed Description
Overview
The RSI Failure Swing Pattern Indicator is a trend reversal detection tool based on the principles of failure swings in the Relative Strength Index (RSI). This indicator identifies key reversal signals by analyzing RSI swings and confirming trend shifts using predefined overbought and oversold conditions.
Failure swing patterns are one of the strongest RSI-based reversal signals, initially introduced by J. Welles Wilder. This indicator detects these patterns and provides clear buy/sell signals with labeled entry, stop-loss, and profit target levels. The tool is designed to work across all timeframes and assets.
How the Indicator Works
The RSI Failure Swing Pattern consists of two key structures:
1. Bullish Failure Swing (Buy Signal)
Occurs when RSI enters oversold territory (below 30), recovers, forms a higher low above the oversold level, and finally breaks above the intermediate swing high in RSI.
Step 1: RSI dips below 30 (oversold condition).
Step 2: RSI rebounds and forms a local peak.
Step 3: RSI retraces but does not go below the previous low (higher low confirmation).
Step 4: RSI breaks above the previous peak, confirming a bullish trend reversal.
Buy signal is triggered at the breakout above the RSI peak.
2. Bearish Failure Swing (Sell Signal)
Occurs when RSI enters overbought territory (above 70), declines, forms a lower high below the overbought level, and then breaks below the intermediate swing low in RSI.
Step 1: RSI rises above 70 (overbought condition).
Step 2: RSI declines and forms a local trough.
Step 3: RSI bounces but fails to exceed the previous high (lower high confirmation).
Step 4: RSI breaks below the previous trough, confirming a bearish trend reversal.
Sell signal is triggered at the breakdown below the RSI trough.
Features of the Indicator
Custom RSI Settings: Adjustable RSI length (default 14), overbought/oversold levels.
Buy & Sell Signals: Buy/sell signals are plotted directly on the price chart.
Entry, Stop-Loss, and Profit Targets:
Entry: Price at the breakout of the RSI failure swing pattern.
Stop-Loss: Lowest low (for buy) or highest high (for sell) of the previous two bars.
Profit Targets: Two levels calculated based on Risk-Reward ratios (1:1 and 1:2 by default, customizable).
Labeled Price Levels:
Entry Price Line (Blue): Marks the point of trade entry.
Stop-Loss Line (Red): Shows the calculated stop-loss level.
Target 1 Line (Orange): Profit target at 1:1 risk-reward ratio.
Target 2 Line (Green): Profit target at 1:2 risk-reward ratio.
Alerts for Trade Execution:
Buy/Sell signals trigger alerts for real-time notifications.
Alerts fire when price reaches stop-loss or profit targets.
Works on Any Timeframe & Asset: Suitable for stocks, forex, crypto, indices, and commodities.
Why Use This Indicator?
Highly Reliable Reversal Signals: Unlike simple RSI overbought/oversold strategies, failure swings filter out false breakouts and provide strong confirmation of trend reversals.
Risk Management Built-In: Stop-loss and take-profit levels are automatically set based on historical price action and risk-reward considerations.
Easy-to-Use Visualization: Clearly marked entry, stop-loss, and profit target levels make it beginner-friendly while still being valuable for experienced traders.
How to Trade with the Indicator
Buy Trade Example (Bullish Failure Swing)
RSI drops below 30 and recovers.
RSI forms a higher low and then breaks above the previous peak.
Entry: Buy when RSI crosses above its previous peak.
Stop-Loss: Set below the lowest low of the previous two candles.
Profit Targets:
Target 1 (1:1 Risk-Reward Ratio)
Target 2 (1:2 Risk-Reward Ratio)
Sell Trade Example (Bearish Failure Swing)
RSI rises above 70 and then declines.
RSI forms a lower high and then breaks below the previous trough.
Entry: Sell when RSI crosses below its previous trough.
Stop-Loss: Set above the highest high of the previous two candles.
Profit Targets:
Target 1 (1:1 Risk-Reward Ratio)
Target 2 (1:2 Risk-Reward Ratio)
Final Thoughts
The RSI Failure Swing Pattern Indicator is a powerful tool for traders looking to identify high-probability trend reversals. By using the RSI failure swing concept along with built-in risk management tools, this indicator provides a structured approach to trading with clear entry and exit points. Whether you’re a day trader, swing trader, or long-term investor, this indicator helps in capturing momentum shifts while minimizing risk.
Would you like any modifications or additional features? 🚀

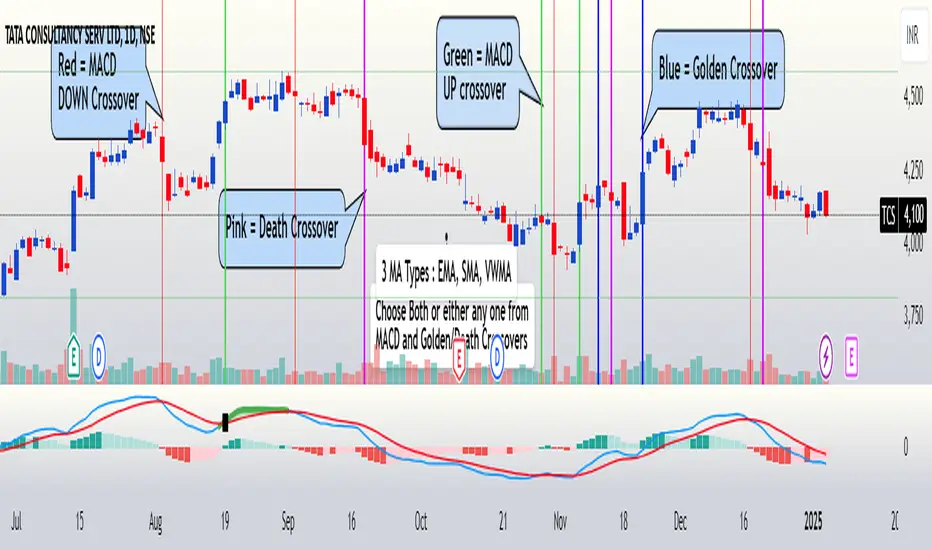
FuTech : MACD Crossovers Advanced Alert Lines=============================================================
Indicator : FuTech: MACD Crossovers Advanced Alert Lines
Overview:
The "FuTech: MACD Crossovers Advanced Alert Lines" indicator is designed to assist traders in identifying key technical patterns using the :-
1. MACD (Moving Average Convergence Divergence) and
2. Golden/Death Crossovers
By visualizing these indicators directly on the chart with advanced lines, it helps traders make more informed decisions on when to enter or exit trades.
=============================================================
Key Features of "FuTech: MACD Crossovers Advanced Alert Lines":
1. MACD Crossovers:
a) The MACD is one of the most widely used indicators for identifying momentum shifts and potential buy/sell signals. This indicator plots vertical lines on the chart whenever the MACD line crosses the signal line.
b) Upward Crossover (Bullish Signal) : When the MACD line crosses above the signal line, a green vertical line will appear, indicating a potential buying opportunity.
c) Downward Crossover (Bearish Signal) : When the MACD line crosses below the signal line, a red vertical line will appear, signaling a potential selling opportunity.
2. Golden Cross & Death Cross:
a) The Golden Cross occurs when the price moves above a long-term moving average (like the 50-day moving average), signaling a potential upward trend.
b) The Death Cross occurs when the price moves below a long-term moving average, signaling a potential downward trend.
c) These crossovers are displayed with customizable lines on the chart to easily spot when the market is shifting direction.
d) Golden Cross (Bullish Signal) : A blue vertical line appears when the price crosses above the selected long-term moving average.
e) Death Cross (Bearish Signal) : A purple vertical line appears when the price crosses below the selected long-term moving average.
=============================================================
Customization Options:
This indicator offers several customization options to suit your trading preferences:
1) MACD Settings:
a) Choose between different moving average types (EMA, SMA, or VWMA) for calculating the MACD.
b) Adjust the lengths of the fast, slow, and signal MACD periods.
c) Control the width and color of the vertical lines drawn on the chart for both up and down crossovers.
2) Golden Cross / Death Cross Settings:
a) Select the moving average type for the Golden Cross / Death Cross (EMA, SMA, or VWMA).
b) Define the lookback period for calculating the Golden Cross / Death Cross.
c) Customize the appearance of the Golden and Death Cross lines, including their width and color.
You can use both as well as either of the MACD lines or Golden Crossover / Death Crossover Lines respectively as per your trading strategies
=============================================================
How "FuTech: MACD Crossovers Advanced Alert Lines" indicator Works:
a) The indicator monitors the price and calculates the MACD and Golden/Death Crosses.
b) When the MACD line crosses above or below the signal line, or when the price crosses above or below the long-term moving average, it plots a vertical line on the chart.
c) These lines help traders quickly spot potential turning points in the market, providing clear signals to act upon.
=============================================================
Use Case:
a) Swing Traders: The indicator is useful for spotting momentum shifts and trend reversals, helping you time entries and exits for short- to medium-term trades.
b) Long-Term Traders: The Golden and Death Cross signals help identify major trend changes, giving insights into potential market shifts.
=============================================================
Why Use This "FuTech: MACD Crossovers Advanced Alert Lines" Indicator ?
a) Clear Visuals : The vertical lines provide clear and easy-to-spot signals for MACD crossovers and Golden/Death Crosses.
b) Customizable : Adjust settings for your personal trading strategy, whether you're focusing on short-term momentum or long-term trend shifts.
c) Supports Decision Making : With its advanced line plotting and customizable features, this indicator helps you make quicker and more informed trading decisions.
=============================================================
How to Use:
a) MACD Crossovers: Look for green lines to signal potential buying opportunities (when the MACD line crosses above the signal line) and red lines for selling opportunities (when the MACD line crosses below the signal line).
b) Golden Cross / Death Cross: Use the blue lines to confirm when a positive trend may begin (Golden Cross) and purple lines to warn when a negative trend may start (Death Cross).
=============================================================
Conclusion:
"FuTech: MACD Crossovers Advanced Alert Lines" indicator combines two powerful technical analysis tools, the MACD and Golden/Death Crosses, to provide clear, actionable signals on your chart.
By customizing the appearance of these signals and combining them with your trading strategy, you can enhance your decision-making process and improve your trading outcomes.
=============================================================
Thank you !
Jai Swaminarayan Dasna Das !
He Hari ! Bas Ek Tu Raji Tha !
=============================================================
Z Value AlertZ Value Alert analyzes daily price movements by evaluating fluctuations relative to historical volatility. It calculates the daily percentage change in the closing price, the average of this change over 252 days, and the standard deviation. Using these values, a Z-Score is calculated, indicating how much the current price change deviates from the historical range of fluctuations.
The user can set a threshold in standard deviations (Z-Score). When the absolute Z-Score exceeds this threshold, a significant movement is detected, indicating increased volatility. The Z-Score is visualized as a histogram, and an alert can be triggered when a significant movement occurs.
The number of trading days used to calculate historical volatility is adjustable, allowing the Sigma Move Alert to be tailored to various trading strategies and analysis periods.
Additionally, a dropdown option for the calculation method is available in the input menu, allowing the user to select between:
Normal: Calculates the percentage change in closing prices without using the logarithm.
Logarithmic: Uses the natural logarithm of daily returns. This method is particularly suitable for longer timeframes and scientific analyses, as logarithmic returns are additive.
These comprehensive features allow for precise customization of the Sigma Move Alert to individual needs and specific market conditions.

MA Touch Alert SystemThis is a alert system This Pine Script creates an alert system in TradingView to notify you whenever the price touches a specified moving average. With adjustable settings, you can set your preferred moving average period, such as 50 or 200. The script calculates this moving average and triggers an alert if the price crosses it from above or below, enabling you to stay informed about important trend reversals. A visual on-chart label marks these points, and the alert condition ensures you receive notifications through TradingView. Perfect for traders looking to automate key level monitoring, this script supports trend-following and reversal strategies.

Order Block Overlapping Drawing [TradingFinder]🔵 Introduction
Technical analysis is a fundamental tool in financial markets, helping traders identify key areas on price charts to make informed trading decisions. The ICT (Inner Circle Trader) style, developed by Michael Huddleston, is one of the most advanced methods in this field.
It enables traders to precisely identify and exploit critical zones such as Order Blocks, Breaker Blocks, Fair Value Gaps (FVGs), and Inversion Fair Value Gaps (IFVGs).
To streamline and simplify the use of these key areas, a library has been developed in Pine Script, the scripting language for the TradingView platform. This library allows you to automatically detect overlapping zones between Order Blocks and other similar areas, and visually display them on your chart.
This tool is particularly useful for creating indicators like Balanced Price Range (BPR) and ICT Unicorn Model.
🔵 How to Use
This section explains how to use the Pine Script library. This library assists you in easily identifying and analyzing overlapping areas between Order Blocks and other zones, such as Breaker Blocks and Fair Value Gaps.
To add "Order Block Overlapping Drawing", you must first add the following code to your script.
import TFlab/OrderBlockOverlappingDrawing/1
🟣 Inputs
The library includes the "OBOverlappingDrawing" function, which you can use to detect and display overlapping zones. This function identifies and draws overlapping zones based on the Order Block type, trigger conditions, previous and current prices, and other relevant parameters.
🟣 Parameters
OBOverlappingDrawing(OBType , TriggerConditionOrigin, distalPrice_Pre, proximalPrice_Pre , distalPrice_Curr, proximalPrice_Curr, Index_Curr , OBValidGlobal, OBValidDis, MitigationLvL, ShowAll, Show, ColorZone) =>
OBType (string)
TriggerConditionOrigin (bool)
distalPrice_Pre (float)
proximalPrice_Pre (float)
distalPrice_Curr (float)
proximalPrice_Curr (float)
Index_Curr (int)
OBValidGlobal (bool)
OBValidDis (int)
MitigationLvL (string)
ShowAll (bool)
Show (bool)
ColorZone (color)
In this example, various parameters are defined to detect overlapping zones and draw them on the chart. Based on these settings, the overlapping areas will be automatically drawn on the chart.
OBType : All order blocks are summarized into two types: "Supply" and "Demand." You should input your Current order block type in this parameter. Enter "Demand" for drawing demand zones and "Supply" for drawing supply zones.
TriggerConditionOrigin : Input the condition under which you want the Current order block to be drawn in this parameter.
distalPrice_Pre : Generally, if each zone is formed by two lines, the farthest line from the price is termed Pervious "Distal." This input receives the price of the "Distal" line.
proximalPrice_Pre : Generally, if each zone is formed by two lines, the nearest line to the price is termed Previous "Proximal" line.
distalPrice_Curr : Generally, if each zone is formed by two lines, the farthest line from the price is termed Current "Distal." This input receives the price of the "Distal" line.
proximalPrice_Curr : Generally, if each zone is formed by two lines, the nearest line to the price is termed Current "Proximal" line.
Index_Curr : This input receives the value of the "bar_index" at the beginning of the order block. You should store the "bar_index" value at the occurrence of the condition for the Current order block to be drawn and input it here.
OBValidGlobal : This parameter is a boolean in which you can enter the condition that you want to execute to stop drawing the block order. If you do not have a special condition, you should set it to True.
OBValidDis : Order blocks continue to be drawn until a new order block is drawn or the order block is "Mitigate." You can specify how many candles after their initiation order blocks should continue. If you want no limitation, enter the number 4998.
MitigationLvL : This parameter is a string. Its inputs are one of "Proximal", "Distal" or "50 % OB" modes, which you can enter according to your needs. The "50 % OB" line is the middle line between distal and proximal.
ShowAll : This is a boolean parameter, if it is "true" the entire order of blocks will be displayed, and if it is "false" only the last block order will be displayed.
Show : You may need to manage whether to display or hide order blocks. When this input is "On", order blocks are displayed, and when it's "Off", order blocks are not displayed.
ColorZone : You can input your preferred color for drawing order blocks.
🟣 Output
Mitigation Alerts : This library allows you to leverage Mitigation Alerts to detect specific conditions that could lead to trend reversals. These alerts help you react promptly in your trades, ensuring better management of market shifts.
🔵 Conclusion
The Pine Script library provided is a powerful tool for technical analysis, especially in the ICT style. It enables you to detect overlapping zones between Order Blocks and other significant areas like Breaker Blocks and Fair Value Gaps, improving your trading strategies. By utilizing this tool, you can perform more precise analysis and manage risks effectively in your trades.

X48 - Strategy | BreakOut & Consecutive (11in1) + Alert | V.1.2================== Read This First Before Use This Strategy ==============
*********** Please be aware that this strategy is not a guarantee of success and may lead to losses.
*********** Trading involves risk and you should always do your own research before making any decisions.
================= Thanks Source Script and Explain This Strategy ===================
► Description
Write a detailed and meaningful description that allows users to understand how your script is original, what it does, how it does it and how to use it
This Strategy Are Combine Strategy and Indicators Alert Function For Systematic Trading User.
Strategy List, Thanks For Original Source Script , From Tradingview Build-in Script From fmzquant Github
// Channel BreakOut Strategy : Calculate BreakOut Zone For Buy and Sell.
// Consecutive Bars UP/Down Strategy : The consecutive bars up/down strategy is a trading strategy used to identify potential buy and sell signals in the stock market. This strategy involves looking for a series of bars (or candles) that are either all increasing or all decreasing in price. If the bars are all increasing, it can be a signal to buy, and if the bars are all decreasing, it can be a signal to sell. This strategy can be used on any timeframe, from a daily chart to an intraday chart.
// 15m Range Length SD : Range Of High and Low Candle Price and Lookback For Calculate Buy and Sell.
Indicators Are Simple Source Script (Almost I'm Chating With CHAT-GPT and Convert pinescript V4 to V5 again for complete almost script and combine after)
// SwingHigh and SwingLow Plot For SL (StopLoss by Last Swing).
// Engulfing and 3 Candle Engulfing Plot.
// Stochastic RSI for Plot and Fill Background Paint and Plot TEXT For BULL and BEAR TREND.
// MA TYPE MODE are plot 2 line of MA Type (EMA, SMA, HMA, WMA, VWMA) for Crossover and Crossunder.
// Donchian Fans MODE are Plot Dot Line With Triangle Degree Bull Trend is Green Plot and Bear Trend is Red Plot.
// Ichimoku Cloud Are Plot Cloud A-B For Bull and Bear Trend.
// RSI OB and OS for TEXT PLOT 'OB' , 'OS' you will know after OB and OS, you can combo with other indicators that's make you know what's the similar trend look like?
// MACD for Plot Diamond when MACD > 0 and MACD < 0, you can combo with other indicators that's make you know what's the similar trend look like?
Alert Can Alert Sent When Buy and Sell or TP and SL, you can adjust text to alert sent by your self or use default setting.
========== Let'e Me Explain How To Use This Strategy =============
========== Properties Setting ==========
// Capital : Default : 1,000 USDT For Alot Of People Are Beginner Investor = It's Capital Your Cash For Investment
// Ordersize : Default Are Setting 5% / Order We Call Compounded
========== INPUT Setting ==========
// First Part Use Must Choose Checkbox For Use of Strategy and Choose TP/SL by Swing or % (can choose both)
// In Detail Of Setting Are Not Too Much, Please Read The Header Of Setting Before Change The Value
// For The Indicator In List You Want To Add Just Check ✅ From MODE Setting, It's Show On Your Chart
// You Can Custom TP/SL % You Want
========== ##### No trading strategy is guaranteed to be 100% successful. ###### =========
For Example In My Systematic Trading
Select 1/3 Strategy Setting TP/SL % Match With Timeframe TP Long Are Not Set It's Can 161.8 - 423.6% but Short Position Are Not Than 100% Just Fine From Your Aset
Choose Indicators For Make Sure Trend and Strategy are the same way like Strategy are Long Position but MACD and Sto background is bear. that's mean this time not open position.
Donchian Fans is Simple Support and Ressistant If You Don't Know How To Plot That's, This indicator plot a simple for you ><.
Make Sure With Engulfing and 3 Candle Engulfing If You Don't Know, What's The Engulfing, This Indicator are plot for you too ><.
For a Big Trend You can use Ichimoku Cloud For Check Trend, Candle Upper Than Cloud or Lower Than Cloud for Bull and Bear Trend.

Strategy for UT Bot Alerts indicator Using the UT Bot alerts indicator by @QuantNomad, this strategy was designed for showing an example of how this indicator could be used, also, it has the goal to help some people from a group that use to use this indicator for their trading. Under any circumstance I recommend to use it without testing it before in real time.
Backtesting context: 2020-02-05 to 2023-02-25 of BTCUSD 4H by Tvc. Commissions: 0.03% for each entry, 0.03% for each exit. Risk per trade: 2.5% of the total account
For this strategy, 3 indicators are used:
UT Bot Alerts indicator by Quantnomad
One Ema of 200 periods for indicate the trend
Atr stop loss from Gatherio
Trade conditions:
For longs:
Close price is higher than Atr from UT Bot
Ema from UT Bot cross over Atr from UT Bot.
This gives us our long signal. Stop loss will be determined by atr stop loss (white point), break even(blue point) by a risk/reward ratio of 0.75:1 and take profit of 3:1 where half position will be closed. This will be showed as buy (open long position)
The other half will be closed when close price is lower than Atr and Ema from UT Bot cross under Atr. This will be showed as cl buy (close long position)
For shorts:
Close price is lower than Atr from UT Bot
Ema from UT Bot cross over Atr from UT Bot.
This gives us our short signal. Stop loss will be determined by atr stop loss (white point), break even(blue point) by a risk/reward ratio of 0.75:1 and take profit of 3:1 where half position will be closed. This will be showed as sell (open short position)
The other half will be closed when close price is higher than Atr and Ema from UT Bot cross over Atr. This will be showed as cl sell (close short position)
Risk management
For calculate the amount of the position you will use just a small percent of your initial capital for the strategy and you will use the atr stop loss for this.
Example: You have 1000 usd and you just want to risk 2,5% of your account, there is a long signal at price of 20,000 usd. The stop loss price from atr stop loss is 19,000. You calculate the distance in percent between 20,000 and 19,000. In this case, that distance would be of 5,0%. Then, you calculate your position by this way: (initial or current capital * risk per trade of your account) / (stop loss distance).
Using these values on the formula: (1000*2,5%)/(5,0%) = 500usd. It means, you have to use 500 usd for risking 2.5% of your account.
We will use this risk management for apply compound interest.
In settings, with position amount calculator, you can enter the amount in usd of your account and the amount in percentage for risking per trade of the account. You will see this value in green color in the upper left corner that shows the amount in usd to use for risking the specific percentage of your account.
Script functions
Inside of settings, you will find some utilities for display atr stop loss, break evens, positions, signals, indicators, etc.
You will find the settings for risk management at the end of the script if you want to change something. But rebember, do not change values from indicators, the idea is to not over optimize the strategy.
If you want to change the initial capital for backtest the strategy, go to properties, and also enter the commisions of your exchange and slippage for more realistic results.
In risk managment you can find an option called "Use leverage ?", activate this if you want to backtest using leverage, which means that in case of not having enough money for risking the % determined by you of your account using your initial capital, you will use leverage for using the enough amount for risking that % of your acount in a buy position. Otherwise, the amount will be limited by your initial/current capital
---> Do not forget to deactivate Trades on chart option in style settings for a cleaner look of the chart <---
Some things to consider
USE UNDER YOUR OWN RISK. PAST RESULTS DO NOT REPRESENT THE FUTURE.
DEPENDING OF % ACCOUNT RISK PER TRADE, YOU COULD REQUIRE LEVERAGE FOR OPEN SOME POSITIONS, SO PLEASE, BE CAREFULL AND USE CORRECTLY THE RISK MANAGEMENT
Do not forget to change commissions and other parameters related with back testing results!
Strategies for trending markets use to have more looses than wins and it takes a long time to get profits, so do not forget to be patient and consistent !
---> The strategy can still be improved, you can change some parameters depending of the asset and timeframe like risk/reward for taking profits, for break even, also the main parameters of the UT Bot Alerts <----

Large Candle (With Alert, You have to ENABLE it on chart)You have to enable alert after adding this indicator to a chart.
Right click on chart -> Create Alert -> Select Condition: "Large Candle"; and choose "Any alert() function call"
Alert action such as email, popup, sms etc can be checked -> Create.
Disclaimer: trade on your own risk.
This script adds alert function to the "Large Candle - Tracking Institutional Buy and Sell" which can be found here:
Source code is now open to all

Volume Spikes & Growing Volume Signals With Alerts & ScannerVOLUME SPIKES & GROWING VOLUME SIGNALS WITH ALERTS & SCANNER
This indicator shows arrows when there is a volume spike. It also paints the background when volume is growing. There is also a volume scanner for 8 tickers that will change color in real time when your other favorite tickers see volume growth and spikes.
You can customize the length of DMI, the number of bars to calculate the current volume average from, the number of bars back to get the overall volume average from, the multiple that needs to be hit to give a signal, the position of the scanner table and which tickers are used in the scanner. There are detailed directions as tooltips in the indicator settings you can read to understand exactly what each input does.
All features are customizable as well as which tickers the screener uses.
***HOW TO USE***
Watch for volume to pick up before placing trades as this will help you stay out of the markets when price is choppy. Volume usually brings volatility so watch for the volume signals to show up on the chart. Typically when price has made a big move one direction or is consolidating and you see the volume indicator start giving signals, the market is ready to reverse or continue its current trend but move faster in that direction.
Volume Spikes
When there is a volume spike that is larger than the average of volume over the last 100+ bars(depending on your settings) multiplied by the volume amount multiplier(in your settings) then an arrow will show up on the chart. This arrow will be green if DMI is bullish and red if DMI is bearish.
Volume Growth
A Background color will appear when the average volume over the last 5 bars(depending on your settings) is higher than the average volume over the last 100+ bars(depending on your settings) and is greater than your multiple. It will also paint the background when the volume moving average has increased over the last 3 bars consecutively. The background colors will be red or green depending on buy & sell pressure(DMI). If the background color appears, then you know volume is growing and volatility is near.
Volume Scanner
The scanner can be customized to have all of your favorite tickers by changing the tickers used in the indicator settings at the bottom. When no volume growth or spikes are detected, the ticker will show as light blue. When volume spikes or growth is detected, the ticker will turn orange to notify you.
Alerts
You can set up alerts as well when there is volume growth, bullish volume spikes and bearish volume spikes on any chart or timeframe.
Indicator Settings
Settings will need to be adjusted across different tickers as some have large swings in volume and some stay pretty even, so make sure to set up different chart layouts with settings that work for each ticker and save them individually so you don’t have to reset these values every time you switch charts.
***MARKETS***
This indicator can be used as a signal on all markets, including stocks, crypto, futures and forex as long as Tradingview has volume and DMI data for that ticker.
***TIMEFRAMES***
This volume spike indicator can be used on all timeframes as long as there is enough data for Tradingview to use for calculations.
***TIPS***
Try using numerous indicators of ours on your chart so you can instantly see the bullish or bearish trend of multiple indicators in real time without having to analyze the data. Some of our favorites are our Auto Fibonacci, Volume Profile, Momentum, Auto Support And Resistance and Money Flow Index in combination with this Volume Growth indicator. They all have real time Bullish and Bearish labels as well so you can immediately understand each indicator's trend.
