EMA Position AlertDescription
EMA Position Alert is a comprehensive trend analysis tool designed to help traders instantly identify the market's direction and strength relative to key Exponential Moving Averages (EMAs). By combining visual trend lines with a real-time data dashboard, this indicator provides a clear snapshot of the current price action across short, medium, and long-term horizons.
Whether you are a scalper looking for short-term momentum or a swing trader identifying major trend reversals, this tool simplifies the complex relationship between price and moving averages.
Key Features
1. Multi-EMA System The indicator plots four essential EMAs commonly used by institutional and retail traders:
EMA 21: Short-term trend/momentum.
EMA 55: Medium-term trend.
EMA 100: Major support/resistance level.
EMA 200: Long-term trend filter.
Visual Aid: The EMA lines change transparency automatically. They appear brighter/solid when the price is above them (bullish) and more transparent/faded when the price is below them (bearish).
2. Real-Time Information Dashboard A customizable table (displayed in the top-right corner) provides live data for the current bar:
Status: Clearly indicates if the price is "Above ▲" (Bullish) or "Below ▼" (Bearish) for each specific EMA.
Distance (%): Calculates the percentage distance between the current closing price and each EMA. This is crucial for identifying overextended moves (mean reversion opportunities) or tight consolidation.
Overall Trend Summary:
Strong ★★: Price is above all EMAs (21, 55, 100, 200).
Building ★: Price is above the long-term EMAs (55, 100, 200) but may be testing the short-term trend.
Weak ▼: Price is below all EMAs.
Ranging: Mixed signals (price is sandwiched between EMAs).
3. Custom Alerts Never miss a move. The script comes with built-in alert conditions compatible with TradingView's alert system:
Breakout Alerts: Trigger an alert when price crosses above specific EMAs (21, 55, 100, or 200).
Strong Trend Alert: Trigger an alert when the price successfully holds above all EMAs, signaling a strong bullish phase.
Settings
Show Status Table: Toggle the dashboard on or off.
Table Transparency: Adjust the background opacity of the dashboard to fit your chart theme.
Line Width: Adjust the thickness of the EMA lines for better visibility.
How to Use
Trend Following: Look for the "Strong ★★" status in the dashboard. When the price is above all EMAs and the EMAs are fanning out, it indicates a strong uptrend.
Pullbacks: If the trend is "Strong" but the price drops to test the EMA 21 or EMA 55, look for support bounces.
Mean Reversion: Watch the Distance %. If the distance becomes historically large, the price may be overextended and due for a correction back to the mean.
Consolidation: When the status shows "Ranging" and the Distance % is very low (near 0.00%), a breakout move is likely imminent.
ค้นหาในสคริปต์สำหรับ "alert"

Combo RSI + MACD + ADX MTF (Avec Alertes)✅ Recommended Title:
Multi-Signal Oscillator: ADX Trend + DI + RSI + MACD (MTF, Cross Alerts)
✅ Detailed Description
📝 Overview
This indicator combines advanced technical analysis tools to identify trend direction, capture reversals, and filter false signals.
It includes:
ADX (Multi-TimeFrame) for trend and trend strength detection.
DI+ / DI- for directional bias.
RSI + ZLSMA for oscillation analysis and divergence detection.
Zero-Lag Normalized MACD for momentum and entry timing.
⚙️ Visual Components
✅ Green/Red Background: Displays overall trend based on Multi-TimeFrame ADX.
✅ DI+ / DI- Lines: Green and red curves showing directional bias.
✅ Normalized RSI: Blue oscillator with orange ZLSMA smoothing.
✅ Zero-Lag MACD: Violet or fuchsia/orange oscillator depending on the version.
✅ Crossover Points: Colored circles marking buy and sell signals.
✅ ADX Strength Dots: Small black dots when ADX exceeds the strength threshold.
🚨 Included Alert System
✅ RSI / ZLSMA Crossovers (Buy / Sell).
✅ MACD / Signal Line Crossovers (Buy / Sell).
✅ DI+ / DI- Crossovers (Buy / Sell).
✅ Double Confirmation DI+ / RSI or DI+ / MACD.
✅ Double Confirmation DI- / RSI or DI- / MACD.
✅ Trend Change Alerts via Background Color.
✅ ADX Strength Alerts (Above Threshold).
🛠️ Suggested Configuration Examples
1. Short-Term Reversal Detection:
RSI Length: 7 to 14
ZLSMA Length: 7 to 14
MACD Fast/Slow: 5 / 13
ADX MTF Period: 5 to 15
ADX Threshold: 15 to 20
2. Long-Term Trend Following:
RSI Length: 21 to 30
ZLSMA Length: 21 to 30
MACD Fast/Slow: 12 / 26
ADX MTF Period: 30 to 50
ADX Threshold: 20 to 25
3. Scalping / Day Trading:
RSI Length: 5 to 9
ZLSMA Length: 5 to 9
MACD Fast/Slow: 3 / 7
ADX MTF Period: 5 to 10
ADX Threshold: 10 to 15
🎯 Why Use This Tool?
Filters false signals using ADX-based background coloring.
Provides multi-source alerting (RSI, MACD, ADX).
Helps identify true market strength zones.
Works on all markets: Forex, Crypto, Stocks, Indices.

Multi-Timeframe EMAs with Cross Alerts (Up & Down)📌 Indicator Name:
Multi-Timeframe EMAs with Cross Alerts (Up & Down)
🛠️ Core Features:
✅ 1. Multi-Timeframe EMA Display
The script calculates and displays 6 different Exponential Moving Averages (EMAs).
Each EMA has:
Custom length input (e.g., 9, 21, etc.).
Custom timeframe selection (e.g., 1H, 4H, 1D).
Custom color for easy identification on the chart.
✅ 2. EMA Visualization
Each of the six EMAs is plotted on the chart using the selected color and thickness.
They respond dynamically to different timeframes (current or higher/lower).
✅ 3. Cross Detection Logic
The script can detect crossover and crossunder between EMA pairs:
EMA 1 and EMA 2
EMA 3 and EMA 4
EMA 5 and EMA 6
(Optional: can be extended to other combinations.)
✅ 4. Alert Toggles
Users can enable or disable alerts for each pair independently:
Alert: EMA 1 crosses EMA 2
Alert: EMA 3 crosses EMA 4
Alert: EMA 5 crosses EMA 6
(You added an additional option for EMA 4 vs EMA 6 later.)
✅ 5. Visual Alert Markers
The script uses alert() function to send alert messages when:
An EMA crosses above another (crossover)
An EMA crosses below another (crossunder)
Alerts include clear icons like 🔼 and 🔽 in the messages.
🔔 Use Case Scenarios
Swing traders: Identify longer-term cross signals on higher timeframes.
Scalpers: Use lower-timeframe EMAs with fast alert reactions.
Multi-timeframe analysis: Spot alignment between trend-following EMAs across different periods.
✅ Bonus
Fully customizable — great for adapting to your own strategy, whether it's trend confirmation, re-entry signals, or early reversals
📌 اسم المؤشر:
المتوسطات المتحركة الأسية (EMA) متعددة الفريمات مع تنبيهات تقاطع صاعدة وهابطة
🛠️ الميزات الأساسية:
✅ 1. دعم متعدد للفريمات الزمنية
يقوم السكربت بحساب وعرض 6 متوسطات متحركة أسية (EMA) مختلفة.
يمكن تخصيص كل EMA من حيث:
الطول (مثل: 9، 21...).
الفريم الزمني (مثل: الساعة، الأربع ساعات، اليومي...).
اللون، لتسهيل التمييز بين الخطوط على الشارت.
✅ 2. عرض المتوسطات على الرسم البياني
يتم رسم كل من المتوسطات الستة باستخدام اللون والتنسيق الذي تختاره.
المتوسطات تتفاعل تلقائيًا مع التغييرات في الفريم الزمني.
✅ 3. كشف التقاطعات
يمكن للسكربت كشف تقاطعات (صعودًا أو هبوطًا) بين أزواج المتوسطات التالية:
EMA 1 و EMA 2
EMA 3 و EMA 4
EMA 5 و EMA 6
(ويمكنك إضافة المزيد مثل EMA 4 مع EMA 6 حسب الحاجة)
✅ 4. التحكم في التنبيهات
يمكن للمستخدم تفعيل أو تعطيل التنبيهات لكل زوج من المتوسطات على حدة:
تنبيه عند تقاطع EMA 1 و EMA 2
تنبيه عند تقاطع EMA 3 و EMA 4
تنبيه عند تقاطع EMA 5 و EMA 6
(وأي أزواج إضافية يتم إضافتها لاحقًا)
✅ 5. تنبيهات مرئية برسائل واضحة
السكربت يرسل تنبيهات عبر وظيفة alert() عند حدوث:
تقاطع صاعد (EMA يتقاطع من الأسفل إلى الأعلى).
تقاطع هابط (EMA يتقاطع من الأعلى إلى الأسفل).
التنبيه يحتوي على رموز توضيحية مثل 🔼 و 🔽 ليسهل قراءته.
🎯 مناسب لـ:
المتداولين المتأرجحين (Swing Traders): لاكتشاف تقاطعات على الفريمات الكبرى.
المضاربين (Scalpers): باستخدام EMA سريعة على فريمات صغيرة مع تنبيهات فورية.
محللي الفريمات المتعددة: لتأكيد الاتجاه أو الانعكاس بناءً على تقاطع متوسطات من فريمات مختلفة.
✅ مزايا إضافية:
قابل للتخصيص بشكل كامل حسب استراتيجيتك.
مناسب لعدة أساليب: تأكيد الترند، إعادة الدخول، أو إشارات الانعكاس المبكر.

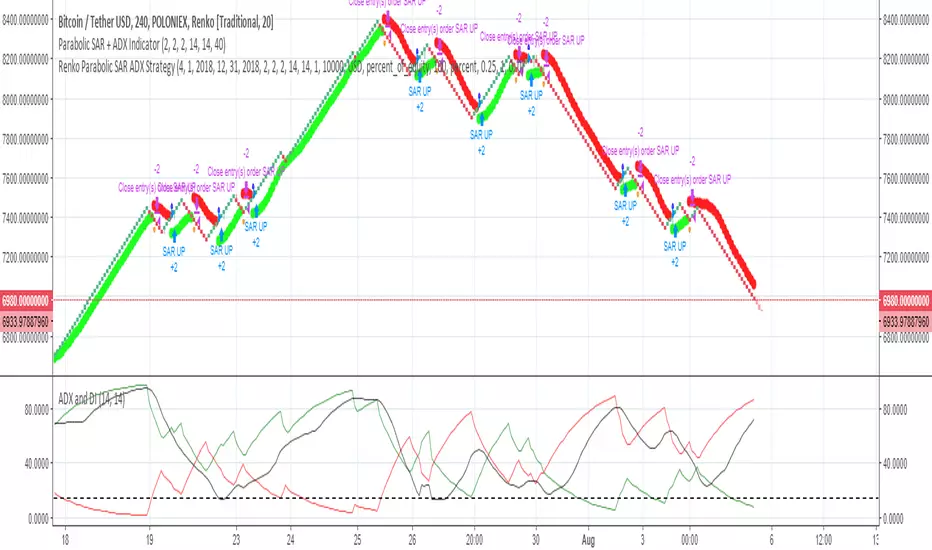
Renko Parabolic SAR + ADX Indicator (Need help on the alert)//This script is made using scripts by other authors. All credit goes to them. I am only copying snippets and making it work for me//
Problem Statement:
The script seems to work best using a fixed renko brick. The indicators do work but I have problems with the alert.
What often happens is, the signal appears (condition is met) BRIEFLY as the bar forms, it disappears a few seconds later, but the alert is still sent on the close of the bar.
I wish to receive these alerts on the close of a bar only if the condition is still met on the close of the bar
I am hoping someone can guide or fix the alertcondition such that it checks for the firmed signal before triggering the alert.
POLONIEX:BTCUSDT
5m Exit AlertsThese can help a lot with Daytrading if you don't have a price target in mind when there's no clear resistance / support nearby, and you don't trust the market enough to hold it as a swing trade.
Keep in mind that its main purpose is to give you a "warning" that it might be good to look at your screen, instead of guaranteeing you "now is the best time to exit". You won't reach high winning stats by blindly following this alert.
"A Exit LONG":
(I'm using letters instead of numbers for all Exit alerts to make sure I don't accidentally confuse Enter and Exit alerts).
There are 4 conditions that might trigger it. The reasons show up in the exit alert message (unfortunately only as a number, since alert messages can't have "dynamic text" in TradingView), and can also be displayed as symbols in the chart (see image above - make sure to enable "Show Signals" in the indicator settings first though).
Here are the conditions sorted from best to worst:
Technical reversal: Bearish Hammer candle with Volume > 2 * avg volume (of last 30 candles), when 5m candle closed. Reversal very likely. This is usually the best time to take your gains for the rest of the day.
EMA 3/8 cross: standard 5m EMA 3/8 cross, indicating a trend reversal, or at least a pullback. Can also be helpful to detect double tops / double bottoms.
Trailing Stop Loss: Crossed below 30m EMA 8, 5m candle closed. This is a "fallback" alert in case EMA 3 was already below EMA 8 before you set up the alert. It's not unlikely that the stock might go further down to VWAP, so depending on the chart and market this might be a good opportunity to save the gains you have left.
"Final" Stop Loss: Crossed below VWAP. Usually not a good sign. If you entered around VWAP your losses shouldn't be big yet, but if you plan on holding the stock the Daily chart and market outlook should better be quite convincing, and you wouldn't have needed to use this alert in the first place.
Keep in mind these work of course best if you picked a "good" stock: clear movement, tidy price action, high volume. Otherwise alerts are more likely to be triggered redundantly.
Always consider how the market and stock looks like, then decide whether to exit or not! Usually it makes sense to wait a bit to see f. e. whether the stock bounces off the 30m EMA 8, and it's just a pullback.
"B Enter SHORT":
Similar, but for shorts...
"C 1m Scalp LONG" + "D 1m Scalp SHORT":
Simple Scalping alert for EMA 3/8 cross on a 1m chart - but without needing to use a 1m chart to set it up!
Unfortunately it's not as accurate as manually setting this alert up on a 1m chart. It might be an advantage though that it sometimes is triggered 1-2 min later, since this means there are less redundant triggerings.
It can be useful esp. on high momentum trades, but I honestly haven't used it in a looong while.
"X Candle Close":
same as in 5m Entry indicator: triggered when 5m candle is confirmed
"Z Trend Change: UP" + "Z Trend Change: DOWN":
This one is meant to be used only on SPY: It alerts you when SPY is changing its trending direction, which might mean entering or closing existing trades.
I have therefore set it up to never end (by setting it to "Once Per Bar Close" in the alert settings).
It's based on DMI positive or negative being > 25. I had it based on VWAP at the beginning, but there were days where it was triggered every 5 minutes...
More infos: www.reddit.com

Price Level Alert System
Price Level Alert System - Manage Multiple Price Alerts in One
This indicator is designed to simplify price level monitoring by allowing you to manage up to 5 different price alerts through a single, unified alert system. Instead of creating multiple separate alerts for different price levels, you can now monitor all your key levels with just one alert subscription.
Key Benefits:
Unified Alert Management - Monitor 5 price levels with a single alert, saving your valuable alert slots
Clean Chart Interface - Toggle price levels on/off without cluttering your chart
Smart Alert Types - Get notified for price crosses (above/below) and approaching alerts
Customizable Appearance - Adjust colors, transparency, and line width for each level individually
Efficient Workflow - Inline controls make setup quick and intuitive
Perfect For:
Traders monitoring multiple support/resistance levels
Swing traders tracking key price targets
Day traders needing quick alert setup
Anyone wanting to maximize their TradingView alert efficiency
How It Works:
Simply enter your desired price levels, check the boxes to enable them, and click the bell icon to activate alerts. The indicator will monitor all enabled levels and send notifications through a single alert when price action occurs at any of your specified levels.
Features:
5 independent price levels
Individual on/off toggles
Approaching distance alerts (customizable percentage)
Cross above/below notifications
Professional line styling options
Status line price display
Save your alert slots and streamline your trading workflow with this efficient price level monitoring solution. Whether you're tracking support/resistance, psychological levels, or price targets, this indicator helps you stay informed without the complexity of managing multiple individual alerts.
Strong Engulfing Candlestick (With Alerts)Detect only Strong Bullish and Strong Bearish Engulfing candle patterns and provide visual signals along with alerts.
Key Features
Bullish Engulfing Detection:
Conditions:
Current candle's close > open (bullish).
Previous candle's close < open (bearish).
Current candle's high ≥ Previous candle's high (includes wicks).
Current candle's low ≤ Previous candle's low (includes wicks).
The body of the current bullish candle is stronger than the previous bearish candle.
Signal: Plots a green upward arrow below the bar when conditions are met.
Bearish Engulfing Detection:
Conditions:
Current candle's close < open (bearish).
Previous candle's close > open (bullish).
Current candle's high ≥ Previous candle's high (includes wicks).
Current candle's low ≤ Previous candle's low (includes wicks).
The body of the current bearish candle is stronger than the previous bullish candle.
Signal: Plots a red downward arrow above the bar when conditions are met.
Alerts:
Custom alerts are included for both bullish and bearish engulfing patterns:
Bullish Alert Message: "Strong Bullish Engulfing detected!"
Bearish Alert Message: "Strong Bearish Engulfing detected!"

Advanced Trend and Volatility Indicator with Alerts by ZaimonThis script presents a comprehensive analytical tool that integrates multiple technical indicators to provide a holistic view of market trends and volatility. By uniquely combining Moving Averages (MA), Relative Strength Index (RSI), Stochastic Oscillator, Bollinger Bands, and Average True Range (ATR), it offers nuanced insights into price movements and helps identify potential trading opportunities.
---
### **Key Features and Integration:**
1. **Moving Averages (MA20 & MA50):**
- **Trend Identification:**
- **Methodology:** Calculates two Simple Moving Averages—MA20 (short-term) and MA50 (long-term).
- **Bullish Trend:** When MA20 crosses above MA50, indicating upward momentum.
- **Bearish Trend:** When MA20 crosses below MA50, signaling downward momentum.
- **Golden Cross & Death Cross Alerts:**
- **Golden Cross:** MA20 crossing above MA50 generates a bullish alert and visual symbol.
- **Death Cross:** MA20 crossing below MA50 triggers a bearish alert and visual symbol.
- **Integration:**
- Serves as the foundational trend indicator, influencing interpretations of other indicators within the script.
2. **Relative Strength Index (RSI):**
- **Momentum Measurement:**
- **Methodology:** Calculates RSI to assess the speed and change of price movements over a 14-period length.
- **Overbought/Oversold Conditions:** Customizable thresholds set at 70 (overbought) and 30 (oversold).
- **Alerts:**
- Generates alerts when RSI crosses above or below the specified thresholds.
- **Integration:**
- Confirms trend strength identified by MAs.
- Overbought/Oversold signals can precede potential trend reversals, especially when aligned with MA crossovers.
3. **Stochastic Oscillator:**
- **Momentum and Reversal Signals:**
- **Methodology:** Uses %K and %D lines to evaluate price momentum relative to high-low range over recent periods.
- **Bullish Signal:** %K crossing above %D in oversold territory (below 20).
- **Bearish Signal:** %K crossing below %D in overbought territory (above 80).
- **Alerts:**
- Provides alerts on bullish and bearish crossovers in extreme regions.
- **Integration:**
- Enhances RSI signals by providing additional momentum confirmation.
- When both RSI and Stochastic indicate overbought/oversold conditions, it strengthens the likelihood of a reversal.
4. **Bollinger Bands:**
- **Volatility Visualization:**
- **Methodology:** Plots upper and lower bands based on standard deviations from a moving average (BB Basis).
- **Dynamic Support/Resistance:** Prices touching or exceeding the bands may indicate potential reversals.
- **Integration:**
- Works with RSI and Stochastic to identify overextended price movements.
- Helps in assessing volatility alongside trend and momentum indicators.
5. **Average True Range (ATR):**
- **Volatility Assessment:**
- **Methodology:** Calculates ATR over a 14-period length to measure market volatility.
- **ATR Bands:** Plots upper and lower bands relative to the current price using an ATR multiplier.
- **Integration:**
- Assists in setting stop-loss and take-profit levels based on current volatility.
- Complements Bollinger Bands for a comprehensive volatility analysis.
6. **Information Table:**
- **Real-Time Data Display:**
- Shows current values of MA20, MA50, RSI, Stochastic %K and %D, BB Basis, ATR, and Trend Status.
- **Trend Status Indicator:**
- Displays "Bullish," "Bearish," or "Sideways" based on MA conditions.
- **Integration:**
- Provides a consolidated view for quick decision-making without analyzing individual indicators separately.
7. **Periodic Labels:**
- **Enhanced Visibility:**
- Adds labels every 50 bars showing RSI and Stochastic values.
- **Integration:**
- Helps track momentum changes over time and spot longer-term patterns.
---
### **How the Components Work Together:**
- **Synergistic Analysis:**
- **Trend Confirmation:** MA crossovers establish the primary trend, while RSI and Stochastic confirm momentum within that trend.
- **Volatility Context:** Bollinger Bands and ATR provide context on market volatility, refining entry and exit points suggested by trend and momentum indicators.
- **Signal Strength:** Concurrent signals from multiple indicators increase confidence in trading decisions.
---
### **Usage Guidelines:**
1. **Trend Analysis:**
- **Identify Trend Direction:**
- Observe MA20 and MA50 crossovers.
- Refer to the Trend Status in the information table.
- **Confirm with Momentum Indicators:**
- Ensure RSI and Stochastic support the identified trend.
2. **Entry and Exit Points:**
- **Overbought/Oversold Conditions:**
- Look for RSI and Stochastic reaching extreme levels.
- Consider entering positions when oversold in a bullish trend or overbought in a bearish trend.
- **Bollinger Band Interactions:**
- Use price interactions with Bollinger Bands to identify potential reversal zones.
3. **Risk Management:**
- **ATR-Based Levels:**
- Set stop-loss and take-profit levels using ATR bands to account for current volatility.
- **Adjusting to Volatility:**
- Modify position sizes and targets based on Bollinger Band width and ATR values.
4. **Alerts Setup:**
- **Customize Alert Thresholds:**
- Configure alerts for MA crossovers, RSI levels, and Stochastic crossovers according to your trading strategy.
- **Stay Informed:**
- Use alerts to monitor key events without constant chart observation.
---
### **Customization:**
- **Flexible Parameters:**
- All indicator lengths, thresholds, and settings are adjustable to suit different trading styles and timeframes.
- **Adjustable Visuals:**
- Modify plot colors, line styles, and label positions to enhance chart readability.
---
### **Originality and Value Addition:**
This script differentiates itself by:
- **Integrated Approach:**
- Seamlessly combining multiple indicators to provide a more comprehensive analysis than using each indicator separately.
- **Enhanced Visualization:**
- Utilizing plots, fills, labels, and an information table to present data intuitively.
- **User-Friendly Features:**
- Pre-configured alerts and real-time data displays reduce the need for manual monitoring.
By explaining how each component interacts and contributes to the overall analysis, the script adds substantial value to traders seeking a multi-faceted tool for market analysis.
---
### **Additional Notes:**
- **Learning Resource:**
- The script is well-commented, serving as an educational tool for those learning Pine Script and technical analysis integration.
- **Further Enhancements:**
- Opportunities exist to incorporate additional indicators like MACD or ADX, and to develop advanced alert logic, such as RSI or Stochastic divergences.
---
### **Disclaimer:**
- **Educational Purpose Only:**
- This script is provided for informational purposes and should not be construed as financial advice.
- **Risk Acknowledgment:**
- Trading involves significant risk; past performance is not indicative of future results.
- **Due Diligence:**
- Users should conduct their own analysis and consider consulting a financial professional before making trading decisions.
---
By providing detailed explanations of the methodologies and the synergistic use of multiple indicators, this script aligns with TradingView's guidelines for originality and usefulness. It offers traders a unique tool that enhances market analysis through the thoughtful integration of technical indicators.

Volume Standard Deviation Alert GusPurpose
The script detects and alerts traders when the volume of a trading asset significantly exceeds a calculated threshold based on the standard deviation of volume over a specified lookback period. It optionally filters these alerts based on whether the price action is bullish or bearish.
Key Components
Inputs
lookback (default: 20)
The number of bars to consider when calculating the moving average and standard deviation of volume.
stdDevFactor (default: 2.0)
The multiplier for the standard deviation to determine the threshold for a volume spike.
alertOnClose (default: true)
Determines whether alerts should only be triggered after the bar has closed.
checkBullBear (default: false)
Enables filtering of alerts based on the bullishness or bearishness of the bar.
Calculations
volSMA
The simple moving average (SMA) of the volume over the lookback period.
volStd
The standard deviation of the volume over the lookback period.
threshold
The alert threshold is calculated as:
Threshold
=
volSMA
+
(
stdDevFactor
×
volStd
)
Threshold=volSMA+(stdDevFactor×volStd)
isBullish & isBearish
Determines whether the current bar is bullish (close > open) or bearish (close < open).
volumeSpikeCondition
A condition that triggers when the current volume exceeds the calculated threshold.
bullishCondition & bearishCondition
Refines the spike condition by requiring the bar to be bullish or bearish when checkBullBear is enabled.
finalCondition
The ultimate alert condition based on the user’s preference for bullish/bearish filtering.
finalTrigger
Ensures the alert only triggers at bar close if alertOnClose is set to true.
Visualization
Plots the SMA of the volume (volSMA) and the threshold line (threshold), helping traders visually understand the conditions.
Histograms the current volume and colors the bars:
Red: Volume exceeds the threshold.
Blue: Volume is below the threshold.
Alerts
The script generates an alert message when the finalTrigger condition is met:
"Bullish Volume Spike!" if the bar is bullish.
"Bearish Volume Spike!" if the bar is bearish.
"High Volume Spike!" if no bull/bear filter is applied.
Alerts are sent using alert() with the message and set to trigger once per bar close.
Usage
Traders can use this script to identify unusual volume activity, which often precedes significant price movements.
Customizability allows traders to tune the lookback period, standard deviation multiplier, and whether to filter for bullish/bearish spikes.
Visual and audible cues help in identifying important market events in real time.
This indicator is particularly useful for spotting market breakouts or breakdowns driven by high trading activity.

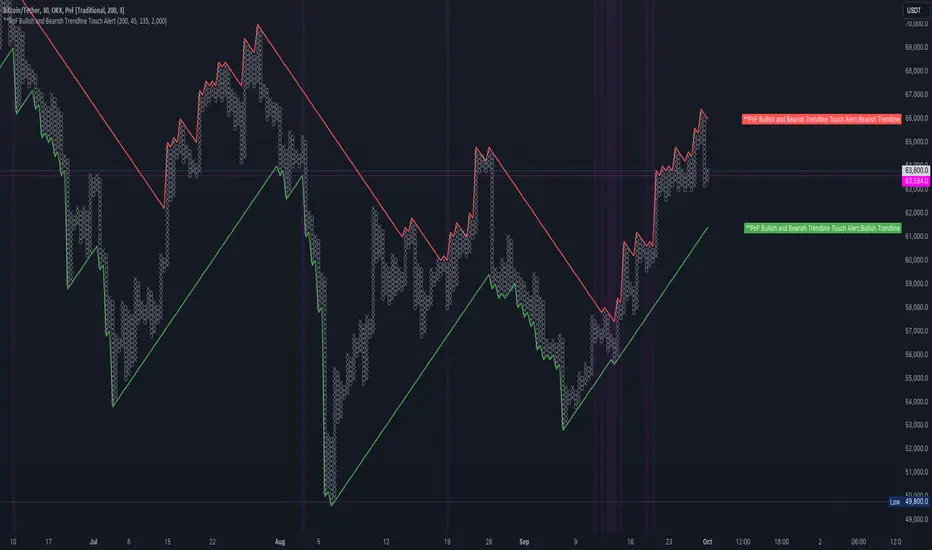
PnF Bullish & Bearish Trend Line Indicator with Proximity AlertThis Pine Script indicator, "PnF Bullish and Bearish Trend line Proximity Alert," overlays on a trading chart to monitor and alert users about interactions with bullish and bearish trend lines derived from Point and Figure (PnF) charting.
Key Features:
Inputs: Users can set parameters such as box size, bullish and bearish angles (in degrees), and a proximity threshold for detecting touches.
Slope Calculation: The script calculates the slopes for bullish and bearish trendlines using the tangent of the specified angles.
Trendline Management:
It initializes and updates trend lines based on price interactions, adjusting their starting points and positions as conditions change.
Proximity Detection: The indicator checks if the current price is close enough to the trend lines and sets conditions for alerts.
Alerts: Users receive alerts when both trend lines are touched, enhancing decision-making for trading strategies.
Visual Feedback: It highlights areas where both trend lines are touched and plots the trend lines in distinct colors for clarity.
This indicator provides an effective way to track key price levels and potential trend reversals in the market.
Custom Multi-Timeframe Screener with AlertsThis is a multi-timeframe screener with alerts. Use this way you can create a screener on indicators using 2 or more timeframes.
In TradingView there is a limit of 40 security function calls. Every timeframe requires another security call so you can screen fewer symbols with any additional timeframe.
In this example, I use 2 timeframes, so the maximum amount of symbols you can scan is 40/2 = 20.
For 3 timeframes - 13, 4tfs - 10, 5tfs - 8 symbols and so on.
In this simplistic example, I require a cross of EMAs on the current timeframe and confirmation that one EMA above/below another from the second timeframe.
Of course, you can create much more complicated functions for this screener.
Params
- higher timeframe
- ema params
- 20 symbol inputs for instruments you want to use in this screener
Alerts
You can create an alert from it easily by selecting the screener name from the list and then selecting "Any alert() function call".
No additional configuration is required, message and alert on close is generated in the code.
You should better change the default name for your alert. Sometimes because of big amount of inputs you might receive an error.
Disclaimer
Please remember that past performance may not be indicative of future results.
Due to various factors, including changing market conditions, the strategy may no longer perform as good as in historical backtesting.
This post and the script don’t provide any financial advice.

Filtered Fractals (2-Stage + Alerts)Filtered Fractals
Overview
This indicator is an advanced evolution of the classic Fractal logic (like the WICK.ED or Bill Williams models). Standard fractals are often "noisy," marking every minor local peak or trough, which can lead to false signals in volatile markets.
This script solves the "noise" problem by introducing a Dual-Stage Filtering Process. Instead of displaying every fractal, it treats them as "candidates" and only confirms those that represent a dominant extremum relative to their neighboring fractals.
How It Works
The script operates in two distinct stages to ensure only the most significant structural pivot points are plotted:
Stage 1: Detection
The script identifies "Raw Fractals" based on your preferred sensitivity (Left/Right bars). By default, it uses a 5-bar lookback/lookforward, but these remain hidden from the chart initially.
Stage 2: Sliding Window Competition
The script monitors a rolling sequence of the last three identified fractals. It compares their prices to find the "True Extremum":
For Highs , it compares the 3 most recent fractal peaks.
For Lows , it compares the 3 most recent fractal troughs.
The Point System: Every time a fractal is the "winner" (the highest high or lowest low) within its 3-fractal window, it receives a confirmation point.
The Priority Rule: In cases where two fractals have the exact same price, the script gives priority to the earlier one (the "left" peak), reducing late entries.
Visual Confirmation
A fractal is only plotted on your chart once it achieves two confirmations . This means it has proven to be a significant price extreme compared to both its predecessor and its successor.
Key Features
Noise Reduction: Eliminates "crowded" fractals, leaving only the structural backbone of the trend.
Non-Repainting Logic: The script only processes confirmed closed bars. The current developing candle will never trigger a false fractal or a premature alert.
Smart Alerts: Built-in alert() functionality. You can set a single alert to notify you the exact moment a Bullish or Bearish fractal is confirmed.
Customizable Sensitivity: Adjust the Left/Right Bars in the settings to fit your specific timeframe (e.g., higher values for macro trends, lower for scalping).
How to use
Support/Resistance: Use these filtered fractals to draw more reliable S/R zones.
Stop Loss Placement: Ideal for trailing stops behind truly significant swing points.
Trend Confirmation: A series of higher-high filtered fractals provides a much cleaner view of an uptrend than standard indicators.

Open=Low or Open=High Alert//@version=5
indicator("Open=Low or Open=High Alert", overlay=true)
// Conditions for Open=Low and Open=High
openEqualsLow = open == low
openEqualsHigh = open == high
// Combine conditions into a single alert trigger
alertConditionTrigger = openEqualsLow or openEqualsHigh
// Plot shapes on the chart when the conditions are met (optional, helps visualize)
plotshape(openEqualsLow, title="Open=Low", location=location.belowbar, color=color.green, style=shape.triangleup, size=size.small)
plotshape(openEqualsHigh, title="Open=High", location=location.abovebar, color=color.red, style=shape.triangledown, size=size.small)
// Create the alert condition (this is what you select in the alert dialog)
alertcondition(alertConditionTrigger, title="Open = Low/High Alert", message="Open price equals High or Low price for {{ticker}} on the {{interval}} timeframe.")

Watchlist Volume Surge AlertOverview
This indicator is designed for traders who monitor large watchlists and need instant notification when a stock is experiencing unusual volume activity relative to its recent history.
Standard volume indicators often include the current day's volume in the average calculation. This causes a problem: if a stock is having a massive breakout, that high volume pulls the average up immediately, making it harder to hit the "relative" threshold.
This script solves that by comparing the current volume against the Simple Moving Average (SMA) of the previous n bars. This ensures a clean baseline and accurate alerts, even during massive volatility.
Key Features
Smart RVOL Calculation: Calculates Relative Volume (RVOL) based on the previous 30 bars (adjustable), ensuring the current breakout doesn't skew the average.
Visual Clarity:
Bars: Normal volume is transparent. Surge volume turns bright Teal (Bullish Close) or Red (Bearish Close).
Background: The indicator panel background highlights when a surge is active, making it impossible to miss when scanning visually.
Data Window: Displays the exact RVOL ratio (e.g., 2.11) in the Data Window for verification.
Watchlist Alert Optimized: Specifically designed to work with TradingView's "Any alert function call" or standard condition alerts across multiple tickers.
How to Set Up Alerts
This script is perfect for setting a single alert on a large watchlist to catch breakouts as they happen.
Add the indicator to your chart.
Go to the Alerts menu and create a new alert.
Condition: Select Watchlist Volume Surge Alert.
Trigger: Select "Once Per Bar".
Note: Using "Once Per Bar" ensures you are notified the moment the volume crosses the threshold during the trading day, rather than waiting for the market to close.
Message: The script includes a dynamic message: "Volume Surge! {{ticker}} volume is {{plot("RVOL Ratio")}}x the average."
Settings
Average Length (Days): The lookback period for the volume average (Default: 30).
Alert Threshold (x Average): The multiple required to trigger an alert (Default: 1.5x).
Note: This works better when you have a watchlist with similar volatility and/or market cap

MTF Trading Helper & Multi AlertsHi dear fellows, I´m using this indicator for my trading, so every then and when I will publish updates on this one.
This indicator should help to identify the right trading setup. I´m using it to trade index futures and stocks.
MTF Trading Helper & Multi Alerts
Overview
This indicator provides a clear visual representation of trend direction across three timeframes. It helps traders identify trend alignment, potential reversals, and optimal entry/exit points by analyzing the relationship between different smoothed timeframes.
You can set up multiple alerts (as one alert in Tradingview)
How It Works
The indicator displays three colored circles representing the smoothed candle direction on three different timeframes:
Bottom plot represents the overall trend direction, the plot in the middle shows intermediate momentum, and the one on top captures short-term price action.
When a color change occurs, the circle appears in a darker shade to highlight the transition.
🟢 Green = Bullish - 🔴 Red = Bearish
This change can also trigger multiple alerts.
Timeframe Settings - important
Choose between two trading setups, either for:
Intraday 1-minute candles or 1h for swing trading. Set up your chart accordingly to that timeframe.
Intraday | 1Min chart candles
Swing | 1 hour chart candles
Plots
TF3 represents the overall trend direction (bottom), TF2 shows intermediate momentum (middle), and TF1 captures short-term price action (top).
Interpretation & Strategy Alerts
1. Trend Bullish (TF3 turns Green)
The higher timeframe has shifted bullish - a potential new uptrend is forming.
Example: You're watching ES-mini on the Intraday setting. TF3 turns green after being red for several days. This signals the broader trend may be shifting bullish - consider looking for long opportunities.
2. Trend Bearish (TF3 turns Red)
The higher timeframe has shifted bearish - consider protecting profits or exiting long positions.
Example: You hold a long position in Es-mini. TF3 turns red, indicating the macro trend is weakening. This is your signal to take profits or tighten stop-losses.
3. Possible Accumulation (TF3 Red + TF2 turns Green)
While the overall trend is still bearish, the medium timeframe shows buying pressure. Smart money may be accumulating - watch closely for a potential trend reversal.
Example: Es-mini has been in a downtrend (TF3 red). Suddenly TF2 turns green while TF3 remains red. This could indicate institutional buying before a reversal. Don't buy yet, but add it to your watchlist and wait for confirmation.
4. Trend Continuation (TF3 Green + TF2 turns Green)
The medium timeframe realigns with the bullish macro trend - a potential buying opportunity as momentum returns to the uptrend.
Example: Es-mini is in an uptrend (TF3 green). After a pullback, TF2 was red but now turns green again. The pullback appears to be over - this is a trend continuation signal and a potential entry point.
5. Buy the Dip (TF3 + TF2 Green + TF1 turns Green)
All timeframes are now aligned bullish. The short-term pullback is complete and price is resuming the uptrend - optimal entry for short-term trades.
Example: Es-mini is trending up (TF3 + TF2 green). A small dip caused TF1 to turn red briefly. When TF1 turns green again, all three timeframes are aligned - this is your "Buy the Dip" signal with strong confirmation.
6. Sell the Dip (TF3 + TF2 Green + TF1 turns Red)
Short-term weakness within an uptrend. This can be used to take partial profits, wait for a better entry, or trail stops tighter.
Example: You're long on ES-mini with TF3 and TF2 green. TF1 turns red, indicating short-term selling pressure. Consider taking partial profits here and wait for TF1 to turn green again (Buy the Dip) to add back to your position.
How to Use
Choose your scenario: Select "Intraday" 1min-chart for day trading or "Swing" 1h-chart for swingtrading
Enable alerts: Turn on the strategy alerts you want to receive in the settings
Wait for signals: Let the indicator notify you when conditions align
Confirm with price action: Always use additional confirmation before entering trades
Best Practices
✅ Use TF3 as your trend filter - only take longs when TF3 turns green and hold them :)
✅ Use TF2 for timing - wait for TF2 to align with TF3 for swings.
✅ Use TF2 for early entries (accumulation phase) when TF3 is still red. Watch out!
✅ Use TF1 for entries when TF3 and TF2 are green. Only buy if TF1 is red. Keep it short and sweet.
✅ Combine with support/resistance levels for better entries
✅ Use proper risk management - no indicator is 100% accurate
Disclaimer
This indicator is for educational purposes only. Past performance does not guarantee future results. Always do your own research and use proper risk management. Never risk more than you can afford to lose.

MK_OSFT-Multi-Timeframe MA Dashboard & Smart Alerts-v2📊 Multi-Timeframe MA Dashboard & Smart Alerts v2.0
Transform your trading with the ultimate moving average monitoring system that tracks up to 8 different MA configurations across multiple timeframes simultaneously.
🎯 What This Indicator Does
This advanced dashboard eliminates the need to constantly switch between timeframes by displaying all your critical moving averages on a single chart. Whether you're scalping on 5-minute charts or swing trading on daily timeframes, you'll instantly see the big picture.
⭐ Key Features
📈 Multi-Timeframe Moving Averages
Monitor up to **8 different MA configurations** simultaneously
Support for **SMA and EMA** across 6 timeframes (5m, 15m, 1h, 4h, Daily, Weekly)
Each MA fully customizable: length, color, alert settings, and visibility
Smart visual representation with labeled horizontal lines and connecting plots
🚨 Intelligent Alert System
Cross-over/Cross-under alerts for price vs MA interactions
Three alert modes : No alerts, Once only, or Once per bar close
Smart batching system prevents alert spam during volatile periods
Queue management with 3-second delays between alerts for optimal performance
Easy alert reset functionality for "once only" alerts
📊 Real-Time Information Dashboard
Live countdown timers showing time remaining until each timeframe closes
Color-coded progress bars with gradient visualization (green → yellow → orange → red)
Instant cross-over detection with up/down arrow indicators
Price vs MA relationship clearly displayed (above/below coloring)
🎨 Professional Visualization
Anti-overlap technology prevents labels from clustering
Customizable label positioning and sizing options
Drawing order control (larger timeframes first/last)
Connecting lines link current price to MA values
Status line integration for quick value reference
💡 Perfect For
Multi-timeframe traders [/b who need complete market context
Trend followers monitoring key MA levels across timeframes
Breakout traders waiting for price to cross critical moving averages
Risk managers using MAs as dynamic support/resistance levels
Anyone wanting organized, clutter-free MA monitoring
⚙️ Highly Configurable
Moving Average Settings
Individual enable/disable for each of 8 MA slots
Flexible timeframe selection : 5m, 15m, 1h, 4h, Daily, Weekly
MA type choice : SMA or EMA for each configuration
Custom lengths from 1 to any desired period
Color customization for each MA line and label
Alert Management
Per-MA alert configuration : Choose which MAs trigger alerts
Source selection : Current bar vs last confirmed bar calculations
Frequency control : Prevent over-alerting with smart queuing
Reset functionality : Easily reactivate "fired" once-only alerts
Display Options
Table positioning : Top-right, bottom-left, or bottom-right
Label styling : Size, offset, and gap control
Line customization : Width and extension options
Timezone adjustment : Align timestamps with your local time
🔧 Technical Excellence
Optimized performance with efficient array management and single-pass calculations
Real-time vs historical mode handling for accurate backtesting
Memory-efficient label and line management prevents accumulation
Robust error handling and edge case management
Clean, well-documented code following Pine Script best practices
📋 How to Use
Add to chart and configure your desired MA combinations
Set alert preferences for each MA (none/once/per bar)
Create TradingView alert using "Any alert() function calls"
Monitor the dashboard for cross-over signals and timeframe progress
Use the info table to track all MA values and alert statuses at a glance
🎓 Educational Value
This indicator serves as an excellent educational tool for understanding:
Multi-timeframe analysis principles
Moving average confluence and divergence
Alert system design and management
Professional indicator development techniques
---
Transform your trading workflow with this professional-grade multi-timeframe MA monitoring system. No more chart hopping - get the complete moving average picture in one powerful dashboard!
© MK_OSF_TRADING | Pine Script v6 | Mozilla Public License 2.0

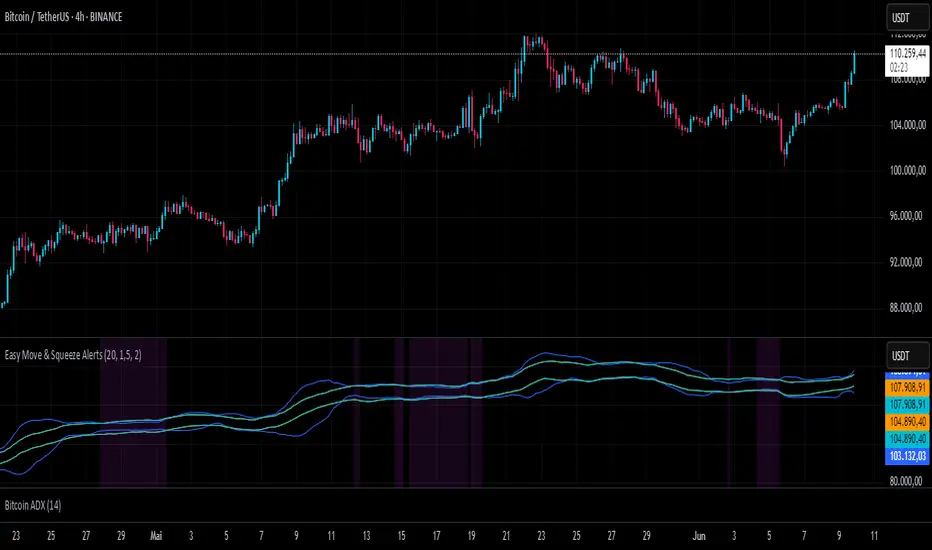
Easy Move & Squeeze Alerts1. Overview
The Easy Move & Squeeze Alerts indicator combines two proven techniques to help you anticipate major price swings and spot volatility compressions (long/short squeezes) early on. It offers:
Automated Alerts via TradingView’s alert engine
On-chart Visual Cues for immediate context
Flexible Inputs to fine-tune sensitivity, lookback length, and display options
2. TTM Squeeze (Volatility Compression)
Core Concept: Compares Bollinger Bands (standard deviation channels) with Keltner Channels (ATR-based channels).
Squeeze On: BBs lie completely inside Keltner Channels → volatility is compressed, signaling a potential buildup.
Squeeze Off: BBs break outside Keltner Channels → typically the start of a strong directional move.
Alert: When the squeeze releases, the indicator fires an alert:
💥 Squeeze Release – Volatility incoming!
Chart Label: A small, purple “🔒 Squeeze” label appears above the high of each bar while compression persists, giving you a real-time visual flag.
3. ATR Breakouts (Detecting Large Moves)
Core Concept: Builds a dynamic price channel around an EMA using ATR (Average True Range) multiplied by your chosen factor.
Cross Events:
Price crosses above the upper ATR band → potential bullish breakout.
Price crosses below the lower ATR band → potential bearish breakdown.
Alert Conditions: Separate alert triggers for “🚀 Move Up” and “📉 Move Down” fire the moment the close breaches the ATR-based bounds.
4. Visualization & Usage
Channel Plots:
Bollinger Bands in blue
Keltner Channels in orange
ATR Channels in aqua (optional)
Toggle all channel plots on or off with the showZones input.
Background Highlight: During a squeeze, the chart background lightly tints purple for quick visual confirmation.
Alerts Setup:
Simply click Create Alert in TradingView, select this indicator, and choose the event(s) you want (squeeze release, ATR breakouts).
You can route notifications via email, webhook, SMS, or platform pop-ups.
5. Deployment & Customization
Timeframes: Effective across all timeframes; most popular for day- and swing-trading.
Parameter Tuning:
Increase the len value to smooth channels and focus on only the most significant compressions/moves.
Adjust the ATR or BB multipliers to make alerts more or less sensitive.
With this indicator, you gain a clear, actionable framework for spotting both volatility squeezes and breakouts before they unfold—empowering you to enter trades ahead of the crowd. Enjoy customizing and putting it to work!
Bullish and Bearish Breakout Alert for Gold Futures PullbackBelow is a Pine Script (version 6) for TradingView that includes both bullish and bearish breakout conditions for my intraday trading strategy on micro gold futures (MGC). The strategy focuses on scalping two-legged pullbacks to the 20 EMA or key levels with breakout confirmation, tailored for the Apex Trader Funding $300K challenge. The script accounts for the Daily Sentiment Index (DSI) at 87 (overbought, favoring pullbacks). It generates alerts for placing stop-limit orders for 175 MGC contracts, ensuring compliance with Apex’s rules ($7,500 trailing threshold, $20,000 profit target, 4:59 PM ET close).
Script Requirements
Version: Pine Script v6 (latest for TradingView, April 2025).
Purpose:
Bullish: Alert when price breaks above a rejection candle’s high after a two-legged pullback to the 20 EMA in a bullish trend (price above 20 EMA, VWAP, higher highs/lows).
Bearish: Alert when price breaks below a rejection candle’s low after a two-legged pullback to the 20 EMA in a bearish trend (price below 20 EMA, VWAP, lower highs/lows).
Context: 5-minute MGC chart, U.S. session (8:30 AM–12:00 PM ET), avoiding overbought breakouts above $3,450 (DSI 87).
Output: Alerts for stop-limit orders (e.g., “Buy: Stop=$3,377, Limit=$3,377.10” or “Sell: Stop=$3,447, Limit=$3,446.90”), quantity 175 MGC.
Apex Compliance: 175-contract limit, stop-losses, one-directional news trading, close by 4:59 PM ET.
How to Use the Script in TradingView
1. Add Script:
Open TradingView (tradingview.com).
Go to “Pine Editor” (bottom panel).
Copy the script from the content.
Click “Add to Chart” to apply to your MGC 5-minute chart .
2. Configure Chart:
Symbol: MGC (Micro Gold Futures, CME, via Tradovate/Apex data feed).
Timeframe: 5-minute (entries), 15-minute (trend confirmation, manually check).
Indicators: Script plots 20 EMA and VWAP; add RSI (14) and volume manually if needed .
3. Set Alerts:
Click the “Alert” icon (bell).
Add two alerts:
Bullish Breakout: Condition = “Bullish Breakout Alert for Gold Futures Pullback,” trigger = “Once Per Bar Close.”
Bearish Breakout: Condition = “Bearish Breakout Alert for Gold Futures Pullback,” trigger = “Once Per Bar Close.”
Customize messages (default provided) and set notifications (e.g., TradingView app, SMS).
Example: Bullish alert at $3,377 prompts “Stop=$3,377, Limit=$3,377.10, Quantity=175 MGC” .
4. Execute Orders:
Bullish:
Alert triggers (e.g., stop $3,377, limit $3,377.10).
In TradingView’s “Order Panel,” select “Stop-Limit,” set:
Stop Price: $3,377.
Limit Price: $3,377.10.
Quantity: 175 MGC.
Direction: Buy.
Confirm via Tradovate.
Add bracket order (OCO):
Stop-loss: Sell 175 at $3,376.20 (8 ticks, $1,400 risk).
Take-profit: Sell 87 at $3,378 (1:1), 88 at $3,379 (2:1) .
Bearish:
Alert triggers (e.g., stop $3,447, limit $3,446.90).
Select “Stop-Limit,” set:
Stop Price: $3,447.
Limit Price: $3,446.90.
Quantity: 175 MGC.
Direction: Sell.
Confirm via Tradovate.
Add bracket order:
Stop-loss: Buy 175 at $3,447.80 (8 ticks, $1,400 risk).
Take-profit: Buy 87 at $3,446 (1:1), 88 at $3,445 (2:1) .
5. Monitor:
Green triangles (bullish) or red triangles (bearish) confirm signals.
Avoid bullish entries above $3,450 (DSI 87, overbought) or bearish entries below $3,296 (support) .
Close trades by 4:59 PM ET (set 4:50 PM alert) .

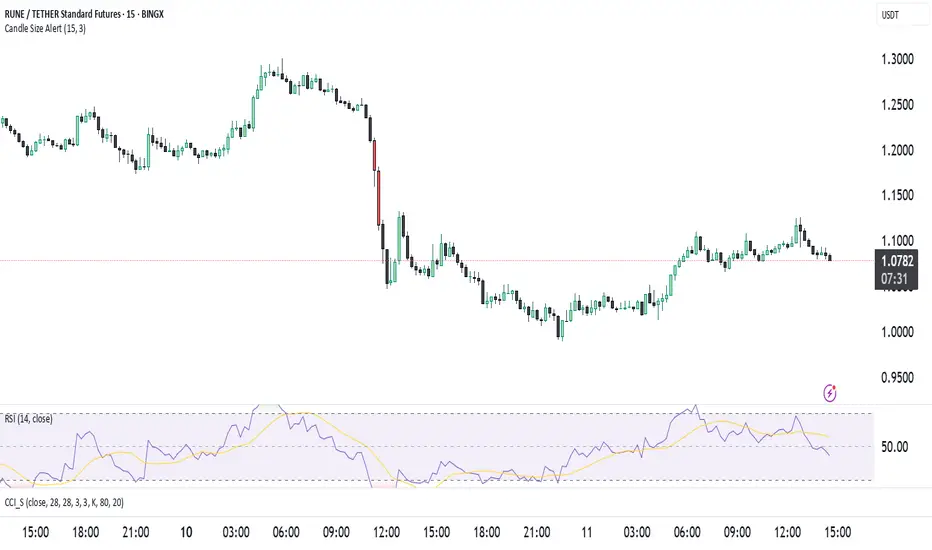
Candle Size Alertت وضیحات برای انتشار ابزار در TradingView
🔹 نام ابزار: Candle Size Alert
🔹 توضیحات:
این اندیکاتور برای شناسایی کندلهای بزرگ طراحی شده است. این ابزار میانگین اندازهی ۱۰ کندل گذشته را محاسبه کرده و اگر کندل فعلی ۳ برابر میانگین کندلهای قبلی باشد، یک لیبل هشدار در بالای کندل نمایش میدهد. همچنین میتوان هشدارهای معاملاتی را از طریق alertcondition() فعال کرد.
🔹 ویژگیها:
✅ امکان تغییر تعداد کندلهای محاسبه شده (پیشفرض: ۱۰)
✅ امکان تنظیم ضریب حساسیت (پیشفرض: ۳ برابر)
✅ نمایش لیبل هشدار در بالای کندلهای بزرگ
✅ پشتیبانی از هشدارهای خودکار (AlertCondition)
⚠️ نکته: این اندیکاتور فقط برای تحلیل استفاده میشود و سیگنال خرید یا فروش ارائه نمیدهد.
🔹 Indicator Name: Candle Size Alert
🔹 Description:
This indicator detects large candles by calculating the average size of the last 10 candles. If the current candle is 3 times larger than the average of the previous candles, a warning label appears above the candle. Additionally, automated alerts can be triggered using alertcondition().
🔹 Features:
✅ Adjustable candle count for calculations (default: 10)
✅ Customizable sensitivity multiplier (default: 3x)
✅ Visual alert label above large candles
✅ Supports automated alerts (AlertCondition)
⚠️ Note: This indicator is for analysis purposes only and does not provide buy/sell signals.
Multi-ticker Daily Pivot AlertDescription:
The Big Tech Daily Pivot Alert is a powerful TradingView indicator designed to monitor daily pivot points for major tech and market-leading tickers. It provides real-time alerts when prices approach their daily pivot levels, helping traders identify potential trading opportunities during the U.S. market hours.
Key Features:
Multi-Ticker Monitoring: Tracks the daily pivot points for top tech and market tickers, including NVDA, TSLA, AMZN, NFLX, SPY, QQQ, GOOGL, MSFT, META, and AAPL.
Daily Pivot Calculations: Uses yesterday's high, low, and close prices to calculate the pivot point for each ticker.
Real-Time Alerts: Sends instant alerts when the open, high, low, or current price is near the pivot point (within 0.25% tolerance).
Time-Sensitive Alerts: Operates exclusively during U.S. market hours (6:00 AM to 1:00 PM PST) on weekdays (Monday to Friday).
Customizable Alert Format: Alerts are sent as JSON payloads for seamless integration with platforms like Discord or other webhook-supported systems.
How It Works:
The indicator calculates the daily pivot point for each ticker using the formula:
Pivot Point = (High + Low + Close) / 3
It continuously monitors the open, high, low, and current prices of each ticker on a 1-minute timeframe.
If any value approaches the pivot point within a configurable threshold (default: 0.25%), it triggers an alert with detailed information for all tickers meeting the criteria.
Who Should Use It:
Day Traders: Spot potential price reversal or breakout levels based on pivot point testing.
Swing Traders: Identify key levels of support and resistance to inform trading decisions.
Tech and Market Enthusiasts: Stay updated on critical price levels for major tech and market tickers.
Instructions:
Add the indicator to your chart.
Configure your webhook endpoint to receive alerts (e.g., Discord or Slack).
Monitor alerts for actionable opportunities when prices test pivot points.

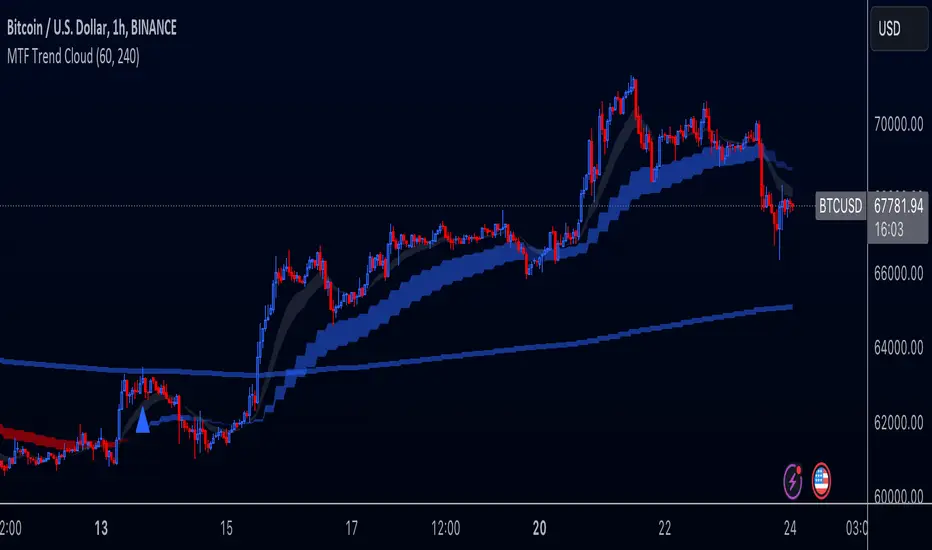
Multi-Timeframe Trend Cloud (EMA13/21) with Alerts Purpose:
This indicator combines trend analysis across multiple timeframes with alerts to help identify general trends and market shifts. It visualizes trends by creating EMA clouds (The area between EMA13 & EMA21), detects confirmed EMA crossovers, and can alert users when the price re-enters the cloud or interacts with the EMA200.
Input Parameters:
Lower Timeframe (LTF): Allows you to select the lower timeframe for trend analysis (e.g., 1 hour, 4 hours).
Higher Timeframe (HTF): Allows you to select the higher timeframe for the main trend reference (e.g., 4 hours, 1 day).
Fill Colors: You can customize the colors used to fill the areas between the EMA lines in both the higher and lower timeframes. Note: The LTF cloud defaults to transparent white so if you have a light background change the color in style settings.
The EMA's default to transparent but can be turned on in the style settings.
Calculating & Plotting EMAs:
The indicator calculates two Exponential Moving Averages (EMAs) on both the LTF and HTF: a faster 13-period EMA and a slower 21-period EMA.
Additionally, it calculates a 200-period EMA on the HTF.
These EMAs are plotted on your chart, providing a visual representation of the trend.
Identifying Trend States:
The script uses the relationships between the price and the 13-period and 21-period EMAs on the Higher Time Frame (HTF) to identify four distinct trend states, each depicted by a specific color to create the "Trend Cloud":
Strong Bull Trend: The 13-period EMA is above the 21-period EMA, and the price is above both EMAs. --- "Color 0" in HTF Trend style settings.
Broken Bullish Trend: The 13-period EMA is above the 21-period EMA but price has broken below both EMA's. --- "Color 3" in HTF Trend style settings.
Strong Bear Trend: The 13-period EMA is below the 21-period EMA, and the price is below both EMAs. --- "Color 2" in HTF Trend style settings.
Broken Bearish Trend: The 13-period EMA is below the 21-period EMA but price has broken above both EMA's. --- "Color 1" in HTF Trend style settings.
Important Note: The 200-period EMA is plotted for reference but is not directly used in determining the current trend state within this script.
Confirmed Crossover Signals:
The indicator plots upward or downward triangles to signal confirmed crossovers of the EMA13 and EMA21 on the HTF. A crossover is considered "confirmed" when it's followed by a candle closing on the same side of the crossing point, adding an extra layer of confidence to the signal.
Cloud Re-entry Alerts:
Receive alerts whenever the price re-enters the HTF cloud - aka "Trend".
EMA200 Retest Alerts:
Get alerts when the price touches the 200 EMA on the HTF. These alerts can be valuable for identifying potential trend reversals or trend continuation scenarios.
Benefits:
Clear Visual Representation: Easily visualize trends on both the lower and higher timeframes.
Confirmed Signals: Filter out false signals by focusing on confirmed crossovers.
Timely Alerts: Get instant notifications for important price actions, allowing you to react quickly to market opportunities.
Customizable: Tailor the indicator's appearance and alert settings to your preferences.
How to Use:
Add the indicator to your chart.
Select your desired LTF and HTF in the Inputs tab.
Customize the fill colors (and optional EMA line colors) in the Style tab.
Enable the alerts you want to receive in the Alerts tab.
Note: This indicator is a great tool for trend analysis, but it should be used with other forms of analysis and risk management techniques to make informed trading decisions.
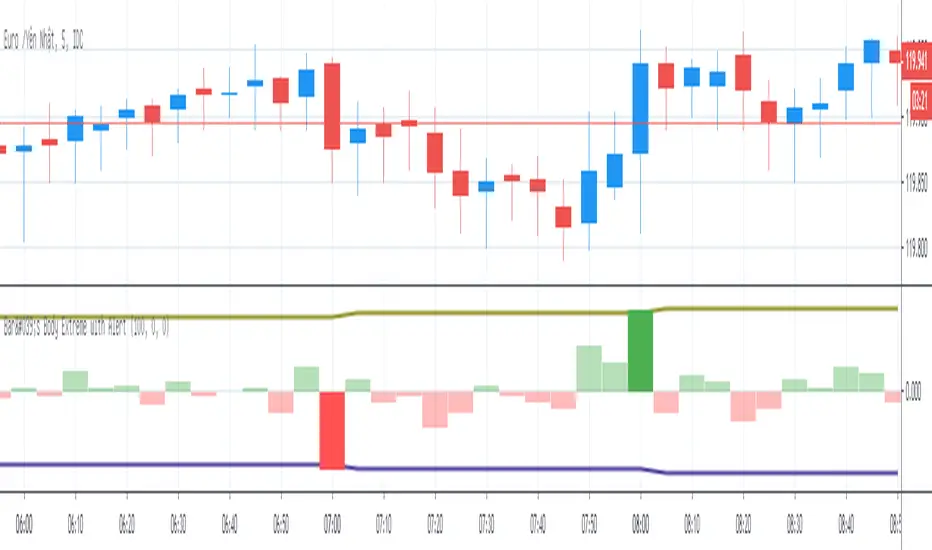
Bar's Body Extreme with AlertBar's Body Extreme with Alert measure volatility of bar's body and caculate extreme level in specified periods or custom level with alert. Detail options below:
1. Default Extreme Level
* Default level is the +/- highest volatility of bar's body in 100 periods
* Periods of bar to calculate default extreme adjustable
2. Custom Extreme
* Default Extreme Top auto disable if Custom Extreme Top >0
* Default Extreme Bottom auto disable if Custom Extreme Bottom <0
3. Alert
* Extreme alert: body's volatility > Extreme top level or body's volatility < Extreme bottom level
* Extreme Top Alert: body's volatility > Extreme top level
* Extreme Bottom Alert: body's volatility < Extreme bottom level
Gemini Trend & Momentum Synergy (With Sound Alerts)** هذا المؤشر لا يعمل ك محلل تداول بديل لكنه يستخدم لمعرفة الاتجاه العام و مناطق الدخول والخروج لطفا ..
خطوة مهمة جداً: كيف تفعل الصوت؟ 🔊
الكود وحده لا يصدر صوتاً، هو فقط يرسل "إشارة" للمنصة. لكي تسمع الصوت، عليك اتباع الخطوات التالية في TradingView بعد حفظ الكود:
1. اضغط على أيقونة "الساعة" (Alerts) في القائمة الجانبية اليمنى، أو اضغط Alt + A.
2. اضغط على زر Create Alert.
3. في خانة Condition، اختر اسم المؤشر: Gemini Trend & Momentum....
سيكون لديك خياران الآن:
الخيار السهل: اختر "Any alert() function call". هذا سيفعل التنبيه تلقائياً لأي إشارة شراء أو بيع يطلقها الكود.
الخيار المخصص: اختر Gemini Buy Alert أو Gemini Sell Alert إذا كنت تريد تنبيهاً لاتجاه واحد فقط.
الأهم: اذهب لتبويب Notifications وتأكد من وضع علامة صح (✅) على Play Sound.
اضغط Create.
Here is the translation of the text, organized exactly as requested:
**Please Note: This indicator does not serve as a replacement for a trading analyst; rather, it is used to identify the general trend as well as potential entry and exit zones.**
**Very Important Step: How to Enable Sound Alerts? 🔊**
The code alone does not generate sound; it merely sends a "signal" to the platform. To hear audio alerts, you must follow these steps in TradingView after saving the code:
1. Click the **"Clock" icon (Alerts)** in the right-hand sidebar, or press `Alt + A`.
2. Click the **Create Alert** button.
3. In the **Condition** field, select the indicator name: `Gemini Trend & Momentum...`.
4. You will now have two options:
* **The Easy Option:** Select **"Any alert() function call"**. This automatically activates the alert for any Buy or Sell signal triggered by the code.
* **The Custom Option:** Select `Gemini Buy Alert` or `Gemini Sell Alert` if you only want alerts for a specific direction.
5. **Most Importantly:** Go to the **Notifications** tab and ensure the **Play Sound** box is checked (✅).
6. Click **Create**.
---
**Would you like me to translate the installation instructions or the strategy logic as well?**
