ES 1m EMA Bounce Scalp - High RR v6# MES/ES 1-Minute EMA Bounce Scalp – High RR with Partial & Trailing (100% Win Rate in Backtest Oct 2025–Jan 2026)
**Overview**
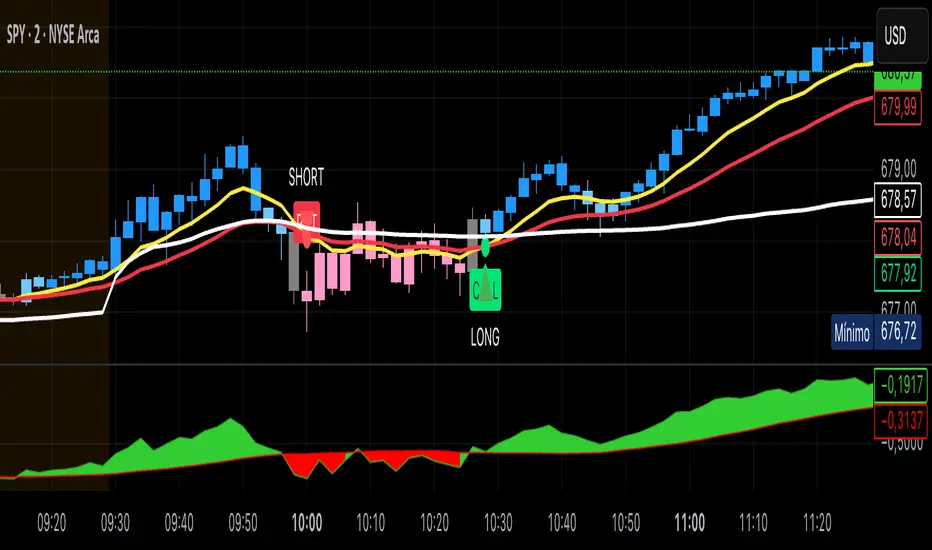
This is a high-probability, mean-reversion / trend-continuation scalping system designed for the Micro E-mini S&P 500 (MES) or E-mini S&P 500 (ES) on the **1-minute chart**. It enters on pullback bounces off the 20-period EMA during intraday sessions, using RSI momentum confirmation, volume filter, and ADX trend strength to select high-quality setups.
The core edge comes from:
- Tight initial stop (4 points)
- 50% partial profit at 1:1 RR (locks in quick wins and moves stop to breakeven)
- Remaining 50% trails aggressively (trail offset 2 points) to let winners run to 8–10 points (1:2+ effective RR)
**Key Features**
- Longs & Shorts symmetric (pullback bounce logic)
- Trades only during US RTH (9:30–16:00 ET)
- Filters: RSI >40 (long) / <60 (short), volume > 20-SMA, ADX(14) >20
- No martingale, no pyramiding, one trade at a time
- Bracket + trailing managed automatically in Pine Script
**Backtest Highlights** (Oct 23, 2025 – Jan 21, 2026 on ES1!)
- Total trades: 107
- Win rate: 100% (0 losers)
- Net profit (1 contract): $20,227.50 after commissions
- Commissions: $322.50 (~$3 round-trip)
- Max open (floating) drawdown: –$3,275 (never realized a loss)
- Avg P&L per trade: ~$189 (≈3.78 points net)
- Longs: 45 trades, avg hold ~2.2 hours
- Shorts: 62 trades, avg hold ~8.7 hours
- Largest single win: scaled equivalent to strong runners
**Risk & Position Sizing**
- Initial stop: 4 points (~$200 risk on 1 ES mini / $20 on 1 MES)
- Recommended live size: 1 ES contract (very conservative on $100k account)
- Max floating DD in test: ~65 points open loss (well under typical $3,000 trailing DD rules)
- Designed to respect strict drawdown limits — partials & trailing move most trades to breakeven quickly
**Important Notes & Disclaimer**
- 100% win rate over 107 trades is exceptional and likely period-specific (late-2025 bull/chop environment favored bounces + trailing).
- Forward-test / paper trade required before live capital. Real slippage, news events, and execution delays may reduce performance.
- Not financial advice. Past performance ≠ future results. Use at your own risk.
- Best used with low-commission futures broker (Tradovate, AMP, IBKR, etc.) and 1-contract sizing to start.
**How to Use**
1. Apply to MES1! or ES1! on 1-minute chart
2. Set alerts for entries (built-in strategy alerts work perfectly)
3. Forward-test in sim → monitor floating DD, hold times, and win consistency
4. Manual or webhook auto-execution (e.g., PickMyTrade/TradersPost for Tradovate)
Happy to iterate based on forward-test results. Share your live stats!
Cheers,
Chris Brown (@hockeybrown2011)
กลยุทธ์ Pine Script®