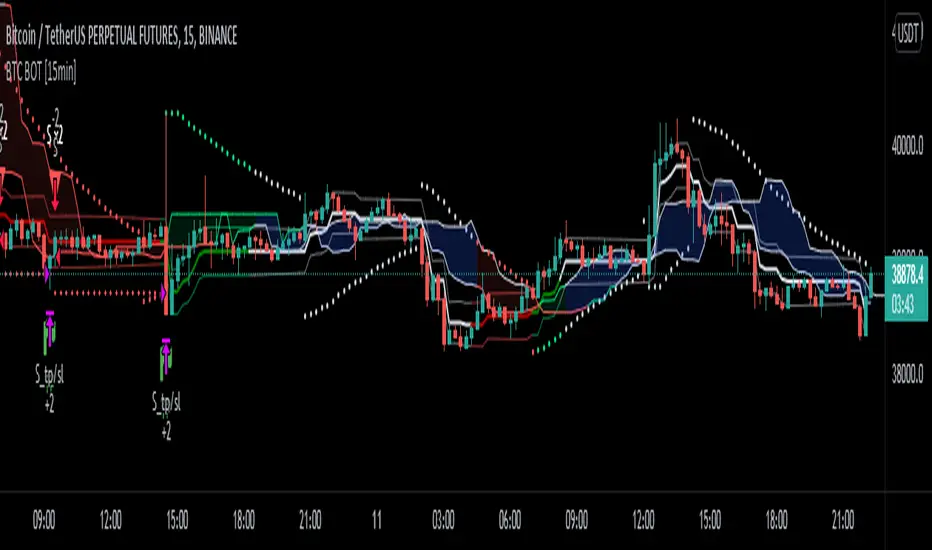
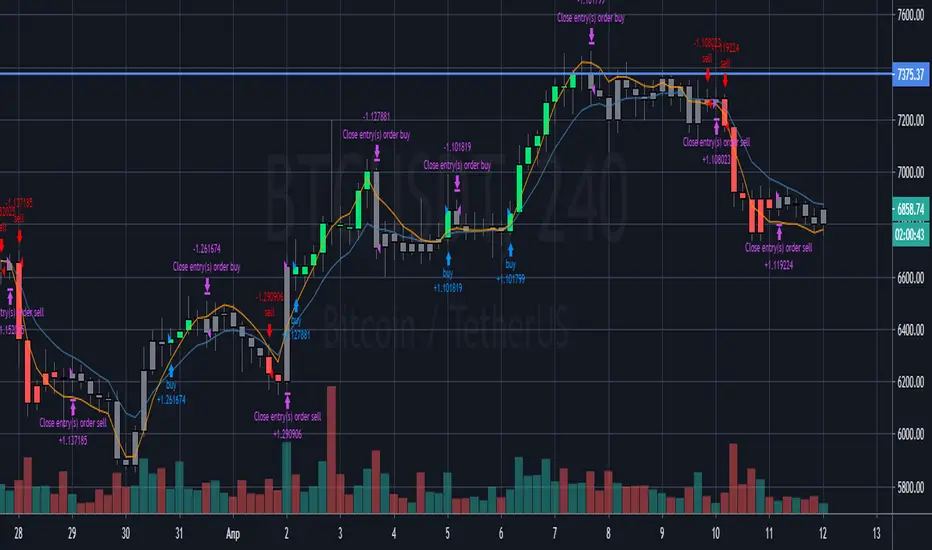
BTC BOT [15min]This BOT is specialy designed for BTCUSDT 15 min Chart. It reacts to every Upward/Downward direction as fast as possible. It does not work well on higher time frame.
This BOT using 10 indicators to open a basic LONG/SHORT position.
1. CLOUD
2. TREND DETECTOR
3. TREND STRENGTH
4. PARABOLIC SAR
5. JMA
6. RANGE FILTER
7. ADX
8. TWAP TREND
9. FAST MA
10. MOMENTUM
This BOT also use 02 independent strategies for entering positions.
1. REVESALS (RSI Crossovers)
2. SCALPING (It can increase net profit but it can be risky)
ADX is the main component of this BOT.
This is purely BTC 15min strategy but this BOT could be easily convert into Altcoins Scalper.
ค้นหาในสคริปต์สำหรับ "adx"
Crypto Spot Market Bot | BacktestHello Friends.
This script is only for long positions.
How does the algorithm work ?
The Relative Momentum Index
Relative Strength İndex
Average Directional Movement İndex
Momentum
When rsi and adx produce signals in the same direction, the rmi indicator confirms the signal. After the Confirmed Signal, the buy-side transaction is entered , the closed according to the % of profit taking and stoploss specified on the algorithm in the entered transaction.
In the spot market, it is possible to make money even in a down trend
All shared charts run within a 1-hour time frame.
Note : The shared backtest results have been shared as of 9/9/2021 by calculating 50% balance and 2 pyramiding methods in an account of 1000 dollars. Keep in mind that this algorithm will want to try to average down in possible worst-case scenarios. 2% - %3take profit levels will provide consecutive gains in the spot market.
How should the adjustments be made?
Value variables should be made according to formula a and formula b values and backtest results. You can increase the frequency of transactions by lowering the adx and rsi values.
Overview :

TopTenAlgo 10. SQZMOM Algorithmic Strategy with Alerts & SignalsEN: This Algorithm is a derivative of John Carter's "TTM Squeeze" volatility indicator. Many strategists have taken the indicator on Tradingview with simple moving averages and have looked at the biggest mistake only by dealing with squeeze and exit processes to squeeze. But I used the algorithm to determine where the markets would actually explode. For example, instead of using SMAs , I tested them on the Linear Regression Curve using Volume Weighted Moving Averages and Hull MAs. This gave me the opportunity to develop a more responsive algorithm and identify where the actual explosion would occur. The Gray Circles in the midline show that the market is entering a new jam (in the Bollinger Bands and Keltner Channel). This means low volatility , the market prepares itself for an explosive move (up or down). White Circles mean that it is about to get out of the jam. The Blue Circles, which no one can calculate, now inform that the exit is no longer jammed and that the explosion has taken place.
Mr. Carter recommends that you wait until the first gray after a gray cross and take a position in the momentum direction (for example, if the momentum value is above zero, relax). Exit position when the momentum changes (increase or decrease, this is indicated by a color change). In this algorithm, I tried to achieve good entry points using an additional indicator such as ADX and WaveTrend. To draw the histogram, I used a different method based on Linear Regression . Mr.Carter uses a simple momentum indicator. Strategy, alarms and signals have been added to the indicator so that you can optimize in algorithmic trading.
In summary, this algorithm is a strict algorithm in which additional 4-5 indicators are blended. Conveniences for Everyone ...
TR: Bu Algoritma John Carter'ın "TTM Squeeze" volatilite göstergesinin bir türevidir. Bir çok stratejist Tradingview' de gösterge' yi basit hareketli ortalamalarla ele almış ve en büyük hatayı sadece sıkışma ve sıkışmadan çıkış süreçlerini ele alarak bakmışlardır. Fakat ben algoritmayı piyasaların asıl patlama yapacağı yeri tespit etmek için kullandım. Örneğin SMA' ları kullanmak yerine Hacim Ağırlıklı Hareketli Ortalamaları ve Hull MA' ları kullanarak onları Linerar Regresyon Eğrisinde stress testine tabi tuttum. Buda bana daha duyarlı bir algoritma geliştirmem ve asıl patlamanın olacağı yerleri tespit etmem için fırsat verdi. Orta hattaki Gri Daireler, piyasanın yeni bir sıkışmaya girdiğini gösteriyor ( Bollinger Bantları ve Keltner Kanalı'nda). Bu, düşük volatilite anlamına gelir, piyasa kendisini patlayıcı bir harekete hazırlar (yukarı veya aşağı). Beyaz Daireler ise sıkışmadan çıkmak üzere olduğu anlamına gelir. Hiç kimsenin hesap edemediği Mavi Daireler ise artık sıkışmadan çıkıldığını ve patlamanın gerçekleştiğini haber verir.
Mr.Carter, gri bir çarpı işaretinden sonra ilk griye kadar beklemenizi ve momentum yönünde bir pozisyon almanızı önerir (örneğin, momentum değeri sıfırın üstünde ise, rahat olun). Momentum değiştiğinde pozisyondan çıkın (artırma veya azaltma, bunu o bir renk değişikliği ile belirtilir). Bu algoritmada ben, ADX ve WaveTrend gibi ek bir gösterge kullanarak iyi giriş noktalarıelde etmeye çalıştım. Histogramı çizmek için ise Linear Regresyon tabanlı farklı bir yöntem kullandım. Mr.Carter basit bir momentum göstergesi kullanır. Göstergeye algoritmik işlemlerde optimizasyon yapabilmeniz için strateji, alrmlar ve sinyaller eklenmiştir.
Özetle bu algoritma ek 4-5 göstergenin harmanlandığı sıkı bir algoritmadır. Herkese Kolaylıklar dilerim...

[USDCHF-USDCAD] H1 Predict signal DinhChienFX's [2 orders]Identify trend:
4 EMAS 50-100-150-200:
- Uptrend: ema: 50 > 100 > 150 > 200
- Downtrend: ema: 50 < 100 < 150 < 200
Pivot:
- Left: 15 candles
- Right: 15 candles.
- Uptrend: Higher low - Higher High
- Downtrend: Lower Low - Lower High.
Keltner Channel:
- Uptrend: Candle crosses Upper 2.
- Downtrend: Candlestick crosses the Lower 2 line.
Strong trend according to ADX indicator:
- DI: 9
- Smooth: 9
- ADX: 38
Order entry point:
- Buy: Upper Keltner
- Sell Lower Keltner
Take Profit/Stop Loss: atr (20) x2 = Height of Keltner channel from Lower to Upper line.

Predict DinhChienFX's1. Identify the trend
* On the chart:
a. Part of Dow theory: multi-trades active at the impulse waves.
Uptrend trend:
- HH / Higher High: The following peak is higher than the previous one.
- HL / Higher Low: The back bottom is higher than the previous one.
Downtrend:
- LL / Lower Low: The back bottom is lower than the previous one.
- LH / Lower High: The posterior peak is lower than the previous one
b. Keltner price channel:
Uptrend: Go above Upper 2
Bearish trend: Down to Lower 2
* Under Chart:
Stochastic indicator: 21 past candles
- Uptrend: Index K and D surpass 80
- Buy zone: Index D is large 80.
----------------------------
- Downward trend: K and D indexes go down to 20.
- Sell zone: Index D is less than 20.
RSI indicator: 21 past candles
- Uptrend: value exceeds 80.
- Downward trend: value exceeds 20.
ADX indicator: Used to identify a strong trend
- ADX smooth: 9
- DI: 9
2. Entry point:
- Buy: wait to buy on the Upper Keltner channel.
- Sell (sell): wait for sell at the Lower Keltner channel.
3. Take profit, stoploss
ATR indicator (20) (Average true range) * 2

POW EdgeHello fellow Trading View member,
Eventually our rebranded update with some extra features for our exclusive 'Edge' Strategy Script.
In this description I will run through;
The strategy itself, what is it?
What does it do?
How does it work?
How can it help you?
How good is it?
What is it.....
The Edge Strategy itself is based upon 5 indicators lining up in total confluence to enter a position in line with a trending move. Adding them together adds more confluence and probability to each individual trade outcome over the longer term. The individual strategies used are based on Trend strategies all used in combination.
The uniqueness to this is how they are combined. Indicators can work to a point individually of course, but combining them together and only trading when all are in a line was our concept, whilst reviewing how each individual indicator can be optimised to work with the others.
Also the motivation was to be the right side of the market in a trending move and capitalising on as much as that move as possible.
The first part is to ensure the candle close is above or below our moving average, we can then check the state and validity of each of the other 4 indicators. Once this confluence is in alignment a trade is valid for entry - this has to be valid at the same time - but not all valid on the same candle - they will come into alignment in different stages. But once they are, our trade is valid.
I will not reveal the other individual 3 indicators but the other is also an ADX function to add a threshold into the strategy to identify a trend - usually above 20/25. This has upsides and downsides as any user can visualise and see in the testing.
We also add to the script to look for a Buy then Sell, Sell then Buy - we found this had more profitable results overall and next phase was to review the money management; where and how we placed our SL and when and why we exited the trade.
Example - for a BUY trade to be valid, all 5 indictors must meet their own criteria before a BUY is printed on the chart. Absolutely no technical analysis is needed to trade this strategy and the data we have is based on using the strategy in isolation - how you wish to use this either independently or supporting your own trading is of course, up to you.
The SL and TP's are based on ATR Multipliers thus ensuring we are factoring in market volatility at that time. We also have a FT (Follow Trend) option, which is a worthy addition for capitalising on big trending moves.
This strategy will work on all markets and timeframes.
We understand and accept that all pairs and markets are different thus we have optimised certain pairs and timeframes with different parameters to provide increased returns, these are hard coded (H1 Timeframe) and also provided for your review.
Profitability is easily viewable in the ‘Strategy Tester’ - this is a great tool. This is where you can see historic / live data for the strategy.
Data like;
The Net Profit
Number of trades
Win Percentage
Every trade taken
Average Win
Average Loss
Maximal DD , etc.
We have individually optimised each pair to ensure this is the case and hard coded these parameters into the strategy. All you need to do is flick between the pairs - the strategy will then identify the pair you are on and change the parameters to suit in the background.
Whilst a trade is open, the strategy will convert all candles to the relevant colour - Green for an uptrend and Red for a downtrend (all customisable).
We find this is helpful for traders psychology - not getting 'spooked' by other candle colours, affecting your decision making.
When a new signal is valid, 'POW BUY' or 'POW SELL' will be displayed on the first candle open for entry. As well as this, you will also have the trade label print which will display the following;
- EP – Entry price
- SL – Stop loss
- TP – Take Profit
- Lot size
The trade information printed will also tell you the pip values of your stop loss and take profit based on how far away they are from the trade entry price.
The lot size printed is customisable and unique to your account- within the strategy settings you can simply input your account balance, currency and risk approach which includes a fixed risk amount, fixed lot size or a fixed percentage.
This removes the need for 3rd party apps or websites to quickly calculate your specific risk on your trade. Thus saving you time and making sure you aren't 'guessing' with your lot size.
No one likes losing more than they thought.
The progress and initial challenges....
To start, our first version simply showed the buy and sell arrows when a trade was valid. However, this caused subjectivity with where we would place our stop loss and how we would manage the exit of the trade once we were in it. So, we identified a solid strategy for this was incorporating the Average True Range (ATR) for SL and TP options.
I was especially keen to add the SL and exit management so I could obtain solid back testing data to support my thoughts that 'this works'. Every trader requires confidence and belief in their strategy, without it you simply won't succeed or be disciplined in your execution.
The other challenge we all face is calculating the lot sizes of our trades right? So, it was important that we incorporated a lot size calculator - its all about making it easy when a trade is valid to enter without trying to calculate this accurately.
Lastly, when pairs are stuck in a range - this can be a testing period of 'chop' for a trend strategy, so we also incorporated the ADX function to enable us to set a threshold level to identify when the instrument is more likely to be trending.
What does it do?
Ultimately, tells you when to buy and sell - where to place your SL and when to exit. Whilst also ensuring your risk management is on point, by displaying your trading lot size. Also providing you with live back tested data at your finger tips thank you to the strategy tester.
How does it work?
This will be visible on your trading view charts once you get access. And will work across all your devices, the trading view website or the app on your phone for example.
You can also use Trading View alerts, so you won't miss a trade and can go about your day as normal without watching the screen. This will work on the Free version of TV, however, in order to benefit from more alerts and templates it makes sense to upgrade to a higher package.
How can it help you?
This will help give you a mechanical approach to your trading. This means, less decision making on your part, with the instant benefit of seeing the data you have at your fingertips thanks to the 'Strategy Tester' TV Function.
It will save you time, you don't need to be in front of your screen or completing any subjective analysis.
Integrated lot size calculator can ensure you are always accurate with your risk - either in percentage or a fixed amount of risk - whichever you prefer.
Understand Probability - this is the key one for me. Losing runs happen in any trading strategy. The great benefit here, is you can see them. How long were the losing runs? How can I prepare and plan my risk management around them are all fundamental keys to managing your emotions and being detached from your trades. No one wants to feel stressed or anxious when trading.
Customisable exit strategies - A specific TP for a 1:1 RR or 1:10 RR for example can be adjusted and you can see instantly how this affects the profitability.
The exit strategy options are shown below;
TP 1/2/3
FT - Follow Trend (no stop loss and follow's from Buys to Sells, Sell to Buy, etc.
SL + FT - SL present, but trade is held until a reverse signal is presented.
How good is it?
We have some really positive back testing data across a range of pairs and markets - equities and indices too.
Drop me a DM to see these and I'll be happy to share.
Below let me show you a screen shot of how this can work for you.
How do you access this?
Please visit our website for signup / purchase information in the first instance (the link is on our trading view signature) or send us a private message on here - its impossible to keep track of comments on our posts so to ensure we don't miss you, a private DM will be great please.
The Back test shown on this example is based on the Trading View mid price and also a realistic starting Capital of £10,000. This test result is also based on a 0.1% risk per trade, with a 5 tick spread and a commission of
Regards
Darren
Disclaimer alert.
Please remember past performance is exactly that - how our strategy performed over those dates tested, it is not obviously a guarantee of future performance. Most of our H1 data is valid from Jan 2017 to now - so 4+ years and data on 650+ trades per pair.

Bull Call Spread Entry StrategyThis strategy script uses the "Spread Entry Strength" overlay indicator script I designed to show entry timing optimized for an Option Bull
Call Spread.
As for this strategy...
The defaults for the strategy itself are as follows:
Period for strategy: 1/1/18 to 12/1/2021. This can be changed to a different period using the settings.
Condition for entry:
Bull Spread Entry Strength >= "Overlay Signal Strength Level"
Limit entry is used, price must be <= close when signaled
Entry occurs by next day or the order is cancelled
Condition for exit (uses a timed exit):
Bars passed since order entry >= 30 (6 weeks..~42 calendar days)
Thursday (day before "option" expiration date... assuming weekly options exist)
All of the user settings from the overlay are pulled into this for customization purposes. Details of the actual Spread Entry Strength overlay are as follows (copied from my shared indicator):
2 background shadings will occur:
The background will shade blue if the ticker is prime for a Bullish Call spread.
The background will shade purple if the the ticker is prime for a Bearish Put spread.
In theory, if the SE Strength is at one of the extremes of the Bear or Bull side, then a spread is prime for entry.
To calculate this, 8 conditions receive a 1 or zero dependent on whether the condition is true (1) or false (0), and then all of those are summed. The primary gist of the strength comes from Nishant's book, or my interpretation thereof, with some additives that limits what I need to review (such as condition 8 below.)
The 8 Bull Conditions are:
1) Bollinger Bands are outside of the Keltner Channels
2) ADX is trending up
3) RSI is trending up
4) -DI is trending down
5) RSI is under 30
6) Price is below the lower Keltner Channel
7) Price is between the lower Bollinger Band and the Bollinger basis.
8) Price at one point within the last 5 bars was below the lower Bollinger Band
The 8 Bear Conditions are the inverse conditions (except the first):
1) Bollinger Bands are outside of the Keltner Channels
2) ADX is trending down
3) RSI is trending down
4) +DI is trending up
5) RSI is over 70
6) Price is above the upper Keltner Channel
7) Price is between the upper Bollinger Band and the Bollinger basis.
8) Price at one point within the last 5 bars was above the upper Bollinger Band
There is a "market noise" filter that will filter out shading when another market move is considered, i.e. if you don't want to see the potential trade when QQQ moves more than 1% then do the following in the settings:
Check "Market Filter"
Enter QQQ in the "Market Ticker To Use"
Enter 1 in the "Market Too Hot Level"
Press Ok
Obviously, the same holds true for the "Market Too Cool Filter."
Second release notes:
Overlay Signal Strength Level - You can set your own "level" for the overlay in the settings, instead of having to change the script code itself. I have the default set to 6. A lower number shows more overlays, a higher number shows fewer (i.e. more conditions have been met.).
Provide Narrative (Troubleshooting) - Narrative label created with several outputs that will show after the last bar. This narrative needs to be turned on in the settings, as the default is "off" ... unchecked.
Remove Strength Indicator When Squeezed - when checked no overlays will be produced regardless of "scoring." Default is off.
Show Squeezes (Will Override Indicator When Concurrent) - overlays an orange background when the ticker is in a squeeze. I am still working on the accuracy here, but it's usable. This will override the strength indicator as well. This needs to be turned on, if you want it.
Short SMA Period - period used to calculate the short SMA, used in the narrative only, at this point in time.
Medium SMA Period - period used to calculate the medium SMA, used in the narrative only, at this point in time.
Long SMA Period - period used to calculate the medium SMA, used in the narrative only, at this point in time.
Outside of the settings... a few calculation adjustments here and there have occurred and some color shading adjustments to allow for the adjustable level setting.

Cyatophilum Scalper [BACKTEST]This indicator comes with a backtest and alert version. This is the backtest version. Its purpose is to create low timeframe and scalping strategies, by choosing from a list of built-in entry points which are described in detail below, and by configuring a risk management system to your liking.
Before diving into the entry points, I will explain the strategy and risk management settings.
These 3 settings allow to choose your strategy direction, and main behavior.
- Go Long ↗: activate or deactivate long entry points.
- Go Short ↘: activate or deactivate short entry points.
- Reversal strategy ↗↘↗↘: Activate this option will allow trades to reverse position from an opposite entry point. Keep it deactivated and trades will either wait a TakeProfit(TP) or StopLoss(SL) to be closed. When neither SL nor TP or set, this option is automatically activated.
StopLoss settings:
Both Long and Short SL can be activated and configured.
The base % price is the starting point of the stoploss, in a percentage of current price.
Trailing stop, when activated, works with 2 settings:
- % Price to Trigger: a percentage of current price the price should move in a bar to trigger a trailing movement.
- % Price Movement: the stoploss variation in a percentage of current price that moves on each bar.
TakeProfit settings:
Both Long and Short TP can be activated and configured.
The base % price is the value of the TP, in a percentage of current price.
Trailing Profit Deviation %: Percent deviation for the trailing take profit.
DCA:
DCA stands for Dollar Cost Average. The idea is to open additional orders from the base order so as to improve risk management.
These additional orders are also called Safety Orders. The indicator can handle up to 9 safety orders.
The strategy will exit either from a take profit based on percentage from base order or from a total volume percentage (Configurable in the parameters).
The steps spacing (space between each step) and safety orders volume (order size) can both scale by adding a scale multiplier.
By choosing from the base strategy dropdown menu, the indicator will generate entry points.
1. BUY SELL:
-> Low timeframes spot trading, with simple buy and sell orders.
How it works:
The indicator used is a combination of QQE (Atr based trend following indicator) and RMA 100 trendline.
I think the QQE does a great job in low timeframes because it is not impacted by the noise.
The RMA which is the moving average used in the RSI, will help giving confirmation to the entry points.
How to use:
It is meant to be used as a reversal strategy, but you can add a TP or SL if you want.
When comparing to Buy & Hold, make sure to deactivate the "Short results in the backtest" setting.
2. TREND SCALPING
-> A strategy for low timeframes trading.
How it works:
The strategy creates high volatility entries filtered by a duo convergence of adaptive trendlines (Adaptive HULL MA using the chart's resolution, Adaptive Tilson T3 using 1H resolution) and a higher timeframe (1H) RSI filter (long threshold: 70, short threshold: 40, RSI length: 10).
How to use:
Must be used on charts with a resolution smaller than 1H. Recommended: from 1m to 30m.
Must NOT be used as reversal strategy. Use it with a take profit and stop loss, and DCA if you can.
Sample risk management settings:
3. Support/Resistance BREAKOUTS
-> Trade low timeframes pivot points breakouts.
How it works:
The indicator calculates the 100 previous bars swing high and low. Any break above high or below low will trigger an entry point.
The entry is however filtered by an Adaptive Tilson T3 Trendline, an ADX 30 minimum threshold and a minimum average volume threshold.
How to use:
I recommend to click "Reversal" Strategy and set a Takeprofit target.
Find the best timeframe between 1m and 30m using the backtest version.
Example here with BTCUSDTPERP on 15m:
4. AGGRESSIVE SCALPING
-> Lots of trades in low timeframes.
How it works:
Created using Cyato AI, Higher/Lower Highs and Lows and 2 HULLMA crosses as entries, and 2 Adaptive Tilson T3 as trendfilter, a 25 ADX threshold filter and a volume filter.
How to use:
Recommended Risk Management settings: Takeprofit, Stoploss and DCA (Safety orders).
Find which timeframe work the best from 30 min and below. Should not be used above 30 min since this is the resolution for the MTF Tilson.
How to create Strategy Alerts:
Write your alert messages for EXIT, LONG and SHORT orders in the settings (Backtest section).
Then click add alert, and in the alert message, write the following:
{{strategy.order.alert_message}}
BACKTEST PARAMETERS
- Inital capital: 10 000$
- Base order size: 0.1 contract (0.1 btc)
- Safety order size: 0.1 contract (0.1 btc)
- Commission: 0.1%
- Slippage: 100 ticks
Oldest trade: 2020-08-31
Backtest Period: From 2020-08-31 to 2020-11-12
Configuration used: see the live chart configuration panel at the top.
To gain access to this paid indicator, please use the link below.

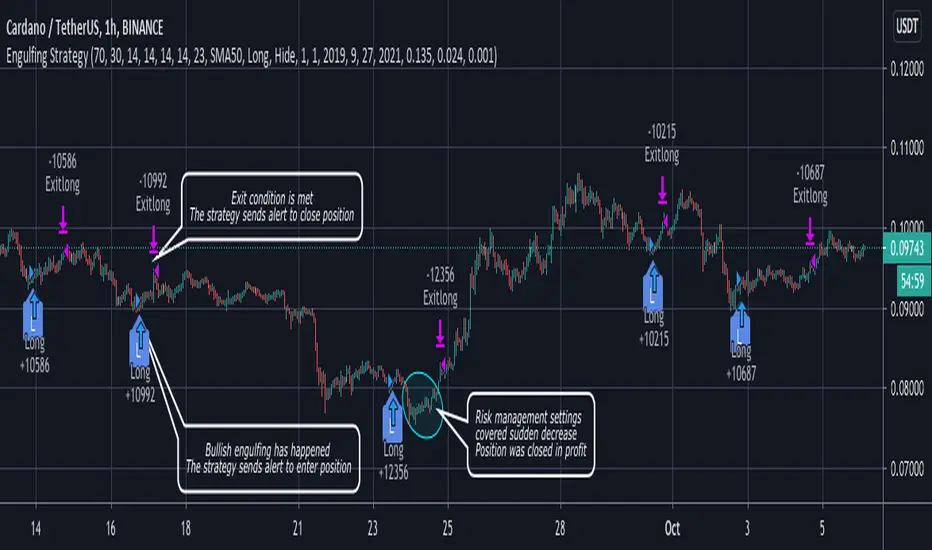
Engulfing strategy with DMI confirmationThe strategy contains Bearish and Bullish Engulfing trend reverse alerts with entry and closure notifications. Entries are enforced by Directional Movement Index (DMI) indicator levels combination. The strategy can be applied to spot, futures and marginal trading exchanges. It is suitable for both long and short positions and works accurately with BTC, USDT, ETH and BNB quote currencies. Best to use with 1H timeframe charts
Strategy elements can be configured at your own desire with user interface settings, no programming skills required:
1. Choose signals type: Long, Short or Both
2. Choose trend detection pattern rule:
SMA50 - provides a higher number of positions
SMA50 + SMA200 provides a higher accuracy
3. Change risk management settings to make the most accurate and efficient configuration. You can set up unique stop loss, take profit and trailing offset for different assets
4. Configure strategy periods
DMI and ADX lengths
ADX Smoothing
Key level
EMA and SMA lengths
5. Configure backtest dates
6. Show or hide RSI support and resistance bands
Engulfing strategy provides information for traders to enter the market in anticipation of a possible reversal in trend. Engulfing candles tend to signal a reversal of the current trend in the market. This specific pattern involves two candles with the latter candle "engulfing" the entire body of the candle before it. The engulfing candle can be bullish or bearish depending on where it forms in relation to the existing trend. The script calculates and compares values of the price action candles to define is there an engulfing and what type it is: bullish or bearish
If there is a bullish engulfing the indicator fills price action candle with yellow color
If there is a bearish engulfing the indicator fills price action candle with purple color
Advantages of the script:
1. The script detects presence of both types of engulfing: Bullish and Bearish
2. Weak engulfment signals and market noises are filtered by RSI bands and DMI confirmations. This allows to receive only strong and confirmed engulfment signals
3. This script has configurable risk management settings (order size, commission, take profit, stop loss and trailing). This provides you opportunity of direct broker connection and allows to conduct backtests before applying the strategy to real account. You also can set up strategy actions alerts
At the chart you can see the historical price action of ADAUSDT at Binance exchange from the January 1st 2019 till current date. The strategy is set up to receive only long signals because it is a spot market. Moments when the strategy triggered to enter a position are shown as L label while position entries are shown as "Long" messages. Moments when a certain position should be closed are shown as "Exitlong" messages
The strategy demonstrate high backtest results:
Mathematical expectation of risk management settings is positive = 1.34%
Percent profitable = 93.33%
Profit factor = 3.253
Quantity of entries = 75
Net profit = 15.22%
How to use?
Long signals:
1. Apply indicator to a trading pair your are interested in.
2. Click Settings button and select Alert Positions Type Long
3. Once bullish engulfing and confirmation conditions are met price action candle will be colored yellow and script strategy will enter a position.
4. Check Strategy Tester to set up optimal Risk management settings: stop loss, trailing profit activation point, trailing offset
5. Set up the strategy alert to be notified when a position should be opened or closed
Short signals:
1. Apply indicator to a trading pair your are interested in.
2. Click Settings button and select Alert Positions Type Short
3. Once bearish engulfing and confirmation conditions are met price action candle will be colored purple and script strategy will enter a position.
4. Check Strategy Tester to set up optimal Risk management settings: stop loss, trailing profit activation point, trailing offset
5. Set up the strategy alert to be notified when a position should be opened or closed
Best regards,
SkyRock Signals team
If you want to receive access to the strategy please contact us in personal message!
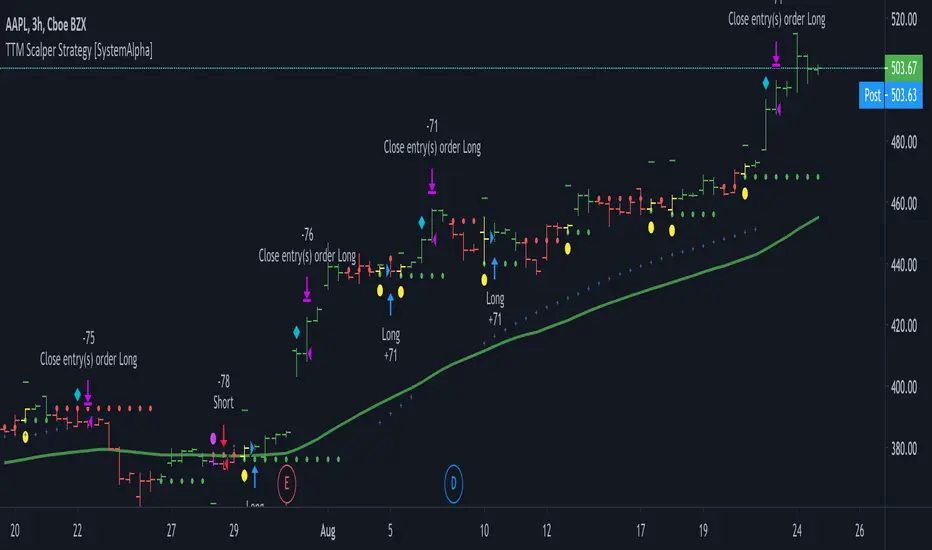
TTM Scalper Strategy [SystemAlpha]This is a strategy based on TTM scalper indicator. Instead of using just the normal buy and sell signal, we added an option to use trend filters, trailing stop loss and take profit targets.
The TTM scalper indicator of John Carter’s Scalper Buys and Sells was originally created by HPotter and is as a close approximation of the one described in his book Mastering the Trade.
In this study you have a choice of:
Trend Filters:
- Average Directional Index ( ADX ) – buy when price is trend is up and sell when trend is down.
- Moving Average (MA) – buy when price close above the defined moving average and sell when price close below moving average
- Parabolic SAR – buy when SAR is above price is above price and sell when SAR is below price.
- All - Use ADX , MA and SAR as filters
For MA Filter , you can use the “TF MA Type” and "TF MA Period" parameter to select Simple or Exponential Moving Average and length.
Stop Loss:
- Average True Range (ATR) – ATR % stop as trailing stop loss.
- Parabolic SAR ( SAR ) – Parabolic SAR adapted as trailing stop loss.
For ATR , you can use the “ATR Trailing Stop Multiplier” parameter to set an initial offset for trailing stop loss.
Take Profit Target:
- Average True Range (ATR) – ATR % stop as trailing stop loss.
- Standard % – Percent as target profit
For ATR , you can use the “ATR Take Profit Multiplier” parameter to set an initial offset for trailing stop loss.
Additional feature include:
- Show Bar Colors
STRATEGY ONLY:
- Set back test date range
- Set trade direction - Long, Short or Both
- Use timed exit - Select method and bars
- Method 1: Exit after specified number of bars.
- Method 2: Exit after specified number of bars, ONLY if position is currently profitable.
- Method 3: Exit after specified number of bars, ONLY if position is currently losing.
TradingView Links:
Alerts:
How to use:
1. Apply the script by browsing through Indicators --> Invite-Only scripts and select the indicator
2. Once loaded, click the gear (settings) button to select/adjust the parameters based on your preference.
3. Wait for the next BUY or SELL signal to enter the trade!
Disclaimer:
The indicator and signals generated do not constitute investment advice; are provided solely for informational purposes and therefore is not an offer to buy or sell a security; are not warranted to be correct, complete or accurate; and are subject to change without notice.
MACD++ Strategy [SystemAlpha]This is a strategy based on MACD Oscillator. Instead of using just the normal crossovers, we use trend filters, trailing stop loss and take profit targets. This strategy was developed for crypto, forex and stocks on daily timeframe but feel free to experiment on 15 minutes or higher using heikin ashi or normal candles
In this strategy you have a choice of:
Trend Filters:
- Average Directional Index ( ADX ) – buy when price is trend is up and sell when trend is down.
- Moving Average (MA) – buy when price close above the defined moving average and sell when price close below moving average
- Parabolic SAR – buy when SAR is above price is above price and sell when SAR is below price.
- All - Use ADX , MA and SAR as filters
For MA Filter , you can use the “TF MA Type” and "TF MA Period" parameter to select Simple or Exponential Moving Average and length.
Stop Loss:
- Average True Range (ATR) – ATR % stop as trailing stop loss.
- Parabolic SAR ( SAR ) – Parabolic SAR adapted as trailing stop loss.
For ATR , you can use the “ATR Trailing Stop Multiplier” parameter to set an initial offset for trailing stop loss.
Take Profit Target:
- Average True Range (ATR) – ATR % stop as trailing stop loss.
- Standard % – Percent as target profit
For ATR , you can use the “ATR Take Profit Multiplier” parameter to set an initial offset for trailing stop loss.
Additional feature include:
- Regular and Hidden Divergence display and alerts
STRATEGY ONLY:
- Set back test date range
- Set trade direction - Long, Short or Both
- Use timed exit - Select method and bars
- Method 1: Exit after specified number of bars.
- Method 2: Exit after specified number of bars, ONLY if position is currently profitable.
- Method 3: Exit after specified number of bars, ONLY if position is currently losing.
TradingView Links:
Alerts:
MACD:
How to use:
1. Apply the script by browsing through Indicators --> Invite-Only scripts and select the indicator
2. Once loaded, click the gear (settings) button to select/adjust the parameters based on your preference.
3. Wait for the next BUY or SELL signal to enter the trade!
Disclaimer:
The indicator and signals generated do not constitute investment advice; are provided solely for informational purposes and therefore is not an offer to buy or sell a security; are not warranted to be correct, complete or accurate; and are subject to change without notice.

MACD+ Strategy [SystemAlpha]This is a strategy based on MACD Oscillator . Instead of using just the normal crossovers, we use trend filters, trailing stop loss and take profit targets. This strategy was developed for crypto, forex and stocks on daily timeframe but feel free to experiment on 15 minutes or higher using heikin ashi or normal candles
In this strategy you have a choice of:
Trend Filters:
- Average Directional Index ( ADX ) – buy when price is trend is up and sell when trend is down.
- Moving Average (MA) – buy when price close above the defined moving average and sell when price close below moving average
- Parabolic SAR – buy when SAR is above price is above price and sell when SAR is below price.
- All - Use ADX , MA and SAR as filters
For MA Filter , you can use the “TF MA Type” and "TF MA Period" parameter to select Simple or Exponential Moving Average and length.
Stop Loss:
- Average True Range (ATR) – ATR % stop as trailing stop loss.
- Parabolic SAR ( SAR ) – Parabolic SAR adapted as trailing stop loss.
For ATR , you can use the “ATR Trailing Stop Multiplier” parameter to set an initial offset for trailing stop loss.
Take Profit Target:
- Average True Range (ATR) – ATR % stop as trailing stop loss.
- Standard % – Percent as target profit
For ATR , you can use the “ATR Take Profit Multiplier” parameter to set an initial offset for trailing stop loss.
Additional feature include:
- Regular and Hidden Divergence display and alerts
STRATEGY ONLY:
- Set back test date range
- Set trade direction - Long, Short or Both
- Use timed exit - Select method and bars
- Method 1: Exit after specified number of bars.
- Method 2: Exit after specified number of bars, ONLY if position is currently profitable.
- Method 3: Exit after specified number of bars, ONLY if position is currently losing.
TradingView Links:
Alerts:
MACD:
How to use:
1. Apply the script by browsing through Indicators --> Invite-Only scripts and select the indicator
2. Once loaded, click the gear (settings) button to select/adjust the parameters based on your preference.
3. Wait for the next BUY or SELL signal to enter the trade!
Disclaimer:
The indicator and signals generated do not constitute investment advice; are provided solely for informational purposes and therefore is not an offer to buy or sell a security; are not warranted to be correct, complete or accurate; and are subject to change without notice.

WaveTrend+ Strategy [SystemAlpha]This is a WaveTrend strategy based on WaveTrend Oscillator. In addition to using the normal crossovers, we use trend filters, trailing stop loss and take profit targets. WT+ Strategy was developed for crypto, forex and stocks for 15 minutes to daily timeframe. The main goal was to catch long term trends and ride them.
In this strategy you have a choice of:
Trend Filters:
- Average Directional Index (ADX) – buy when price is trend is up and sell when trend is down.
- Moving Average (MA) – buy when price close above the defined moving average and sell when price close below moving average
- Parabolic SAR – buy when SAR is above price is above price and sell when SAR is below price.
- All - Use ADX, MA and SAR as filters
For MA Filter , you can use the “TF MA Type” and "TF MA Period" parameter to select Simple or Exponential Moving Average and length.
Stop Loss:
- Average True Range (ATR) – ATR % stop as trailing stop loss.
- Parabolic SAR (SAR) – Parabolic SAR adapted as trailing stop loss.
For ATR , you can use the “ATR Trailing Stop Multiplier” parameter to set an initial offset for trailing stop loss.
Take Profit Target:
- Average True Range (ATR) – ATR % stop as trailing stop loss.
- Standard % – Percent as target profit
For ATR , you can use the “ATR Take Profit Multiplier” parameter to set an initial offset for trailing stop loss.
Additional feature include:
- Regular and Hidden Divergence display and alerts
- Filter Overbought and Oversold
- Use WT Cross for Exit
STRATEGY ONLY:
- Set backtest dates
- Set Trade direction - Long, Short or Both
- Use timed exit - Select method and bars
- Method 1: Exit after specified number of bars.
- Method 2: Exit after specified number of bars, ONLY if position is currently profitable.
- Method 3: Exit after specified number of bars, ONLY if position is currently losing.
TradingView Links:
WT+ Oscillator Companion:
WT+ Alerts:
How to use:
1. Apply the script by browsing through Indicators --> Invite-Only scripts and select the indicator
2. Once loaded, click the gear (settings) button to select/adjust the parameters based on your preference.
3. Wait for the next BUY or SELL signal to enter the trade!
Disclaimer:
The indicator and signals generated do not constitute investment advice; are provided solely for informational purposes and therefore is not an offer to buy or sell a security; are not warranted to be correct, complete or accurate; and are subject to change without notice.

Crypto Trend Following StrategyThis is the strategy script indicator of Crypto Trend Following Strategy which can be used for back testing. With study script indicator, strategy can be easily automated.
To set alerts, see Crypto Trend Following Study indicator.
Script is using several moving averages to keep you on the right side of the trend. Signals are also filtered based on other indicators to prevent buying already overbought or selling already oversold coins and avoid ranging markets.
MAIN GOAL
Main goal of the strategy is long-term stable profit. No strategy has 100% accuracy therefore there always will be some false signals. But patience pays, with Trend Following Strategy, you will get couple of small loses while waiting to get big wins when coin is trending strongly. As you never know the right time you must sustain and be in all trades to make sure that you will not miss the big move.
BACKTEST
This script is for free to play with so you can back test and see for yourself how the strategy performs on any of your favourite coins.
Strategy is optimized and back tested for USDT and BTC pairs on 6h timeframe but it can be used on any pair and any timeframe.
RISK & REWARD
Strategy does not use safety orders as DCAs usually leads to bag holding sooner or later. It does not use take profit either as strategy will tell you when to buy and when to sell based on the actual market condition.
You should always use stop loss to protect your account from drawdown or even being liquidated.
You can change stop loss or take profit as you like or even back test the strategy with your preferred settings to find what suits you best.
STRATEGY SETTINGS
You can use the strategy script for fine tuning and find best settings for yourself.
If you need any help with settings do not hesitate to ask. I would also appreciate any feedback and ideas how to improve the script.
==== Indicators settings ====
RSI Long < and StochRSI Long <
• used to filter out buy signals of already overbought coins - ( stoch ) RSI must be under set value to fire a BUY signal
RSI Short > and StochRSI Short >
• used to filter out sell signals of already oversold coins - ( stoch ) RSI must be over set value to fire a SELL signal
ADX >
• used to filter out buy or sell signals in ranging markets - ADX must be over set value to fire a BUY or SELL signal
MA Fast and Slow Length
• Two moving averages to indicate an actual short-term trend
Baseline Length & Type
• Baseline is a moving average which confirms the longer-term trend. You can set length and type of the moving average
==== Test period settings ====
• You can set the back tested window
==== Strategy settings =====
• Target Take profit and Stop loss in %
• Only LONG trades – tick if you do not want to calculate SHORT trades in the back test
• Plot key levels on chart – if you use stop loss and/or take profit, you can turn on levels of price to reach (yellow – bought price, red – stop loss – green - take profit)
Back test calculates with commission and fixed order size. You can change these settings on Properties Tab

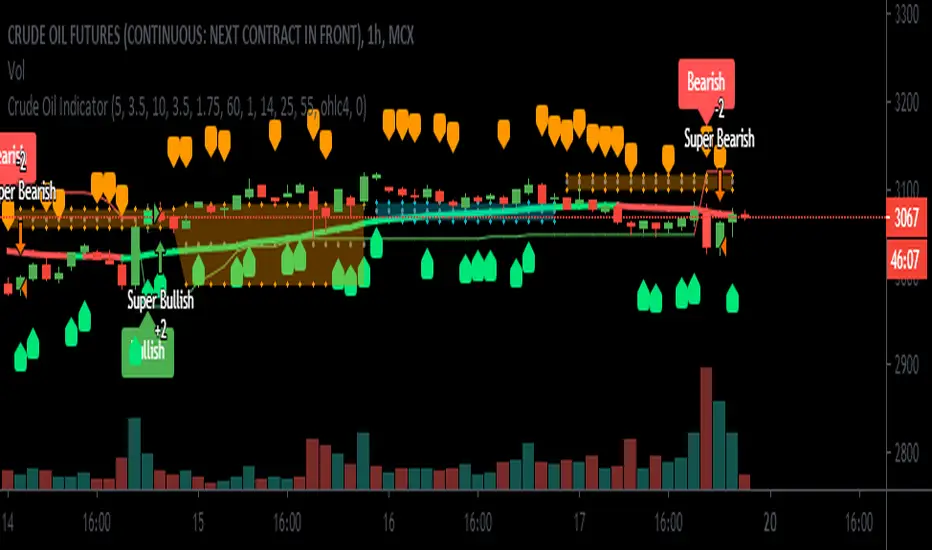
Crude Oil Indicator [SIDD]Crude Oil Indicator is giving two signal Bullish and Bearish . Bullish signal is used to take long trade and Bearish signal is used to close existing long trade and take new short trade and so on.
To get More signal of Bullish and Bearish user must enable More Signals check box that will check crossover and cross down of price close with Gaps.
I am using 2 ATR and one ADX and Gaps and VWMA to make signal profitable with 15 minutes 1 hr ,2hr,3hr,4hr chart time frame.
I have checked last few years data for back testing. Based on past performance it doesn't work well in 30 minute and 1 day chart time frame as results are not good in back testing. I have designed this indicator for Indian crude oil context though it can be used with other market as well.
1st ATR used to find trend with price crossover.
2nd ATR ADX is used to find the trend change details only. I have taken VWMA and ATR both to consider trend change.
Highlight Gap Up and Gap Down is used to know daily market opening gap up and gap down area. Gaps act as support and resistance .
VWMA Plotted as Blue line. Rising VWMA considered as uptrend and falling VWMA considered as downtrend.
Flat VWMA considered as no trend zone. In no trend zone every second third candles cross VWMA .
User must keep the default setting for getting better results as results are back tested. If setting changed then result may vary.
I have added here back tested performance user can see those results. I have added commission and slippage as well. Past year performance not guarantee for future years result so before taking any trade trader must take conscious decision.
This indicator is available on Subscription.
PM/ DM for more information about the script access.
Use the link below to obtain access to this indicator.
GoldMode On (Triple compromise strategy) TF 60-240BINANCE:BTCUSDT
Greetings.
I am publishing this script in order to get feedback for further work on it.
The script combines a compromise between several classic strategies, and each of them uses modifications of classic indicators on specially selected averaging sliding indicators.
1. The script uses an ATR-based filter (it's off by default, as it's better on BTCUSD , but you can enable it in the settings if you want to use it on EURUSD , for example, or on other symbols).
2. A strategy based on crossing the moving.
3. A strategy based on determining the direction of movement of the modified slow and fast RSI .
4. A strategy based on the modified ADX +DI -DI .
The essence of the strategy in finding a compromise decision on the signals coming from each of these three strategies.
=====
Приветствую.
Данный скрипт публикую с целью получить обратную связь для дальнейшей работы над ним.
Скрипт сочетает в себе компромисс между несколькими классическими стратегиями, причём каждая из них использует модификации классических индикаторов на специальным образом подобранные усредняющие скользящие.
1. В скрипте используется фильтр на основе ATR (по умолчанию выключен, т.к. на BTCUSD так лучше, но можно включить в настройках, если хотите использовать его на EURUSD , например, или на других инструментах).
2. Стратегия основанная на пересечении скользящих.
3. Стратегия основанная на определении направления движения модифицированных медленной и быстрой RSI .
4. Стратегия основанная на модифицированном ADX +DI -DI .
Суть стратегии в поиске компромиссного принятия решения по сигналам поступающим от каждой из этих трёх стратегий.
ARKADIY V1.0This strategy is made for trading Bitcoin (BTC) using data from BITMEX exchange on 4 hour timeframe.
There is also a special indicator for the strategy to receive alerts on your tradingview platform which is very handful to enter the market as soon as there is a buy/sell signal.
Strategy is based on Pine script v.4 and it uses several indicators and oscillators (modified RSI, CCI, ADX, TRIX and EMA) to generate a buy/sell signal for BTC.
There is no repaint, which means that a signal will not disappear when price goes in wrong direction.
And this is one of the advantages of the strategy over other 90% strategies.
The strategy is a SWING strategy, which means that a signal for opening a position (buy or sell) at the same time closes previous position.
Because of its specificity the strategy doesn’t have take profit/stop loss options and doesn’t use leverage.
The strategy has a backtest statistics on TradingView. 2018 – 1197%, 2019 – 79%, until March 13, 2020 – 88% of net profit.
Max drawdown (the sum of non-profitable trades until receiving a profitable trade) during a year not more than 14%.
To get access to the strategy write in comments and in private messages.
_____________________________________________________________________________________________________________
Данная стратегия работает на инструменте биткоин ( BTC ) по котировкам биржи BITMEX на 4 часовом таймфрейме, а также имеет удобные алерты для сигналов на сделку (будильник).
Это позволит Вам заниматься своими делами, не следя за тем, что происходит на рынке, но в нужное время совершить сделку, получив предупреждение на телефон / компьютер.
Стратегия построена на последней версии Pine Script, в ее основе лежит совокупность множества индикаторов и правил (модифицированные RSI, CCI, ADX, TRIX and EMA), которые в определенный момент дают сигнал на покупку или продажу BTC . Стратегия протестирована с использованием аргумента "Recalculate After Order is Filled" и подразумевает "non-repaint" базис. Другими словами, если стратегия показала вход в сделку (по итогу закрытия свечи) - то сигнал так и остается без изменений. Это выгодно отличает данную стратегию от 90% таковых в Trading View и дает уверенность, что появившийся сигнал не исчезнет в случае, если рынок пойдет в противоположную сторону.
Данная стратегия относится к сегменту SWING стратегий, когда один сигнал является одновременно закрытием одной сделки и открытием противоположной.
В связи со спецификой стратегии она не использует стоп-ордера, поэтому предполагает торговлю без плечей.
Ваш риск ограничен временным интервалом от момента, как цена пошла в противоположную сторону, до момента пока стратегия не дала сигнал на перекладку в новую сделку.
Статистика, подтвержденная бэктестом в Trading View, за последние пару лет: 2018 - 197%, 2019 - 79%, на 13.03.20 - 88%. Это данные по Чистой прибыли на вложенный капитал.
Максимальная длящаяся просадка (совокупность минусовых сделок до момента возникновения плюсовой сделки) в течение года составляет не более 18%
Основные отличия от индикаторов наших коллег:
+ Результаты бэктеста не в excell, а в платформе Trading View – прозрачная статистика по сделкам
+ Построен на принципах non-repaint basis – сигналы не исчезают и не появляются из неоткуда
+ Работает на 4Н таймфрейме. Это значит сделки не могут быть чаще, чем в раз в 4 часа. Занимайтесь своими делами, пока стратегия стоит на страже рыночного анализа. Она сама Вам сообщит, когда нужно открыть / закрыть сделку.
+ Разберется любой! Стратегия построена по принципу one-click setup
+ Поддержка с возможностью организации телефонного звонка.
Для предоставления доступа к данной стратегии - пожалуйста пишите в комментариях запрос с копией в личные сообщения. Мы быстро с Вами свяжемся.

DAX Shooter 5M StrategyThis is a simple strategy that applies very well for scaling indices to 5 minutes especially for the DAX. The algorithm provides for buying or selling when the market is very "pulled". The rules are as follows:
you buy when:
1- The ADX indicator with the standard settings is greater than 32.
2- the RSI indicator set to 7 periods is crossing upwards the oversold line at 30
3- the candle minimum is lower than the lower band of bollinger bands set to 50 periods.
is sold when:
1- ADX indicator with standard settings is greater than 32.
2 - the RSI indicator set to 7 periods is crossing downwards the overbought line at 70
3- the maximum of the candle is higher than the upper band of the bollinger bands set to 50 periods.
Money management is at the discretion of the trader but usually it is better to set a fixed stop loss and a take profit on reaching the opposite bollinger band.
Enjoy trading at all!

modified Stochastic strategy< Overview >
This indicator and strategy is a technical indicator used to analyze and predict changes in stock trends and price patterns in a traded asset.
< Pros and Cons >
It helps determine the trend direction/strength and optimal entry points.
This indicator may be a little easier to work with.
Just as any other trend-following indicator, this strategy might provide a lot of false signals during the flat market.
For optimal results, this indicator can be accompanied with other indicators, namely Average Directional Index (ADX) and Average True Range (ATR) and Moving Average(MA). The ADX is ahead of the curve and can hint into an upcoming trend reversal. The ATR is capable of determining the volatility of the market, which is especially useful since the ATR indicator doesn’t work on the flat market.
It is a lagging indicator. It helps you by showing the longer term trend but may keep you from faster paced swing trades. In my personal opinion, this strategy is optimal to 12H time frames.
★ Remember that no indicator is capable of providing 100% accurate signals. Follow basic risk management and capital allocation rules.

Trend Core Strategy v1.0 - GUMROADLog Regression Channel Pro Strategy
This is a trend-following pullback strategy built for TradingView (Pine Script v6).
It uses logarithmic regression channels to define the market’s primary trend, and looks for low-risk pullback entries within strong trending conditions.
Momentum and trend strength filters are applied to avoid ranging or weak markets.
This strategy is designed to be used when the market is clearly trending, not during choppy or sideways price action.
Best Used When
Strong uptrend or downtrend is present
Price is pulling back toward the regression channel
Volatility is sufficient (ADX confirms trend strength)
Suitable for 1H / 4H timeframes
Commonly used on BTC, ETH, and major crypto pairs
Key Characteristics
Non-repainting logic
Volatility-based risk management (ATR)
Designed for realistic backtesting
No martingale, no grid, no over-optimization
Gumroad Disclaimer (3 Lines)
This strategy is provided for educational purposes only and is not financial advice.
Trading involves risk, and losses may occur.
You are fully responsible for your own trading decisions.

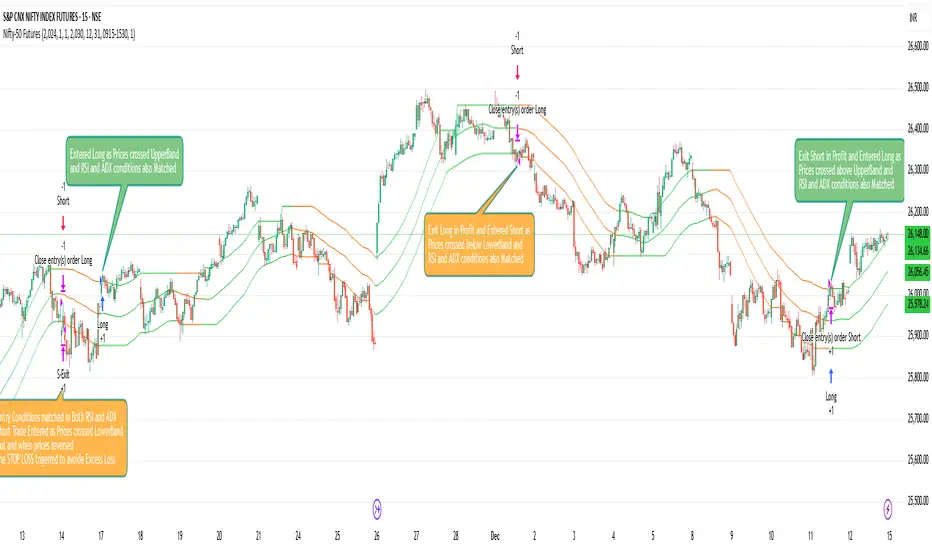
Nifty-50 Futures Trading Ideas/ Strategyb]Nifty-50 Futures Trading Ideas is a trend-following strategy designed for study and backtesting .
The strategy identifies directional bias using a structured price-based approach and applies ADX + DI and RSI filters to validate trend strength.
It includes inbuilt risk-management logic such as Stop-Loss, Take-Profit, ATR-based exits, separate maximum loss per trade (₹) for long and short positions, and optional date/session filters.
This script is provided for educational and analytical purposes only and is not a trading signal or investment recommendation.
ETH UU Reversion Strategy Strategy Overview
The "ETH UU Reversion Strategy" is a sophisticated mean-reversion trading system designed to capture price reversals at standard deviation extremes. Unlike typical strategies that enter trades immediately at market price, this script employs a proprietary **Limit Order Execution Mechanism** combined with volatility filtering to optimize entry prices and reduce slippage.
Originality & Key Features
This script addresses the common pitfalls of standard Bollinger Band strategies by introducing advanced order management logic:
1. Limit Order Execution:** Instead of market orders, the strategy calculates an optimal entry price based on ATR offsets. This allows traders to capitalize on "wicks" and secure better risk-reward ratios.
2. Smart Timeout Logic:To prevent "catching a falling knife," pending orders are automatically cancelled if not filled within a customizable number of bars (default: 15). This ensures orders do not remain active when market structure shifts.
3. Dynamic Risk Recalculation:** Stop Loss (SL) and Take Profit (TP) levels are recalculated at the exact moment of execution using the real-time ATR, ensuring risk parameters adapt to current market volatility.
How to Use
1. Setup: Apply the strategy to ETH/USDT (or other crypto pairs) on 15m or 1h timeframes.
2. Configuration:
* Adjust `BB Length` and `RSI Length` to fit your timeframe.
* Set `Order Timeout` to define how long a pending order should remain active.
* Toggle `Use ADX Filter` to avoid trading against strong trends.
3. *Visuals: The chart displays distinct labels for pending orders (Gray), active entries (Blue/Red), and cancellations, providing full transparency of the strategy's logic.
Risk Disclaimer
This script is for educational and quantitative analysis purposes only. Past performance regarding backtesting or live trading does not guarantee future results. Cryptocurrency trading involves high risk and high volatility. Please use proper risk management and trade at your own discretion.
-------------------------------------------------------------
Chinese Translation (中文说明)
策略概述
“ETH UU 均值回归策略”是一个旨在捕捉标准差极端位置价格反转的交易系统。与立即以市价入场的典型策略不同,本策略采用独特的**挂单执行机制**结合波动率过滤,以优化入场价格并减少滑点。
原创性与核心功能
本脚本通过引入高级订单管理逻辑,解决了普通布林带策略的常见缺陷:
1. 挂单交易模式: 策略不使用市价单,而是根据 ATR 偏移计算最佳入场价(Limit Orders)。这允许交易者捕捉K线的“影线”,获得更好的盈亏比。
2. 智能超时撤单: 为了防止“接飞刀”,如果挂单在指定K线数内(默认15根)未成交,系统会自动撤单。这确保了当市场结构发生变化时,旧的挂单不会被错误触发。
3. 动态风控重算: 止损和止盈在成交的瞬间根据实时 ATR 重新计算,确保风控参数始终适应当前的市场波动率。
风险提示
本脚本仅供教育和量化分析使用。回测或实盘的过往表现并不预示未来结果。加密货币交易具有极高的风险和波动性,请务必做好仓位管理,并自行承担使用本策略的风险。

ETH UU Reversion Strategy [Limit]Strategy Overview
The "ETH UU Reversion Strategy" is a sophisticated mean-reversion trading system designed to capture price reversals at standard deviation extremes. Unlike typical strategies that enter trades immediately at market price, this script employs a proprietary **Limit Order Execution Mechanism** combined with volatility filtering to optimize entry prices and reduce slippage.
Originality & Key Features
This script addresses the common pitfalls of standard Bollinger Band strategies by introducing advanced order management logic:
1. Limit Order Execution:** Instead of market orders, the strategy calculates an optimal entry price based on ATR offsets. This allows traders to capitalize on "wicks" and secure better risk-reward ratios.
2. Smart Timeout Logic:To prevent "catching a falling knife," pending orders are automatically cancelled if not filled within a customizable number of bars (default: 15). This ensures orders do not remain active when market structure shifts.
3. Dynamic Risk Recalculation:** Stop Loss (SL) and Take Profit (TP) levels are recalculated at the exact moment of execution using the real-time ATR, ensuring risk parameters adapt to current market volatility.
How to Use
1. Setup: Apply the strategy to ETH/USDT (or other crypto pairs) on 15m or 1h timeframes.
2. Configuration:
* Adjust `BB Length` and `RSI Length` to fit your timeframe.
* Set `Order Timeout` to define how long a pending order should remain active.
* Toggle `Use ADX Filter` to avoid trading against strong trends.
3. *Visuals: The chart displays distinct labels for pending orders (Gray), active entries (Blue/Red), and cancellations, providing full transparency of the strategy's logic.
Risk Disclaimer
This script is for educational and quantitative analysis purposes only. Past performance regarding backtesting or live trading does not guarantee future results. Cryptocurrency trading involves high risk and high volatility. Please use proper risk management and trade at your own discretion.
-------------------------------------------------------------
Chinese Translation (中文说明)
策略概述
“ETH UU 均值回归策略”是一个旨在捕捉标准差极端位置价格反转的交易系统。与立即以市价入场的典型策略不同,本策略采用独特的**挂单执行机制**结合波动率过滤,以优化入场价格并减少滑点。
原创性与核心功能
本脚本通过引入高级订单管理逻辑,解决了普通布林带策略的常见缺陷:
1. 挂单交易模式: 策略不使用市价单,而是根据 ATR 偏移计算最佳入场价(Limit Orders)。这允许交易者捕捉K线的“影线”,获得更好的盈亏比。
2. 智能超时撤单: 为了防止“接飞刀”,如果挂单在指定K线数内(默认15根)未成交,系统会自动撤单。这确保了当市场结构发生变化时,旧的挂单不会被错误触发。
3. 动态风控重算: 止损和止盈在成交的瞬间根据实时 ATR 重新计算,确保风控参数始终适应当前的市场波动率。
风险提示
本脚本仅供教育和量化分析使用。回测或实盘的过往表现并不预示未来结果。加密货币交易具有极高的风险和波动性,请务必做好仓位管理,并自行承担使用本策略的风险。
