Average True Range NormalizedThis is a modified version of ATR. Instead of having volatility reading as unit price, we have percentage of the current price. Let say currently ATR is at 200 and the current close is 2000. Then this ATR will output 10.0 (10.0% volatility reading).
ค้นหาในสคริปต์สำหรับ "Volatility"

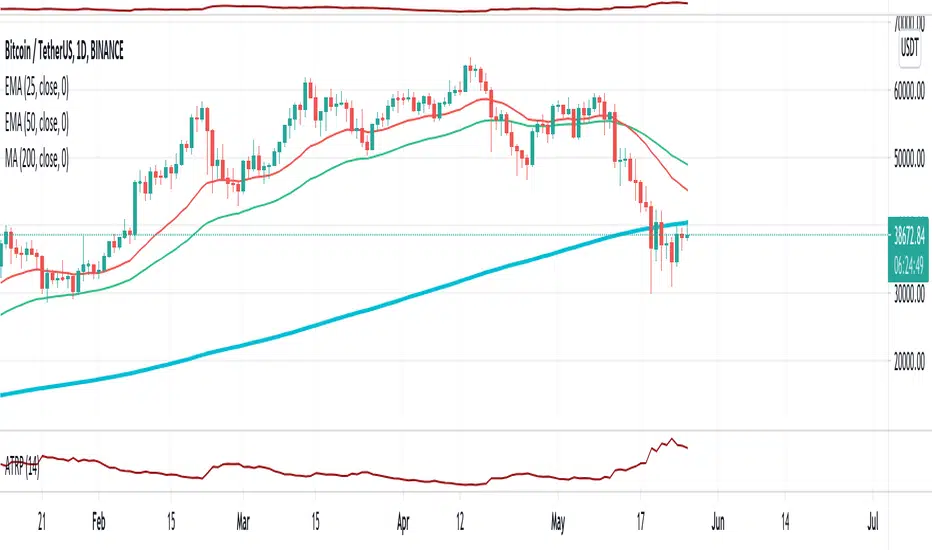
Average True Range Percentage (ATRP)What is ATRP?
Average True Range Percentage (ATRP) expresses the Average True Range (ATR) indicator as a percentage of a bar’s closing price.
How does this indicator work?
ATRP is used to measure volatility just as the Average True Range (ATR) indicator is. ATRP allows securities to be compared, where ATR does not.
ATR measures volatility at an absolute level, meaning lower priced stock will have lower ATR values than higher price stocks.
ATRP displays the indicator as a percentage, to allow for securities trading at different prices per share to be compared.
Reference: www.fidelity.com
Bvol24hPercentage of the Bitcoin volatility 24h index.
Higher volatility periods tend to create local tops/bottoms.
Enjoy :)

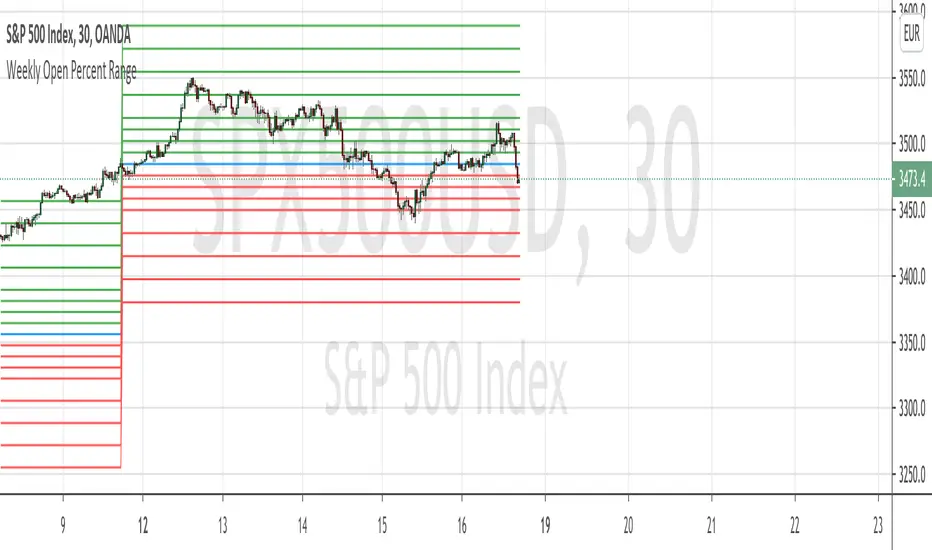
Weekly Open Percent RangeA simple take on finding percentage gain/drop range in a week for ranging or trending market instrument.
This script is hard coded to plot 0 to 3%, -3% range for the week base on instrument weekly open price.
Best to use with measured volatility indicator to gauge the movement of price. Anytime the price goes above the range level then it is likely to be trending. Highly volatile instruments will not find this indicator useful. It is best for heavy instruments like Forex or Indices where range % in a week in a non-volatile move is really quite small that these act as resistances and support.
Range Levels:
3%
2.5%
2%
1.5%
1%
0.75%
0.5%
0.25%
0%
-.25%
-.5%
-.75%
-1%
-1.5%
-2%
-2.5%
-3%
The next step for this indicator is to consider volatility range of instrument and to include this in the percentage zone levels instead of hard coding these.
Intraday (green), overnight (red), sum (blue) We know the volatility has some autocorrelation with yesterday's value.
So we could to guess the daily volatility for the next trading day.

Probability: Bull/Bear Dominance | Ratio | Bar CountIntro
What's the probability of the next bar being red? How about green? Well, there are many ways to quantify the probability but I am presenting just one stupidly simple (but generally accurate) way to measure it.
Strangely... no one has done this before that I can find. I try to check if someone else has done it first (Pro Tip: Plz do this. We honestly don't need the 5 trillionth "MTF MAs" script.)
Indicator
Its a basic counting script, but the nice thing about this script is you choose the time range. It starts counting from a specified point of your choosing. It counts up the bull bars and bear bars separately.
Bull Bar = Close > Open
Bear Bar = Open > Close
You can look at them in sum or as a ratio of Green Bars : Red Bars
I know, it's almost too simple. But, here's some interesting food for thought from a layman to fellow laymen.
Analysis/Edge
Between the time of candle open and candle close, the price can do one of three things, close higher, close lower, or close equal to.
'Equal to' is rare on higher timeframes in liquid markets and it provides no useful information. Thus, we'll nix it for purposes of this conversation.
So boil it down. The next candle is going to be a red candle or a green candle.
It is popular to refer to the general probability of most candles as 50/50, with trader's mission in life being to seek an edge that tilts the probabilities slightly in their favor.
The truth is the odds are probably never actually 50/50, but knowing the precisely correct probability is unknowable, just like the accuracy of a weather forecast is inherently unknowable. What we're trying to do as traders is develop systems that give us predictive probabilistic outcomes that correspond with future realities based on various ways of measuring the market (most often heavily dependent on the past).
The reality is that the market can be measured in many, many different ways. The important thing is that you measure it in a way that is accurate, relevant, and universally applicable.
So look at this indicator here:
You start from a point in time on a chosen timeframe and you put red bars in the red column, green in the green column, and count them all up.
Then you make a ratio, in this case, Green : Red.
What the ratio shows you is the percentage of green bars compared to red bars . At the time of this screenshot, the 4h on the SPX starting from the 2020 bottom is showing a ratio of 1.2.
This means there have been 20% more green bars than there have been red bars.
Now there are 1,000 directions you can take this discussion. What is the overall volatility picture, the size of the red bars vs the green bars, what happens if you miss out on the 5 biggest green bars... so many more variables that you would need to take into account to develop a true edge from this idea. But, the bottom line fact (which is what I like about this) is that we can take this data and say with a certain level of confidence that on the SPX you have a 20% better shot at making money (otherwise stated there's a 60/40 chance) if you open a LONG trade at the beginning of a 4h candle than if you open a short.
That's useful information. One could argue that it's not a complete strategy in and of itself (although I bet it could be with a couple of additional parameters). But I can tell you, based on the 4h candles in the 2020 rally if you open a short, the deck is stacked against you from this perspective. And we can actually somewhat demonstrate this to be true for our dataset because we can look at the price history and see who likely made more money. The SPX is up 1000pts off the bottom. So, thus far, for this dataset, it rings true; Bulls have been doing way better in the latter part of 2020 than the bears.
Conclusion
Predictive systems with a small number of variables tend to be more robust than a system with many variables when applied to a complex system. I may keep updating this script if people like it and determine aspects like population vs sample size, confidence intervals, volatility, and exclusion of outliers. For now, this is just an opening foray into the basic idea of how we can establish an edge in the markets. It really can be this simple.
Thanks for Reading.

Dancing Space IndicatorNaive Algo for Volatility Forecast: indicates the percentage of chances for the underlying to make a break through the current straddle price during time remaining from current bar close till the option expiry. Put it on the chart of an underlying, fill the inputs for current straddle price, how many bars of of chart time frame remains till expiry and what window size to use to make a forecast.
ATTENTION! Big numbers in "Bars till expiry" and "Window Size" inputs are a. Useless b. Makes TVW processing indicator very slow because of large number of iterations to perform.
ATTENTION 2! Algo is really naive and simple and based on historical data, but can be of use together with other volatility predicting signals.

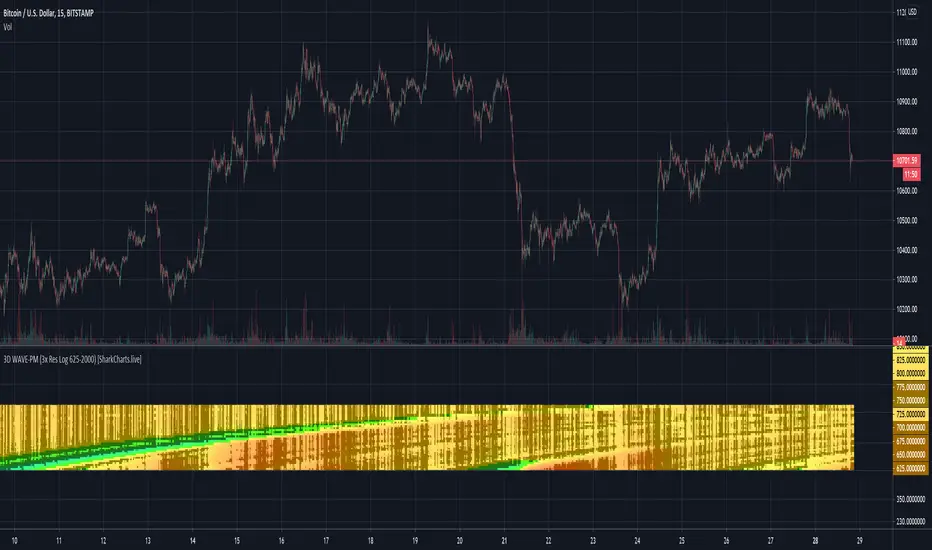
3D WAVE-PM (3x Res Log 625-2000) [acatwithcharts]This is an (il)logical extreme adaptation of my (il)logical extreme adaption of Mark Whistler's WAVE-PM script, originally published in his book Volatility Illuminated as a MetaTrader script.
In 3D WAVE-PM, I plotted 32 period lengths from 14 to 600 at height equal to their length, reading out colors based on their value. I chose those lengths to create a relatively continuous indicator on log scale.
What I really wanted to do though was to (1) have the option to view this indicator in either linear or log and (2) not lose as much data resolution across nearly 600 periods. Within the limitations of Pinescript, the best solution I could find was to make multiple indicators hard-coding the different period lengths to create linear and log ranges such that I could make a composite heatmap with several different indicators on the same pane.
...but then I went a step further on the log scale version, noticing that I could easily make a 4th indicator that covers the 625-2000 period region at similar resolution to the other 3. So I did. This is therefore the "4th of 3 indicators" for log scale 3x resolution WAVE-PM.
It adds significant lag on top of what was already caused by 3x WAVE-PM, but I have found it broadly useful enough when looking at large expansions that I'm going to go ahead and launch it. I strongly recommend doing any other analysis in a separate tab from the one in which you have high-res 3D indicators open.
I'm excited to announce that we're putting the finishing touches on a subscription service for the volatility theory indicators, and assuming no hiccups will launch them within days. Subscriptions will be available in several packages through SharkCharts.live
Current pricing and subscription details will be kept up-to-date on SharkCharts.live
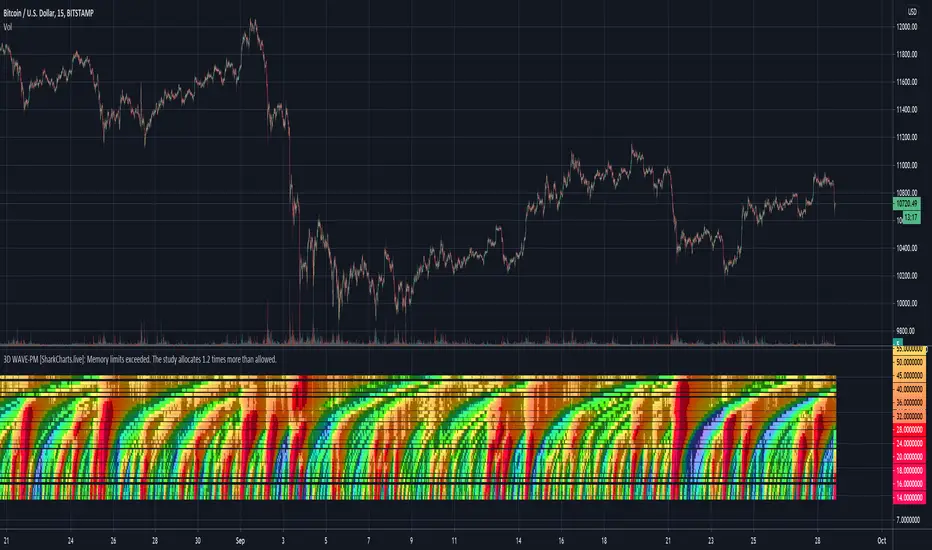
3D WAVE-PM Meow Mix [acatwithwithcharts]This is an (il)logical extreme adaptation of Mark Whistler's WAVE-PM script, originally published in his book Volatility Illuminated as a MetaTrader script. Instead of displaying WAVE-PM as several oscillator lines oscillating within a range, it plots 32 different period lengths at height equal to their length and reads out colors based on their value. The period lengths are spaced out such that it makes a relatively continuous heatmap when displayed on log scale. It has the same customization options as my regular WAVE-PM Meow Mix script.
(It may be necessary to move the scale around to see the indicator - it ranges from 14 to 600 and the scale on the chart seems to default to a range below it.)
It's experimental, it's a proof of concept for heatmap versions of indicators, it has a tendency to freeze up, and it gives a great deal of information in one snapshot (mcuh of which I'm still working out how best to use). It is particularly good at presenting a bird's eye view of the significance of a given movement relative to how much of an impact it has on higher period volatility expansions.
I'm publishing this as Invite-Only with a few specific people already in mind to help experiment with the concept, and do not have immediate plans for opening broad access to it.
Macro Pulse Engine (Fixed Feeds)The Macro Engine aggregates key macro signals (DXY, 10Y yields, VIX, market breadth, and major indices) into a single risk-on vs risk-off read.
Green / positive readings favor risk-taking and dip-buying
Red / negative readings signal caution, volatility expansion, and defensive positioning
The score updates off confirmed daily closes, not noisy intraday data
It doesn’t predict direction — it confirms whether risk is being rewarded or punished.

@Unwind Pressure Detector - AUDITED v3.0SQUEEZE → UNWIND PRESSURE DETECTOR v3.0
The first indicator that not only finds oversold squeezes… but tells you exactly when the move is exhausting and it’s time to take profits.
Fully audited, clean Pine Script v6, zero repainting, zero lag tricks.
WHAT IT DOES
• Detects high-probability squeeze setups (RSI + Volume + VIX + Trend confluence)
• Scores pressure from 0–115 with dynamic sensitivity (Low to Extreme)
• Identifies CRITICAL zones where explosive moves are most likely
• Most importantly → flags the UNWIND when trapped shorts are finally covering and the rally is running out of fuel (perfect profit-taking signal)
FEATURES
• Real-time pressure dashboard (top-right)
• Color-coded background zones (Critical = red, High = orange)
• Smart anti-spam labels with ATR offset
• Three alert conditions:
→ Squeeze Setup
→ Critical Squeeze
→ Unwind / Take Profit
• Works on all markets & timeframes (stocks, forex, crypto, futures)
WHY THIS VERSION IS DIFFERENT
- v3.0 completely rewrote the unwind logic (now requires rally + sharp pressure drop)
- No false unwinds during strong trends
- Built for real trading, not just pretty screenshots
100% Open Source • Fully commented • Free to modify & rep, I want this in the public library forever.
Created with love for the TradingView community
Drop a ♥ and follow if you find it useful!
#squeeze #ttmsqueeze #unwind #volatility #vix #takeprofits #smartmoney

Compression Breakout [30min 65+33 EMA]Compression Breakout
by GhostMMXM (inspired by Chris Cady & Steidlmayer Market Profile principles)
This indicator automates the exact compression-to-displacement setup that veteran CBOT floor trader and Market Profile pioneer Chris Cady describes in interviews and his work with Peter Steidlmayer.
Core idea
Chris Cady uses two simple moving averages on the 30-minute chart — a 33-period and a 65-period — to visually detect when the market falls into “balance” (compression). When both lines go almost perfectly flat for several bars, the market is in a low-volatility, high-consensus state — the calm before a violent vertical breakout.
What this script does
• Detects when both the 33 EMA and 65 EMA are virtually flat (user-adjustable sensitivity)
• Requires a minimum of 6 consecutive flat bars (adjustable) before declaring compression
• Draws a light-grey background + live-updating box showing the detecting compression
• Triggers only on the first strong displacing bar that:
– closes entirely above the compression high OR entirely below the compression low
– has a range ≥ 1.5× the average bar range inside the compression zone (adjustable)
• Plots a clear “LONG Cady Break” or “SHORT Cady Break” label on the breakout bar
• Fires a clean alert instantly usable on entire watchlists:
BTC → Compression LONG breakout!
ES1! → Compression SHORT breakout!
Designed for 30-minute charts (BTC, ETH, SOL, NQ, CL, GC, etc.) but works on any timeframe.
Perfect for traders who want to catch the highest-conviction vertical moves that Chris Cady has traded for decades with only a few contracts scaled in aggressively on the break.
Settings
• Minimum flat bars for compression (default 6)
• Max % slope to be considered flat (default 0.08 %)
• Minimum range multiplier vs compression average (default 1.5×)
Enjoy the cleanest, most mechanical version of Chris Cady’s famous compression breakout strategy available on TradingView.
Happy trading!

VIX Fix Indicator (Hestla 2015)This script provides a streamlined version of the VIX Fix, referencing the foundational work of Larry Williams and the strategies of Amber Hestla. It serves as a synthetic volatility gauge for assets that lack a dedicated VIX index. The math works by measuring the percentage drop from the highest recent close to the current low, essentially quantifying fear in the market without needing options data.
This specific script is designed to be purely visual. I have removed all the buy and sell labels found in other versions to leave a clean pane that plots only the oscillator and its moving average. You can use this to identify potential market bottoms when the black line spikes significantly, signaling that selling pressure is reaching a mathematical extreme relative to the recent trend.

VIX Spike/Drop TrackerWhat It Does
Core Functionality:
Monitors daily VIX percentage changes and identifies significant spikes (fear increases) and drops (fear decreases)
Backtests historical SPY performance following VIX events across multiple timeframes (1-day, 2-day, 3-day, and 1-week)
Calculates win rates and average returns for each scenario
Provides real-time VIX statistics including percentile rankings, distance from moving average, and momentum
Key Features:
Historical Analysis: Analyzes up to 2,500 bars of historical data to build robust statistical profiles
Dual Event Tracking: Separate statistics for VIX spikes (fear events) and VIX drops (fear subsiding)
Performance Metrics: Shows average SPY returns and win rates at 1, 2, 3, and 5-day intervals
VIX Context: Real-time VIX level, daily change, moving average distance, percentile rank, and 3-day momentum
Smart Predictions: Context-aware signals based on VIX patterns and consecutive spike/drop days
Visual Alerts: Chart annotations and background highlighting for significant events
How to Use It
Setup:
Add the indicator to your chart (works on any timeframe, but analyzes daily data)
Adjust the VIX threshold (default 10%) to define what constitutes a "significant" move
Set the historical lookback period (500 bars = ~2 years of data)
Reading the Statistics Table:
Left side: Statistics for VIX spikes (when fear increases)
Right side: Statistics for VIX drops (when fear decreases)
D1/D2/D3/Wk columns: Average SPY returns 1, 2, 3, and 5 days after the VIX event
Win %: Percentage of time SPY was positive at each interval
n: Sample size (number of historical events analyzed)
Bottom row: Current VIX statistics and market positioning
Interpreting Predictions:
🔴 "FEAR SPIKE - SPY LIKELY DOWN": VIX spiking, historical data shows negative SPY tendency
🟢 "FEAR SUBSIDING - SPY LIKELY UP": VIX dropping, historical data shows positive SPY tendency
🟠 "VIX ELEVATED - MEAN REVERSION DUE": VIX extended above its moving average
🟡 "VIX SUPPRESSED - COMPLACENCY RISK": VIX unusually low, potential volatility expansion ahead
Best Practices
Use this as a statistical context tool, not a standalone trading signal
Combine with your own technical analysis and risk management
Pay attention to win rates alongside average returns for edge assessment
Monitor consecutive spike/drop days for potential mean reversion setups
Higher sample sizes (n) provide more reliable statistics
Customization
Fully customizable colors, threshold levels, table size, and VIX moving average period. Enable/disable chart labels based on your preference for clean charts.
This indicator provides historical statistical context and does not guarantee future performance. Past results do not predict future outcomes.

Accurate ATR Stop Loss Distance — Risk Management ToolAccurate ATR Stop Loss Distance — Risk Management Tool
This indicator calculates an accurate Stop Loss distance in pips using the Average True Range (ATR) multiplied by a user-defined multiplier.
It automatically detects the correct pip size based on the instrument type (Forex, Crypto, Stocks, Indices, Futures), adjusting for 2-, 3-, 4-, or 5-digit quotes — ensuring professional-grade precision that matches institutional ATR-based risk systems.
📊 Features:
Uses ATR × Multiplier to determine precise SL distance in pips.
Automatically adjusts pip value depending on the asset type (handles 5-digit Forex brokers).
Clean and minimal design — displays only one info box in the top-right corner.
Fully customizable text and background colors.
Includes alert condition for automated SL updates.
⚙️ How to use:
Set your preferred ATR period and multiplier.
The indicator instantly displays your Stop Loss distance in pips at the top-right of the chart.
Combine with your entry strategy to calculate lot size or risk per trade.
💡 Ideal for traders who want consistent, objective SL distances derived from volatility rather than arbitrary points or emotions.
Note: Educational and informational tool only. Does not execute trades or give financial advice.

jays Standard Deviation (jaytrades)The Jay Trades StdDev Zones indicator is a professional volatility mapping tool designed for intraday futures traders who want precision levels based on daily price behavior. It uses standard deviation of daily price changes to draw automatic dynamic support/resistance zones on lower timeframes — helping you identify key reaction points, expansion zones, and high-probability trade setups.

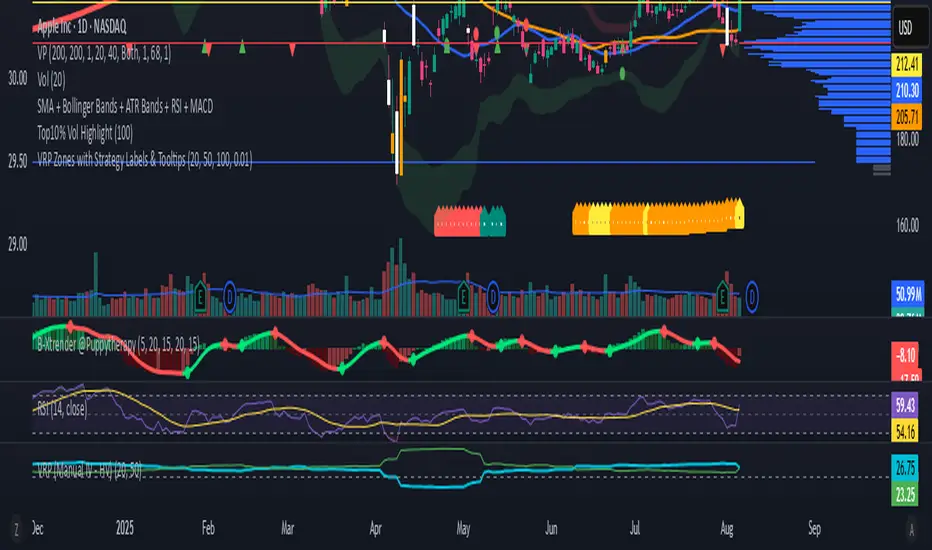
VRP Zones with Strategy Labels & TooltipsThis script marries the core concept of Volatility Risk Premium—how far implied vol sits above or below realized vol—with practical, on-chart signals that guide you toward specific options trades. By seeing “High VRP” in orange or “Negative VRP” in red right on your price bars (with hover-for-tooltip strategy tips), you get both the quantitative measure and the qualitative trade idea in one glance.
VIX9D to VIX RatioVIX9D to VIX Ratio
The ratio > 1 can signal near-term fear > long-term fear (potential short-term stress).
The ratio < 1 implies long-term implied volatility is higher — more typical in calm markets.

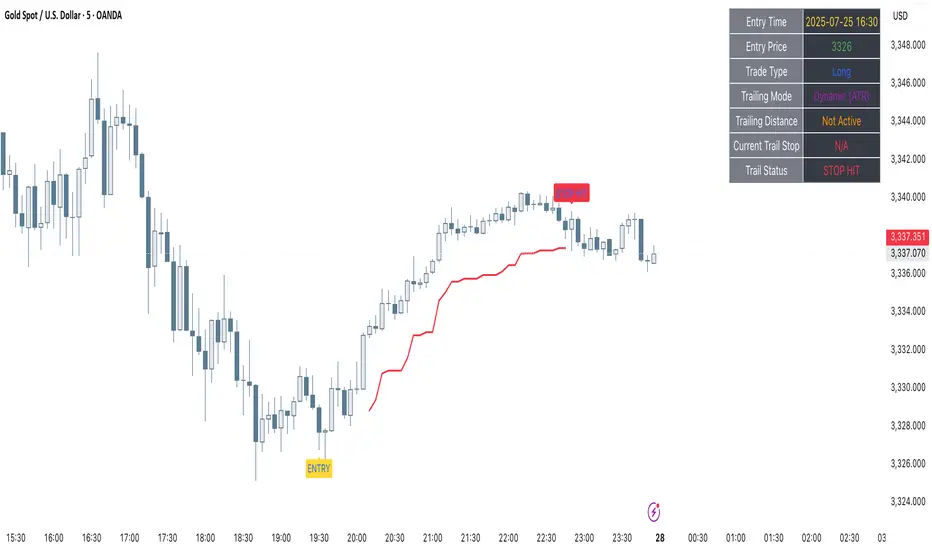
Clarix Trailing MasterClarix Trailing Master
Advanced Manual Entry Trailing Stop Strategy
Purpose :
Clarix Trailing Master is designed to give traders precise control over trade exits with a customizable trailing stop system. It combines manual entry inputs with dynamic and static trailing stop options, empowering users to protect profits while minimizing premature stop-outs.
How It Works:
You manually input your trade entry price and specify the trade direction (Long or Short).
The strategy activates the trailing stop only after the price moves favorably by a configurable profit threshold. This helps avoid early stop losses during initial market noise.
You can choose between a dynamic trailing stop based on Average True Range (ATR) or a fixed static trailing distance. The ATR can also be computed on a higher timeframe for enhanced stability.
Once active, the trailing stop updates live with price movements, ensuring your gains are locked in progressively.
If the price crosses the trailing stop, a clear alert triggers, and the stop-hit status displays visually on the chart.
Key Features:
Manual entry with exact price and timestamp input for precise trade tracking.
Supports both Long and Short trades.
Choice between dynamic ATR-based trailing or static trailing stops.
Configurable profit threshold before trailing stop activation to avoid early exits.
Visual markers for entry and stop-hit points (yellow and red respectively).
Live dashboard displaying entry details, trade status, trailing mode, and current stop level.
Works on all asset classes and timeframes, adaptable to various trading styles.
Built-in audio alert notifies you immediately when the trailing stop is hit.
Usage Tips:
Adjust the profit threshold and ATR settings based on your asset’s volatility and timeframe. For example, use higher ATR multipliers for more volatile markets like crypto.
Consider using higher timeframe ATR values for smoother trailing stops in fast-moving markets.
Ideal for swing trading or position trading where precise stop management is crucial.
Always backtest and paper trade before applying to live markets.
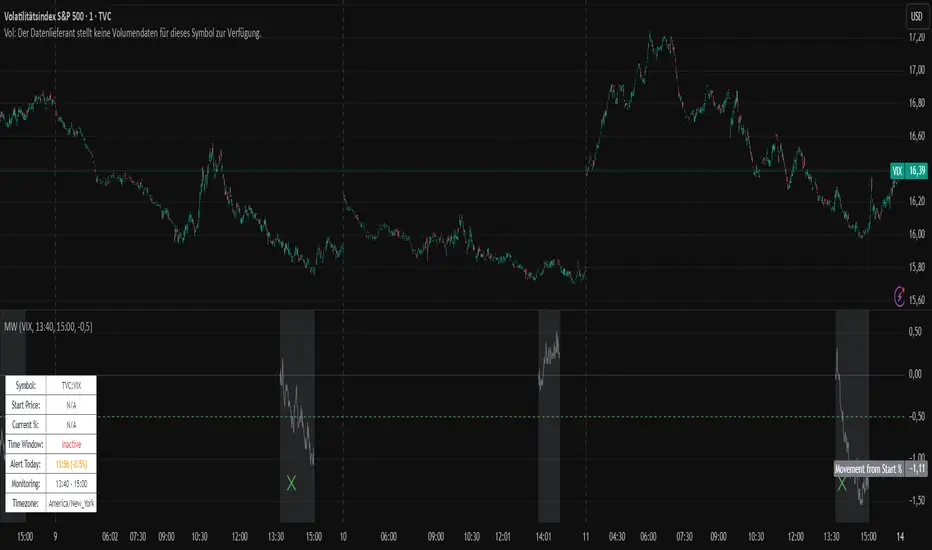
Movement WatcherMovement Watcher – Intraday Price Change Alert
This indicator tracks the percentage price movement of a selected symbol (e.g., VIX) from a configurable start time. If the intraday movement crosses a defined threshold (up or down), it triggers a one-time alert per day.
Key Features:
Monitors intraday % change from the specified start time.
Triggers one-time alerts for upper or lower threshold crossings.
Optional end time for monitoring period.
Visual plots and alert markers.
Useful for automated trading via webhook integrations.
This script was designed to work with automated trading tools such as the Trading Automation Toolbox. You can use it to generate alerts based on intraday volatility and route them via webhook for automated strategies.
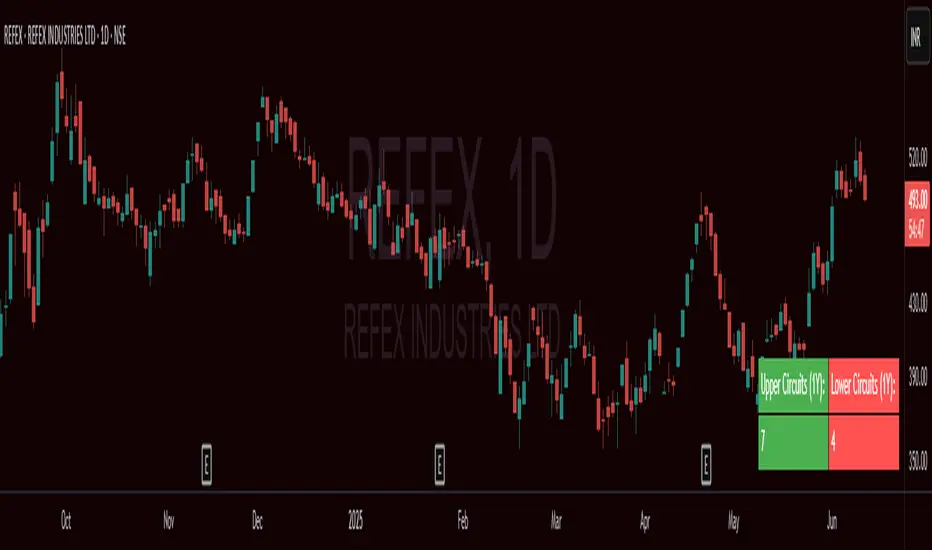
Circuit Counter (1Y)# Circuit Counter (1Y) - Pine Script Indicator
## Overview
The Circuit Counter (1Y) is a comprehensive technical analysis tool designed to track and count circuit breaker events over a rolling 12-month period (252 trading bars). This indicator helps traders identify stocks or securities that frequently hit upper or lower circuit limits, providing valuable insights into price volatility patterns and market behavior.
## Key Features
### Circuit Detection Algorithm
- **Precision Tracking**: Monitors exact 5%, 10%, and 20% price movements with high accuracy (0.01% tolerance)
- **Upper Circuit Detection**: Identifies when closing price equals daily high AND represents a 5%, 10%, or 20% gain
- **Lower Circuit Detection**: Identifies when closing price equals daily low AND represents a 5%, 10%, or 20% loss
- **Real-time Analysis**: Continuously updates circuit counts as new bars form
### Visual Display
- **Clean Table Interface**: Displays circuit counts in an organized table positioned at bottom-right of chart
- **Color-coded Results**: Green background for upper circuits, red background for lower circuits
- **Professional Formatting**: White text on colored backgrounds for optimal readability
- **Non-intrusive Design**: Overlay indicator that doesn't interfere with price action analysis
### Customization Options
- **Adjustable Lookback Period**: Default 252 bars (1 trading year) with flexibility to modify based on analysis needs
- **Minimum Value Protection**: Input validation ensures lookback period cannot be set below 1 bar
## Technical Specifications
- **Version**: Pine Script v5
- **Chart Type**: Overlay indicator
- **Performance**: Optimized loop structure for efficient historical data processing
- **Compatibility**: Works on all timeframes and asset classes
- **Memory Management**: Uses variable declarations for optimal performance
*This indicator is designed for educational and analytical purposes. Past circuit breaker activity does not guarantee future performance or price movements.*
Relative ATRThis indicator enhances the standard Average True Range (ATR) by providing context about current volatility relative to its recent historical average. It highlights periods where ATR is significantly higher or lower than its own recent norm.

pips barThis indicator displays a line (pips bar) of lengths corresponding to the set number of pips on the chart. This pips bar serves as a reference for assessing the volatility of the displayed chart. One pip for currency pairs is distinguished for JPY pairs and for others.
The horizontal position of the pips bar is offset to the right of the latest bar by the specified bar amount, and the vertical position can be selected from Top, Middle, or Bottom, calculated using the maximum and minimum values visible on the chart.
