(JS) Checklist SignalsWhat if I told you that you could use over 10 indicators at once without having a single one of them on you chart? Enter the Checklist Signals. This is probably the most complex yet simple indicator I've ever done.
What you get is 6 rows (if you want them all) of labels that hover at the top of your screen with a ton of extremely useful information. I will go down the list of options in the indicator settings and explain how it all works.
So the label placement is based on ATR. You choose your X Axis and Y Axis starting point then adjust the lookback period. Default lookback is 600 bars. What that means is, the indicator finds the highest high in the last 600 bars, then begins to place the labels above that zone based on the ATR of the chart. Different timeframes require very different combinations so it's all customizable. Sometimes if labels overlap you need to adjust the X Axis starting point, or the spread on either axis.
The next set of options allows you to decide what you'd prefer to be set on or off. Let's start with ATR and VWAP. I have added bands for both of these. When price is below the mean (which is the 21 ema by default), then the labels show you the next 5 standard deviations of ATR going down. When under one of these levels the label turns red. The opposite is true when above the mean and in those instances the labels will be green. It is the same with the VWAP, though instead of using the mean we use the daily VWAP as the starting point. If you choose to have levels switched on then you can see the actual values of each standard deviation level. Down lower in the options you can change the resolution and source used for VWAP.
The next option is "Trending". This creates a moving average using the length of the Trending Lookback Period (default is 5) and then tells you using arrows in the label which direction the trend of the indicator is going.
The next area let's you specify the information you receive in the Squeeze labels. By default all options are one - and this tells you if there's a Squeeze, what type of Squeeze there is, and how many bars the Squeeze has been building up or since it fired. These labels are color coded to correspond with the Squeeze type as well.
Then we get to another one of my indicators, the Ballista. One of the main signals is the "Inverted Squeeze" where the short term momentum inverts against the long term momentum. Here I have the distance between the two oscillators in the first label, and then the second label tells you if there's an Inverted Squeeze signal, if there's potential entry, confirmed entry, or how many bars its been since the last entry signal.
The next feature is off by default, but it will add arrows to your chart based on a simple lower highs and higher lows signals. Turning arrows on will place them right on your chart above or below each bar.
The rest of it is customizable settings of all the other indicators that are shown. Now looking at the labels themselves, starting in the top left corner:
First Row-
ADX + DMI: These labels show the ADX, DI+, & DI- values in each label. Whenever the DI+ or DI- is above the other then their respective label will light up. Also, when the ADX is above 20 (confirming the trend) it lights up in the same color as well.
Squeeze: I described how this worked above, the labels tell you if there's a Squeeze, how long there's been one, and how long since it fired, all while also changing to color of the associated Squeeze type.
Second Row -
Stacked EMAs: The top label looks at the EMA values using the numbers of the Fibonacci sequence. It looks at the EMA 8, 21, 34, 55, 89, & 233 and tells you if they're all stacked in the same direction (Stacked Bear meaning they're all crossed down in order, Stacked Bull meaning they're all crossed up in order). If the EMAs are all stacked but 1 or 2 it will say Stacked -1 or Stacked -2. When they're all over the place it will say they aren't stacked at all.
BB%: This tells you the value of the Bollinger Band %. If this is negative then you know that price is currently below the lower Bollinger Band, and if it is above 100% it is above the upper Bollinger Band.
RSI: This tells you the value of the RSI and the label changes colors based on the value.
Stoch: This tells you the Stochastic value and changes colors based on the value, same as the RSI.
Third Row -
The Mean: This tells you the numerical value of whatever you have the mean set as (21 ema by default). The label changes colors based on price being above or below the mean.
One ATR: This was something I added for those looking to plan their trades out. This tells you the value of one ATR so you can have a better idea of how to plan your trades based on this distance.
VIX: This tells you the current value of the VIX, and color changes based on being green or red on the day.
Ballista: I explained this above, it tells you the distance between the two oscillators and changes colors based on the trend being above or below 0. When there's an Inverted Squeeze this label is gray.
Inverted Squeeze: This label tells you if there's an inverted squeeze as well as if it is showing an entry or how many bars since the last entry signal. This label turns fuchsia on a bear signal and lime on a bull signal.
Fourth Row -
ATR Bands: As I explained above, this plots each standard deviation using ATR and changes colors based on price's relationship to each one.
Fifth Row -
VWAP: The three labels here show the daily, weekly, and monthly VWAP values, and color changes based on price's relationship to each one.
Sixth Row -
VWAP Bands: These are the standard deviation levels of the VWAP resolution of your choosing (as explained above), and just as the others, colors change based on price's relationship to each one.
I thought this was a really cool indicator that could be used for people like me who like knowing the right information, but HATE having their charts clustered with a ton of stuff. Hope you all like it, enjoy!
ค้นหาในสคริปต์สำหรับ "VWAP"
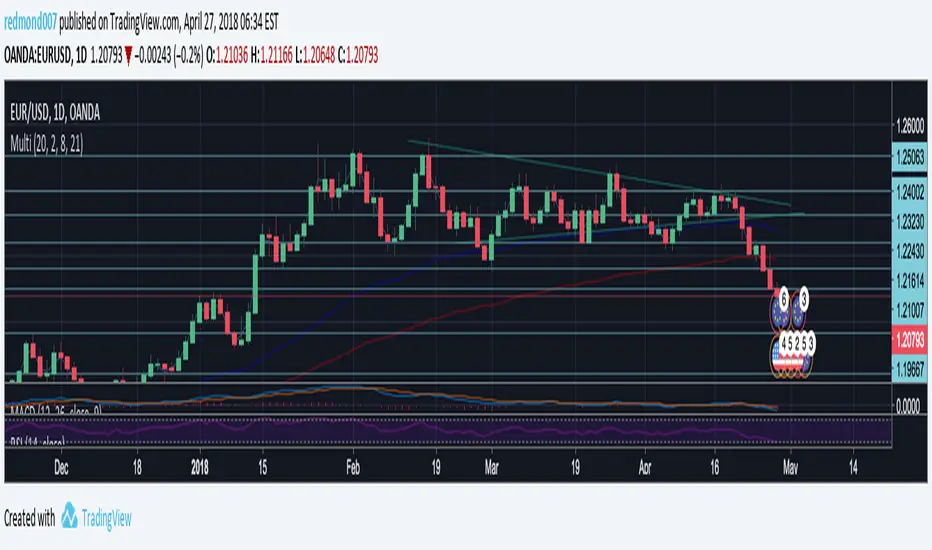
Trend Engine [MMT]The Trend Engine is a versatile Pine Script indicator designed to identify trend direction, potential reversals, and key price levels using a combination of Exponential Moving Averages (EMAs), and Anchored Volume-Weighted Average Price (VWAP). This indicator provides traders with a clear visual representation of market bias, momentum, and key support/resistance levels, making it suitable for both trend-following and pullback trading strategies.
Key Features:
1. EMA Cloud System:
- Displays three customizable EMAs (Fast, Pullback, and Slow) with configurable lengths and visibility.
- Creates two cloud fills:
- Fast Cloud : Between the Fast EMA (default: 8) and Pullback EMA (default: 13).
- Slow Cloud : Between the Pullback EMA and Slow EMA (default: 21).
- Clouds are color-coded (green for bullish, red for bearish) based on EMA alignment, with adjustable transparency for clarity.
2. Bias EMA:
- A longer-term EMA (default: 35) indicates the overall market bias.
- Changes color based on whether the regular candle close is above (green) or below (red) the Bias EMA, providing a clear trend direction signal.
3. Heikin Ashi Signals:
- Utilizes Heikin Ashi candles to detect strong bullish or bearish momentum.
- Generates buy/sell signals when a Heikin Ashi candle confirms a trend (bullish HA candle closing above Bias EMA for buy, bearish HA candle closing below for sell).
- Signal arrows are currently disabled but can be enabled via settings for visual confirmation.
4. Anchored VWAP and Standard VWAP:
- Plots both a standard VWAP and an Anchored VWAP (anchored to the US RTH session, 09:30–16:00 EST).
- Customizable line styles (solid, cross, or circles) and colors for both VWAPs, aiding in identifying dynamic support/resistance levels.
5. Background and Candle Coloring:
- Optional background coloring reflects the market bias (green for bullish, red for bearish) based on the regular close relative to the Bias EMA.
- Optional Heikin Ashi candle coloring to visually distinguish bullish and bearish market conditions.
6. Regular Candle Close:
- Option to plot the regular (non-Heikin Ashi) close price with customizable styles (line, circles, or cross) for reference.
7. Alerts:
- Built-in alert conditions for bullish and bearish signals, allowing traders to receive notifications when a Heikin Ashi candle confirms a trend relative to the Bias EMA.
How to Use:
- Trend Identification : Use the Bias EMA and background color to determine the overall market direction.
- Pullback Trading : Monitor the EMA clouds for alignment (bullish or bearish) and use the Pullback EMA for entries during retracements.
- Support/Resistance : Leverage the VWAP and Anchored VWAP as dynamic levels for trade entries or exits.
- Signal Confirmation : Enable signal arrows (when fixed) to spot high-probability trend continuation or reversal setups.
- Customization : Adjust EMA lengths, colors, transparency, and visibility to suit your trading style and timeframe.
Settings:
- EMA Cloud : Customize lengths (default: 8, 13, 21), visibility, and cloud colors/transparency.
- Bias EMA : Adjust length (default: 35) and colors for above/below states.
- VWAP : Toggle standard and Anchored VWAP, with customizable styles and colors.
- Background/Candles : Enable/disable background and candle coloring for visual clarity.
- Regular Close : Show/hide the regular close price with style options.
Notes:
- Designed for use on any timeframe, but most effective on intraday (e.g., 5m, 15m) or daily charts.
- Best used in conjunction with other technical analysis tools for confirmation.
- Anchored VWAP is tailored for US markets (RTH session) but can be adjusted for other sessions by modifying the anchor time in the code.
Ideal For:
- Day traders and swing traders looking for trend direction and pullback opportunities.
- Traders using VWAP-based strategies for intraday support/resistance.
- Those seeking a clean, customizable visual aid for market bias and momentum.
This indicator is a powerful tool for traders aiming to capture trends and manage risk effectively, with extensive customization to adapt to various markets and trading styles.
Ultimate Lines Statistical Backtest @MaxMaseratiUltimate lines (MAs/MACD/VWAP,DWA etc..) Statistical Backtest
This is a comprehensive statistical backtesting tool that allows traders to objectively measure the performance of 27+ different trading lines across multiple timeframes and sessions. Instead of guessing which moving averages, VWAPs, or volume levels actually work for your trading style, this indicator provides hard data showing exactly how price behaves around each line at specific times of day.
The indicator solves a critical problem: most lines create whipsaws in choppy markets, but knowing which lines have the highest continuation rates vs reversal rates at specific session times helps you avoid false signals and focus on setups with proven statistical edges.
🎯 LINES YOU CAN TEST
MMM Core Lines:
Mid MA: Trend velocity tracker using simple moving average
MMPD Line: Premium/Discount change-of-direction indicator
Fair Value Golden Ratio: 0.618 equilibrium level between premium and discount zones
Volume-Based Lines:
VWAP Daily/Weekly: Volume-weighted average price (daily and weekly sessions)
Volume POC Multi-TF: Multi-timeframe Point of Control (highest volume price level)
Volume POC Weekly: Weekly momentum pivot based on volume distribution
Range Midpoints:
Range Midpoint 50: 50-period high/low midpoint
Range Midpoint 14 TF1/TF2: Configurable timeframe range midpoints with smoothing options
Moving Averages (10 MA Types):
MACD Fast (12) / Signal (26): Standard MACD moving averages
Fast MA 20 / Mid MA 50 / Slow MA 200: Classic trend-following averages
Available MA Types: SMA, EMA, WMA, HMA, DEMA, TEMA, LSMA, KAMA, ALMA, VWMA
Volatility Indicators:
MVM Upper/Lower Bands: Momentum-based volatility bands with adaptive option
HVC Bullish/Bearish: High Volume Candle support/resistance levels
Ultimate Suite Advanced Lines:
DWAP (Delta Weighted Average Price): Directional volume-weighted price with upper/lower bands
HVN (High Volume Node): High-frequency trading node detection
Hybrid Line: Volume-weighted momentum composite
Trend Filter: Two-pole smoothing filter for trend clarity
STL Lines:
iBuSTL / iBeSTL: Internal Bullish/Bearish Structural Trend Liquidity levels
⚙️ HOW TO TEST
Select Lines: Check the boxes for lines you want to analyze (Mid MA, VWAP Daily, Volume POC, etc.)
Choose Times: Enable tracking for specific session times (default: 8:30 AM, 9:30 AM, 10:00 AM, Daily Close - EST)
Set Lookback: Choose how many days of historical data to analyze (default: 60 days)
Enable Pattern Analysis: Turn on "Enable Pattern Analysis" in settings
Wait for Data: The indicator needs 20 bars after each signal time to complete analysis
Review Statistics: Check the statistics table for detailed breakdowns
📈 STATISTICS EXPLAINED
For Each Tracked Time, You'll See:
🟢 Above Selected Lines (X samples):
Continued↑: Price stayed above the lines = bullish continuation
Reversed↓: Price broke below the lines = reversal/rejection
→Kept Going↓: After reversing down, price continued lower (bars 11-20)
→Stalled: After reversing down, price came back up (consolidation)
Neutral: Price didn't make a clear move either way
🔴 Below Selected Lines (X samples):
Continued↓: Price stayed below the lines = bearish continuation
Reversed↑: Price broke above the lines = reversal/support bounce
→Kept Going↑: After reversing up, price continued higher (bars 11-20)
→Stalled: After reversing up, price came back down (consolidation)
Neutral: No clear directional move
⭐ Star Ratings: Show which outcome happens most frequently (best probability)
🔬 HYBRID DETECTION SYSTEM (ADVANCED)
When enabled, the indicator uses a multi-signal composite scoring system that goes beyond simple percentage movements:
Signal A - % Movement Direction (40% weight):
Measures the strength and direction of price movement. Strong directional moves (>0.8%) score higher, while opposite-direction moves score negatively.
Signal B - Inside Candles (30% weight):
Detects true consolidation by counting how many candles close within a defined range. High inside-candle counts indicate choppy, stalled price action rather than clean continuation.
Signal C - Successive Closes (30% weight):
Tracks momentum persistence by counting consecutive closes in the expected direction. Long streaks (6+ bars) indicate strong follow-through, while breaks in the sequence suggest weakness.
Composite Score Classification:
⭐⭐⭐ Strong (75-100 points): All three signals align - high-confidence pattern
⭐⭐ Moderate (50-75 points): Two signals agree - reliable pattern
⭐ Weak (25-50 points): Mixed signals - lower confidence
⚠️ Strong Stalled (0-25 points): Signals show consolidation/reversal
This provides nuanced pattern detection that identifies not just IF a pattern succeeded, but HOW STRONGLY it performed.
💡 INTERPRETING RESULTS
Good Lines Show:
High continuation % when price is above/below (>60% is strong)
Clean "Kept Going" patterns after reversals (>50% indicates reliable rejection)
Low stalled % (less whipsaw/consolidation)
Consistent patterns across multiple times (validates the line's reliability)
Poor Lines Show:
50/50 continuation vs reversal (coin flip = no edge)
High stalled % (lots of whipsaw/false signals)
Inconsistent patterns across different times (unreliable)
Example Interpretation:
9:30 AM - VWAP Daily (120 samples)
🟢 Above:
Continued↑ 75 (62.5%) ⭐ BEST
Reversed↓ 30 (25.0%)
Meaning: When price is above VWAP Daily at 9:30 AM, it continues higher 62.5% of the time - this is a statistically strong bullish signal for that session time.
🎯 PRACTICAL VALUE
Solves the Whipsaw Problem:
Most moving averages and lines work beautifully in trending markets but create endless false signals in choppy, range-bound conditions. By analyzing specific session times and continuation vs reversal patterns, you can:
Identify high-probability setups: Focus on lines that show >60% continuation at your preferred trading times
Avoid weak signals: Skip lines with high stall rates or 50/50 outcomes
Time your entries better: Know which session times produce the cleanest patterns
Combine complementary lines: Stack multiple high-scoring lines for confluence
Adapt to market conditions: Switch to different lines when market structure changes
Real-World Application:
Instead of blindly trading VWAP crosses or MA bounces, you'll have objective data showing: "At 9:30 AM on ES, when price is above Mid MA + VWAP Daily + Volume POC, it continues higher 68% of the time with strong momentum (⭐⭐⭐)." This transforms discretionary guesswork into data-driven decision making.
⚙️ LINE DEFINITIONS
Moving Averages: Smooth price data over X periods to identify trend direction and dynamic support/resistance.
VWAP: Anchored average price weighted by volume - institutional traders' benchmark for "fair value."
Volume POC (Point of Control): Price level with the most traded volume - represents maximum market acceptance.
Fair Value Golden Ratio: Fibonacci 0.618 level between recent premium (high) and discount (low) - equilibrium zone.
DWAP (Delta Weighted): Price average weighted by buying vs selling volume delta - shows directional money flow.
Range Midpoints: Geometric center of recent high/low range - mean reversion pivot.
Volatility Bands: Envelope around momentum lines showing normal price deviation ranges.
HVN (High Volume Node): Automated detection of high-volume price clusters - institutional accumulation/distribution zones.
Note: This indicator is purely for statistical analysis and backtesting. It does not generate trade signals or provide entry/exit recommendations. Use the statistics to inform your own trading decisions and strategy development.
Volume Climax Reversal (VCR) — Catch Exhaustion Tops & BottomsNew! VCR spots exhaustion spikes at highs/lows using volume extremes + price action + VWAP context.
If you trade parabolic runners, indices, or mean-reversion edges, VCR helps you time the backside (shorts) and fade capitulation (longs) with clean, rule-based signals.
What it does
Detects volume climax: current volume > SMA(len) × multiplier and a new volume high in the lookback.
Confirms price context: makes a higher high (for tops) or lower low (for bottoms).
Filters with VWAP (optional): bearish signals only below VWAP, bullish signals only above VWAP.
Optional wick filter: requires an exhaustion wick > body to reduce chop.
Why traders like it
Clear entries: “VCR↓” (bearish) at exhaustion tops, “VCR↑” (bullish) at washout lows.
Fewer false signals: VWAP gating + wick filter focus on true climaxes.
Built-in alerts: set once, get notified on your phone/desktop when a setup appears.
How I trade it (simple playbook)
Bearish reversal (short / puts)
Wait for VCR↓ (exhaustion at/near HH).
Look for a lower high that fails to reclaim the signal candle high.
Enter on the break of that lower-high candle low.
Stop above the signal wick high.
Covers/targets: VWAP first; then 20–30% fade from the local top / prior demand.
Bullish reversal (long / calls)
Wait for VCR↑ (capitulation at/near LL).
Look for a higher low that holds above the signal candle low.
Enter on the break of the HL candle high.
Stop below the signal wick low.
Targets: VWAP first; then prior supply/MA bands.
Tip for small-cap/“Dux” style: VCR pairs perfectly with a gap + high USD-rotation scan. Let them blow off, then use VCR for the timing.
Inputs (tune to your market)
Volume SMA Length (default 20)
Volume Spike Multiplier (default 2.0)
Lookback High / Low (default 10 / 10)
Require VWAP confirmation? (on)
Use wick filter? (on)
Works on stocks, indices, futures, crypto.
Timeframes: 1–15m for day trading; 1h–4h–D for swing.
Alerts
Set one (or both) alerts and forget it:
Bearish Volume Climax — VCR↓
Bullish Volume Climax — VCR↑
You’ll get instant notifications when a qualified top/bottom prints.
Best practices
Don’t countertrend the first front-side ramp—wait for the VCR and a lower-high/higher-low.
Respect VWAP: it’s your first profit-taking and a bias filter.
Size small into volatility; widen stops in fast markets.
Combine with your watchlist filters (gap %, float/O/S, USD rotation, session timing).
What’s included
Clean visual signals (triangles + subtle background shading)
Session-anchored VWAP
Alert conditions that appear in TradingView’s alert menu
Sensible defaults + clear docs (this post)
FAQ
Q: Does it repaint?
No. VCR uses completed-bar data; signals print end-of-bar.
Q: Which markets?
Anything with volume: US equities, futures, crypto, indices.
Q: Can I use it for scalps?
Yes—1–5m with wick filter on and VWAP required works well.
Get more / upgrades
I’m iterating fast (MTF filter, heatmap panel, combined “one-alert” mode).
Want the pro template with dashboard & combined alerts? Message me on TV or DM / email you@domain.com
.
Risk Notice
This is educational research, not financial advice. Markets carry risk—always manage position size and use stops.
If this helped you, smash the 👍 and ⭐ — it really helps!
#volume #vwap #reversal #exhaustion #trendreversal #smallcaps #scalping #daytrading #swingtrading #stocks #futures #crypto #indicator
Session Open Range, Breakout & Trap Framework - TrendPredator OBSession Open Range, Breakout & Trap Framework — TrendPredator Open Box
Stacey Burke’s trading approach combines concepts from George Douglas Taylor, Tony Crabel, Steve Mauro, and Robert Schabacker. His framework focuses on reading price behaviour across daily templates and identifying how markets move through recurring cycles of expansion, contraction, and reversal. While effective, much of this analysis requires real-time interpretation of session-based behaviour, which can be demanding for traders working on lower intraday timeframes.
The TrendPredator indicators formalize parts of this methodology by introducing mechanical rules for multi-timeframe bias tracking and session structure analysis. They aim to present the key elements of the system—bias, breakouts, fakeouts, and range behaviour—in a consistent and objective way that reduces discretionary interpretation.
The Open Box indicator focuses specifically on the opening behaviour of major trading sessions. It builds on principles found in classical Open Range Breakout (ORB) techniques described by Tony Crabel, where a defined time window around the session open forms a structural reference range. Price behaviour relative to this range—breaking out, failing back inside, or expanding—can highlight developing session bias, potential trap formation, and directional conviction.
This indicator applies these concepts throughout the major equity sessions. It automatically maps the session’s initial range (“Open Box”) and tracks how price interacts with it as liquidity and volatility increase. It also incorporates related structural references such as:
* the first-hour high and low of the futures session
* the exact session open level
* an anchored VWAP starting at the session open
* automated expansion levels projected from the Open Box
In combination, these components provide a unified view of early session activity, including breakout attempts, fakeouts, VWAP reactions, and liquidity targeting. The Open Box offers a structured lens for observing how price transitions through the major sessions (Asia → London → New York) and how these behaviours relate to higher-timeframe bias defined in the broader TrendPredator framework.
Core Features
Open Box (Session Structure)
The indicator defines an initial session range beginning at the selected session open. This “Open Box” represents a fixed time window—commonly the first 30 minutes, or any user-defined duration—that serves as a structural reference for analysing early session behaviour.
The range highlights whether price remains inside the box, breaks out, or rejects the boundaries, providing a consistent foundation for interpreting early directional tendencies and recognising breakout, continuation, or fakeout characteristics.
How it works:
* At the session open, the indicator calculates the high and low over the specified time window.
* This range is plotted as the initial structure of the session.
* Price behaviour at the boundaries can illustrate emerging bias or potential trap formation.
* An optional secondary range (e.g., 15-minute high/low) can be enabled to capture early volatility with additional precision.
Inputs / Options:
* Session specifications (Tokyo, London, New York)
* Open Box start and end times (e.g., equity open + first 30 minutes, or any custom length)
* Open Box colour and label settings
* Formatting options for Open Box high and low lines
* Optional secondary range per session (e.g., 15-minute high/low)
* Forward extension of Open Box high/low lines
* Number of historic Open Boxes to display
Session VWAPs
The indicator plots VWAPs for each major trading session—Asia, London, and New York—anchored to their respective session opens. These session-specific VWAPs assist in tracking how value develops through the day and how price interacts with session-based volume distributions.
How it works:
* At each session open, a VWAP is anchored to the open price.
* The VWAP updates throughout the session as new volume and price data arrive.
* Deviations above or below the VWAP may indicate balance, imbalance, or directional control.
* Viewed together, session VWAPs help identify transitions in value across sessions.
Inputs / Options:
* Enable or disable VWAP per session
* Adjustable anchor and end times (optionally to end of day)
* Line styling and label settings
* Number of historic VWAPs to draw
First Hour High/Low Extensions
The indicator marks the high and low formed during the first hour of each session. These reference points often function as early control levels and provide context for assessing whether the session is establishing bias, consolidating, or exhibiting reversal behaviour.
How it works:
* After the session starts, the indicator records the highest and lowest prices during the first hour.
* These levels are plotted and extended across the session.
* They provide a visual reference for observing reactions, targets, or rejection zones.
Inputs / Options:
* Enable or disable for each session
* Line style, colour, and label visibility
* Number of historic sessions displayed
EQO Levels (Equity Open)
The indicator plots the opening price of each configured session. These “Equity Open” levels represent short-term reference points that can attract price early in the session.
Once the level is revisited after the Open Box has formed, it is automatically cut to avoid clutter. If not revisited, the line remains as an untested reference, similar to a naked point of control.
How it works:
* At session open, the open price is recorded.
* The level is plotted as a local reference.
* If price interacts with the level after the Open Box completes, the line is cut.
* Untested EQOs extend forward until interacted with.
Inputs / Options:
* Enable/disable per session
* Line style and label settings
* Optional extension into the next day
* Option for cutting vs. hiding on revisit
* Number of historic sessions displayed
OB Range Expansions (Automatic)
Range expansions are calculated from the height of the Open Box. These levels provide structured reference zones for identifying potential continuation or exhaustion areas within a session.
How it works:
* After the Open Box is formed, multiples of the range (e.g., 1×, 2×, 3×) are projected.
* These expansion levels are plotted above and below the range.
* Price reactions near these areas can illustrate continuation, hesitation, or potential reversal.
Inputs / Options:
* Enable or disable per session
* Select number of multiples
* Line style, colour, and label settings
* Extension length into the session
Stacey Burke 12-Candle Window Marker
The indicator can highlight the 12-candle window often referenced in Stacey Burke’s session methodology. This window represents the key active period of each session where breakout attempts, volatility shifts, and reversal signatures often occur.
How it works:
* A configurable window (default 12 candles) is highlighted from each session open.
* This window acts as a guide for observing active session behaviour.
* It remains visible throughout the session for structural context.
Inputs / Options:
* Enable/disable per session
* Configurable window duration (default: 3 hours)
* Colour and transparency controls
Concept and Integration
The Open Box is built around the same multi-timeframe logic that underpins the broader TrendPredator framework.
While higher-timeframe tools track bias and setups across the H8–D–W–M levels, the Open Box focuses on the H1–M30 domain to define session structure and observe how early intraday behaviour aligns with higher-timeframe conditions.
The indicator integrates with the TrendPredator FO (Breakout, Fakeout & Trend Switch Detector), which highlights microstructure signals on lower timeframes (M15/M5). Together they form a layered workflow:
* Higher timeframes: context, bias, and developing setups
* TrendPredator OB: intraday and intra-session structure
* TrendPredator FO: microstructure confirmation (e.g., FOL/FOH, switches)
This alignment provides a structured way to observe how daily directional context interacts with intraday behaviour.
See the public open source indicator TP FO here (click on it for access):
Practical Application
Before Session Open
* Review previous session Open Box, Open level, and VWAPs
* Assess how higher-timeframe bias aligns with potential intraday continuation or reversal
* Note untested EQO levels or VWAPs that may function as liquidity attractors
During Session Open
* Observe behaviour around the first-hour high/low and higher-timeframe reference levels
* Monitor how the M15 and 30-minute ranges close
* Track reactions relative to the session open level and the session VWAP
After the Open Box completes
* Assess price interaction with Open Box boundaries and first-hour levels
* Use microstructure signals (e.g., FOH/FOL, switches) for potential confirmation
* Refer to expansion levels as reference zones for management or target setting
After Session
* Review how price behaved relative to the Open Box, EQO levels, VWAPs, and expansion zones
* Analyse breakout attempts, fakeouts, and whether intraday structure aligned with the broader daily move
Example Workflow and Trade
1. Higher-timeframe analysis signals a Daily Fakeout Low Continuation (bullish context).
2. The New York session forms an Open Box; price breaks above and holds above the first-hour high.
3. A Fakeout Low + Switch Bar appears on M5 (via FO), after retesting the session VWAP triggering the entry.
4. 1x expansion level serves as reference targets for take profit.
Relation to the TrendPredator Ecosystem
The Open Box is part of the TrendPredator Indicator Family, designed to apply multi-timeframe logic consistently across:
* higher-timeframe context and setups
* intraday and session structure (OB)
* microstructure confirmation (FO)
Together, these modules offer a unified structure for analysing how daily and intraday cycles interact.
Disclaimer
This indicator is for educational purposes only and does not guarantee profits.
It does not provide buy or sell signals but highlights structural and behavioural areas for analysis.
Users are solely responsible for their trading decisions and outcomes.
NasyI## NasyI - Multi-Timeframe Technical Analysis Toolkit
### English Description
**NasyI** is a comprehensive technical analysis indicator designed to provide traders with a complete view of market dynamics across multiple timeframes. This indicator combines the power of Exponential Moving Averages (EMAs), Simple Moving Averages (MAs), Volume Weighted Average Price (VWAP), and key support/resistance levels to help traders identify trend direction, potential reversal points, and optimal entry/exit opportunities.
#### Key Features
1. **Multi-Timeframe Analysis System**
- 2-minute EMAs (13, 48) for ultra-short-term trend identification
- 5-minute EMAs (9, 13, 21, 48, 200) for short-term trend confirmation
- Daily EMAs (5, 13, 21, 48, 100, 200) and MAs (20, 50, 100, 200) for longer-term perspective
- Color-coded bands between key EMAs to visually identify trend strength and direction
2. **Advanced VWAP Integration**
- Daily VWAP for intraday support/resistance
- Weekly VWAP for medium-term price reference
- Monthly VWAP for long-term institutional price levels
- All VWAPs properly reset at their respective time period boundaries
3. **Critical Price Level Identification**
- Previous day high/low lines for identifying key breakout and breakdown levels
- Pre-market high/low tracking to identify potential intraday support/resistance zones
- All levels displayed with distinct line styles for easy identification
4. **Dynamic Trend Analysis**
- Color-coded bands between EMAs display trend strength and direction:
- Green bands indicate uptrend conditions (9 EMA > 21 EMA > 48 EMA)
- Red bands indicate downtrend conditions (9 EMA < 21 EMA < 48 EMA)
- Yellow bands indicate neutral/confused market conditions
- Visual representation makes trend changes immediately apparent
5. **Comprehensive Customization Options**
- Fully customizable colors for all indicators and bands
- Adjustable transparency settings for visual clarity
- Optional price labels with customizable placement and appearance
- Ability to show/hide specific components based on trading preferences
#### Trading Applications
This indicator is particularly valuable for:
1. **Day Trading & Scalping**: The 2-minute and 5-minute EMAs with color bands provide clear short-term trend direction and potential reversal signals.
2. **Swing Trading**: Daily EMAs and MAs offer perspective on the larger trend, helping to align short-term trades with the broader market direction.
3. **Gap Trading**: Previous day and pre-market levels help identify potential gap fill scenarios and breakout/breakdown opportunities.
4. **VWAP Trading Strategies**: Multiple timeframe VWAPs allow for identifying institutional participation levels and potential reversal zones.
5. **EMA Cross Systems**: The various EMAs can be used to identify golden crosses and death crosses across multiple timeframes.
#### How the Components Work Together
The power of NasyI comes from the integration of these different technical elements:
1. The short-timeframe EMAs (2m, 5m) provide immediate trend information, while the daily EMAs/MAs provide context about the larger market structure.
2. The color bands between EMAs offer instant visual confirmation of trend alignment or divergence across timeframes.
3. Previous day and pre-market levels add horizontal support/resistance zones to complement the dynamic moving averages.
4. Multiple timeframe VWAPs provide additional confirmation of institutional activity levels and potential reversal points.
By combining these elements, traders can develop a comprehensive market view that integrates price action, trend direction, and key support/resistance levels all in one indicator.
#### Usage Instructions
1. Apply the NasyI indicator to your chart (works best on intraday timeframes from 1-minute to 30-minute).
2. Observe the relationship between price and the various EMAs:
- Price above the 2m/5m EMAs with green bands indicates bullish short-term conditions
- Price below the 2m/5m EMAs with red bands indicates bearish short-term conditions
3. Use the daily EMAs/MAs and VWAPs as targets for potential price movements and reversal zones.
4. Previous day and pre-market high/low lines provide key levels to watch for breakouts or breakdowns.
5. Customize the appearance according to your preferences using the extensive settings options.
This indicator represents a unique approach to technical analysis by combining multiple timeframe perspectives into a single, visually intuitive display that helps traders make more informed decisions based on a comprehensive view of market conditions.
### 中文描述
**NasyI** 是一个全面的技术分析指标,旨在为交易者提供跨多个时间周期的完整市场动态视图。该指标结合了指数移动平均线(EMA)、简单移动平均线(MA)、成交量加权平均价格(VWAP)和关键支撑/阻力水平的力量,帮助交易者识别趋势方向、潜在反转点和最佳进出场机会。
#### 主要特点
1. **多时间周期分析系统**
- 2分钟EMAs(13,48)用于超短期趋势识别
- 5分钟EMAs(9,13,21,48,200)用于短期趋势确认
- 日线EMAs(5,13,21,48,100,200)和MAs(20,50,100,200)用于更长期的视角
- 关键EMAs之间的彩色带状区域直观显示趋势强度和方向
2. **高级VWAP整合**
- 日内VWAP作为日内支撑/阻力
- 周内VWAP作为中期价格参考
- 月内VWAP作为长期机构价格水平
- 所有VWAP在各自的时间周期边界正确重置
3. **关键价格水平识别**
- 前一交易日高点/低点线用于识别关键突破和跌破水平
- 盘前高点/低点跟踪用于识别潜在的日内支撑/阻力区域
- 所有水平以不同的线条样式显示,便于识别
4. **动态趋势分析**
- EMAs之间的彩色带状区域显示趋势强度和方向:
- 绿色带状区域表示上升趋势(9 EMA > 21 EMA > 48 EMA)
- 红色带状区域表示下降趋势(9 EMA < 21 EMA < 48 EMA)
- 黄色带状区域表示中性/混乱市场条件
- 视觉表示使趋势变化立即显现
5. **全面的自定义选项**
- 所有指标和带状区域的颜色完全可定制
- 可调节的透明度设置,提高视觉清晰度
- 可选的价格标签,带有可定制的位置和外观
- 能够根据交易偏好显示/隐藏特定组件
#### 交易应用
此指标对以下方面特别有价值:
1. **日内交易和短线交易**:2分钟和5分钟EMAs与色带提供清晰的短期趋势方向和潜在反转信号。
2. **摇摆交易**:日线EMAs和MAs提供对更大趋势的视角,帮助将短期交易与更广泛的市场方向对齐。
3. **缺口交易**:前一日和盘前水平帮助识别潜在的缺口填充情况和突破/跌破机会。
4. **VWAP交易策略**:多时间周期VWAP允许识别机构参与水平和潜在反转区域。
5. **EMA交叉系统**:各种EMAs可用于识别跨多个时间周期的黄金交叉和死亡交叉。
#### 组件如何协同工作
NasyI的强大之处在于这些不同技术元素的集成:
1. 短时间周期EMAs(2m,5m)提供即时趋势信息,而日线EMAs/MAs提供关于更大市场结构的背景。
2. EMAs之间的色带提供趋势对齐或跨时间周期分歧的即时视觉确认。
3. 前一日和盘前水平添加水平支撑/阻力区域,补充动态移动平均线。
4. 多时间周期VWAP提供机构活动水平和潜在反转点的额外确认。
通过结合这些元素,交易者可以发展出全面的市场视图,整合价格行动、趋势方向和关键支撑/阻力水平于一个指标中。
#### 使用说明
1. 将NasyI指标应用到您的图表上(最适合1分钟至30分钟的日内时间周期)。
2. 观察价格与各种EMAs之间的关系:
- 价格位于2m/5m EMAs之上,带有绿色带状区域,表示看涨的短期条件
- 价格位于2m/5m EMAs之下,带有红色带状区域,表示看跌的短期条件
3. 使用日线EMAs/MAs和VWAPs作为潜在价格移动和反转区域的目标。
4. 前一日和盘前高点/低点线提供需要关注的突破或跌破的关键水平。
5. 使用广泛的设置选项根据您的偏好自定义外观。
这个指标代表了一种独特的技术分析方法,将多个时间周期的视角结合到一个单一的、视觉直观的显示中,帮助交易者基于对市场条件的全面视图做出更明智的决策。
Combined EMA Technical AnalysisThis script is written in Pine Script (version 5) for TradingView and creates a comprehensive technical analysis indicator called "Combined EMA Technical Analysis." It overlays multiple technical indicators on a price chart, including Exponential Moving Averages (EMAs), VWAP, MACD, PSAR, RSI, Bollinger Bands, ADX, and external data from the S&P 500 (SPX) and VIX indices. The script also provides visual cues through colors, shapes, and a customizable table to help traders interpret market conditions.
Here’s a breakdown of the script:
---
### **1. Purpose**
- The script combines several popular technical indicators to analyze price trends, momentum, volatility, and market sentiment.
- It uses color coding (green for bullish, red for bearish, gray/white for neutral) and a table to display key information.
---
### **2. Custom Colors**
- Defines custom RGB colors for bullish (`customGreen`), bearish (`customRed`), and neutral (`neutralGray`) signals to enhance visual clarity.
---
### **3. User Inputs**
- **EMA Colors**: Users can customize the colors of five EMAs (8, 20, 9, 21, 50 periods).
- **MACD Settings**: Adjustable short length (12), long length (26), and signal length (9).
- **RSI Settings**: Adjustable length (14).
- **Bollinger Bands Settings**: Length (20), multiplier (2), and proximity threshold (0.1% of band width).
- **ADX Settings**: Adjustable length (14).
- **Table Settings**: Position (e.g., "Bottom Right") and text size (e.g., "Small").
---
### **4. Indicator Calculations**
#### **Exponential Moving Averages (EMAs)**
- Calculates five EMAs: 8, 20, 9, 21, and 50 periods based on the closing price.
- Used to identify short-term and long-term trends.
#### **Volume Weighted Average Price (VWAP)**
- Resets daily and calculates the average price weighted by volume.
- Color-coded: green if price > VWAP (bullish), red if price < VWAP (bearish), white if neutral.
#### **MACD (Moving Average Convergence Divergence)**
- Uses short (12) and long (26) EMAs to compute the MACD line, with a 9-period signal line.
- Displays "Bullish" (green) if MACD > signal, "Bearish" (red) if MACD < signal.
#### **Parabolic SAR (PSAR)**
- Calculated with acceleration factors (start: 0.02, increment: 0.02, max: 0.2).
- Indicates trend direction: green if price > PSAR (bullish), red if price < PSAR (bearish).
#### **Relative Strength Index (RSI)**
- Measures momentum over 14 periods.
- Highlighted in green if > 70 (overbought), red if < 30 (oversold), white otherwise.
#### **Bollinger Bands (BB)**
- Uses a 20-period SMA with a 2-standard-deviation multiplier.
- Color-coded based on price position:
- Green: Above upper band or close to it.
- Red: Below lower band or close to it.
- Gray: Neutral (within bands).
#### **Average Directional Index (ADX)**
- Manually calculates ADX to measure trend strength:
- Strong trend: ADX > 25.
- Very strong trend: ADX > 50.
- Direction: Bullish if +DI > -DI, bearish if -DI > +DI.
#### **EMA Crosses**
- Detects bullish (crossover) and bearish (crossunder) events for:
- EMA 9 vs. EMA 21.
- EMA 8 vs. EMA 20.
- Visualized with green (bullish) or red (bearish) circles.
#### **SPX and VIX Data**
- Fetches daily closing prices for the S&P 500 (SPX) and VIX (volatility index).
- SPX trend: Bullish if EMA 9 > EMA 21, bearish if EMA 9 < EMA 21.
- VIX levels: High (> 25, fear), Low (< 15, stability).
- VIX color: Green if SPX bullish and VIX low, red if SPX bearish and VIX high, white otherwise.
---
### **5. Visual Outputs**
#### **Plots**
- EMAs, VWAP, and PSAR are plotted on the chart with their respective colors.
- EMA crosses are marked with circles (green for bullish, red for bearish).
#### **Table**
- Displays a summary of indicators in a customizable position and size.
- Indicators shown (if enabled):
- EMA 8/20, 9/21, 50: Green dot if bullish, red if bearish.
- VWAP: Green if price > VWAP, red if price < VWAP.
- MACD: Green if bullish, red if bearish.
- MACD Zero: Green if MACD > 0, red if MACD < 0.
- PSAR: Green if price > PSAR, red if price < PSAR.
- ADX: Arrows for very strong trends (↑/↓), dots for weaker trends, colored by direction.
- Bollinger Bands: Arrows (↑/↓) or dots based on price position.
- RSI: Numeric value, colored by overbought/oversold levels.
- VIX: Numeric value, colored based on SPX trend and VIX level.
---
### **6. Alerts**
- Triggers alerts for EMA 8/20 crosses:
- Bullish: "EMA 8/20 Bullish Cross on Candle Close!"
- Bearish: "EMA 8/20 Bearish Cross on Candle Close!"
---
### **7. Key Features**
- **Flexibility**: Users can toggle indicators on/off in the table and adjust parameters.
- **Visual Clarity**: Consistent use of green (bullish), red (bearish), and neutral colors.
- **Comprehensive**: Combines trend, momentum, volatility, and market sentiment indicators.
---
### **How to Use**
1. Add the script to TradingView.
2. Customize inputs (colors, lengths, table position) as needed.
3. Interpret the chart and table:
- Green signals suggest bullish conditions.
- Red signals suggest bearish conditions.
- Neutral signals indicate indecision or consolidation.
4. Set up alerts for EMA crosses to catch trend changes.
This script is ideal for traders who want a multi-indicator dashboard to monitor price action and market conditions efficiently.
Trend Confirmation StrategyThe profitability and uniqueness of a trading strategy depend on various factors including market conditions, risk management, and the strategy's ability to capitalize on price movements. I'll describe the strategy provided and highlight its potential benefits and differences compared to other strategies:
Strategy Overview:
The provided strategy combines three technical indicators: Supertrend, MACD, and VWAP. It aims to identify potential entry and exit points by confirming trend direction and considering the proximity to the VWAP level. The strategy also incorporates stop-loss and take-profit mechanisms, as well as a trailing stop.
Unique Aspects and Potential Benefits:
Trend Confirmation: The strategy uses both Supertrend and MACD to confirm the trend direction. This dual confirmation can increase the likelihood of accurate trend identification and filter out false signals.
VWAP Confirmation: The strategy considers the proximity of the price to the VWAP level. This dynamic level can act as a support or resistance and provide additional context for entry decisions.
Adaptive Stop Loss: The strategy sets a stop-loss range, which helps provide some tolerance for minor price fluctuations. This adaptive approach considers market volatility and helps prevent premature stop-loss triggers.
Trailing Stop: The strategy incorporates a trailing stop mechanism to lock in profits as the trade moves in the desired direction. This can potentially enhance profitability during strong trends.
Partial Profit Booking: While not explicitly implemented in the provided code, you could consider booking partial profits when the MACD shows a crossover in the opposite direction. This aspect could help secure gains while still keeping exposure to potential further price movements.
Key Differences from Other Strategies:
Dual Indicator Confirmation: The combination of Supertrend and MACD for trend confirmation is a unique aspect of this strategy. It adds an extra layer of filtering to enhance the accuracy of entry signals.
Dynamic VWAP: Incorporating the VWAP level into the decision-making process adds a dynamic element to the strategy. VWAP is often used by institutional traders, and its inclusion can provide insights into the market sentiment.
Adaptive Stop Loss and Trailing: The strategy's use of an adaptive stop-loss range and a trailing stop can help manage risk and protect profits more effectively during changing market conditions.
Partial Profit Booking: The suggestion to consider partial profit booking upon MACD crossovers in the opposite direction is a practical approach to secure gains while staying in the trade.
Caution and Considerations:
Backtesting: Before deploying any strategy in real trading, it's crucial to thoroughly backtest it on historical data to understand its performance under various market conditions.
Risk Management: While the strategy has built-in risk management mechanisms, it's essential to carefully manage position sizes and overall portfolio risk.
Market Conditions: No strategy works well in all market conditions. It's important to be flexible and adjust the strategy or refrain from trading during particularly volatile or unpredictable periods.
Continuous Monitoring: Even though the strategy includes automated components, continuous monitoring of the trades and market conditions is necessary.
Adaptability: Markets can change over time. Traders need to be prepared to adapt the strategy as necessary to stay aligned with evolving market dynamics.
Smart Divergence [Reason Edition]Stop trading divergences "in thin air". Start trading structural confluence.
Most divergence indicators fail for one reason: they signal reversals based solely on oscillator math (RSI vs. Price), ignoring the chart's structure. This leads to costly entries against strong trends.
Smart Divergence solves this by applying an Institutional Context Filter. It does not simply alert you of a divergence; it validates the signal against key market structures ("Walls") and—crucially—tells you exactly why the signal appeared directly on the label.
🚀 How It Works: The "Smart Filter" Logic
This script operates on a strict rule: "No Structure, No Signal."
For a Bullish or Bearish divergence to be valid, price must not only diverge from RSI but also physically touch or react to one of four key structural levels:
BB (Bollinger Bands): Rejection due to volatility extension (2.0 StdDev).
KC (Keltner Channels): Rejection due to average range deviation (1.5 ATR).
Pivots (S1/R1): Rejection at standard daily algorithmic levels.
VWAP: Rejection at the institutional average price (Volume Weighted Average Price).
🏷️ Dynamic "Reason" Labels
This is the core feature of this edition. The label on your chart adapts dynamically to show the specific confluence behind the trade.
Examples you will see:
SMART BULL (BB) → The divergence is valid because price hit the Bollinger Band.
SMART BULL (VWAP) → The divergence is valid because price bounced off the VWAP.
SMART BULL (BB VWAP) → High Probability: Price hit the Bollinger Band AND the VWAP simultaneously.
The Logic: The more "Reasons" (acronyms) appear inside the label, the stronger the structural wall, and the higher the probability of a reversal.
🛠️ Settings & Features
🛡️ Smart Filter (Toggle):
ON (Default): Only shows high-quality signals that occur at Support/Resistance zones.
OFF: Shows all raw technical divergences (standard mode).
Alerts Included: Setup custom alerts for "Smart Bull" (Buys) and "Smart Bear" (Sells).
Zero Repainting: Signals are confirmed upon candle close/pivot confirmation.
📋 How to Trade It
Wait for the Label: Do not guess. Wait for the SMART label to appear.
Check the Reason: Look at the text in parenthesis (...).
Single reason (e.g., KC) is a valid setup.
Cluster reasons (e.g., BB S1 VWAP) represent a "Concrete Wall" and are ideal for aggressive entries.
Context: Works best on Intraday timeframes (1m, 5m, 15m) for scalping, and Daily timeframe for Swing Trading bottoms/tops.
Disclaimer: This tool is for educational purposes and technical analysis assistance. Past performance does not guarantee future results. Manage your risk.
Volume Weighted Median Price (VWMP)The volume is indeed crucial for confirming price moves and understanding market conviction. While many traders are familiar with VWAP (Volume Weighted Average Price), this indicator introduces a lesser-known but powerful cousin: the Volume Weighted Median Price (VWMP).
What is VWMP?
Unlike VWAP, which calculates the average price weighted by volume over a period, VWMP identifies the median price level weighted by volume.
Think of it this way: If you line up all the trades within a specific lookback period, sorted by price, and then start accumulating the volume traded at each price level, the VWMP is the price level where 50% of the total volume occurred below it, and 50% occurred above it.
It essentially finds the "middle ground" of trading activity based on where the bulk of the volume actually traded, not just the average price.
Key Difference: VWMP vs. VWAP
VWAP: Volume Weighted Average Price. Sensitive to outliers (single large trades at extreme prices can skew the average).
VWMP: Volume Weighted Median Price. More robust to outliers. It represents the price that splits the period's volume distribution in half.
Because it uses the median, VWMP can sometimes provide a more stable or representative level of the "typical" price where significant volume is changing hands, especially in volatile markets or when large, anomalous trades occur.
How to Interpret and Use VWMP in trading
The VWMP plots as a line on your chart, similar to a moving average or VWAP. Here are a few ways traders might use it:
Dynamic Support and Resistance:
Like VWAP, the VWMP line can act as a dynamic level of interest.
Watch how price interacts with the VWMP. Consistent acceptance above VWMP might suggest bullish control and potential support.
Consistent rejection or acceptance below VWMP might indicate bearish control and potential resistance.
Trend Filter / Confirmation:
Uptrend: Look for price consistently staying above the VWMP line. Pullbacks to the VWMP that hold could offer entry opportunities.
Downtrend: Look for price consistently staying below the VWMP line. Rallies to the VWMP that fail could present shorting opportunities.
Use it to filter trades: Only take long trades if price is above VWMP, and short trades if below.
Mean Reversion Potential (Use with Caution):
When price extends significantly far away from the VWMP, some traders might look for potential reversion back towards this volume-based median level.
Important: This should not be used in isolation. Always look for confirmation from other indicators (like RSI, Stochastics, or candlestick patterns) before trading counter-trend reversions.
Confluence with Other Indicators:
VWMP works best when combined with other analysis tools.
Look for confluence: Does the VWMP align with a key Fibonacci level, a standard moving average, or a prior support/resistance zone? This confluence strengthens the level's potential significance.
Considerations
Lookback Period: The length input is crucial. A shorter period makes VWMP more responsive to recent action; a longer period makes it smoother and reflects longer-term volume distribution. Experiment to find what suits your timeframe and trading style.
Lagging Nature: Like all indicators based on past data, VWMP is inherently lagging. It reflects past volume distribution, not the future.
Market Context: Its effectiveness can vary depending on the market conditions (trending vs. ranging) and the asset being traded.
Danger Signals from The Trading MindwheelThe " Danger Signals " indicator, a collaborative creation from the minds at Amphibian Trading and MARA Wealth, serves as your vigilant lookout in the volatile world of stock trading. Drawing from the wisdom encapsulated in "The Trading Mindwheel" and the successful methodologies of legends like William O'Neil and Mark Minervini, this tool is engineered to safeguard your trading journey.
Core Features:
Real-Time Alerts: Identify critical danger signals as they emerge in the market. Whether it's a single day of heightened risk or a pattern forming, stay informed with specific danger signals and a tally of signals for comprehensive decision-making support. The indicator looks for over 30 different signals ranging from simple closing ranges to more complex signals like blow off action.
Tailored Insights with Portfolio Heat Integration: Pair with the "Portfolio Heat" indicator to customize danger signals based on your current positions, entry points, and stops. This personalized approach ensures that the insights are directly relevant to your trading strategy. Certain signals can have different meanings based on where your trade is at in its lifecycle. Blow off action at the beginning of a trend can be viewed as strength, while after an extended run could signal an opportunity to lock in profits.
Forward-Looking Analysis: Leverage the 'Potential Danger Signals' feature to assess future risks. Enter hypothetical price levels to understand potential market reactions before they unfold, enabling proactive trade management.
The indicator offers two different modes of 'Potential Danger Signals', Worst Case or Immediate. Worst Case allows the user to input any price and see what signals would fire based on price reaching that level, while the Immediate mode looks for potential Danger Signals that could happen on the next bar.
This is achieved by adding and subtracting the average daily range to the current bars close while also forecasting the next values of moving averages, vwaps, risk multiples and the relative strength line to see if a Danger Signal would trigger.
User Customization: Flexibility is at your fingertips with toggle options for each danger signal. Tailor the indicator to match your unique trading style and risk tolerance. No two traders are the same, that is why each signal is able to be turned on or off to match your trading personality.
Versatile Application: Ideal for growth stock traders, momentum swing traders, and adherents of the CANSLIM methodology. Whether you're a novice or a seasoned investor, this tool aligns with strategies influenced by trading giants.
Validation and Utility:
Inspired by the trade management principles of Michael Lamothe, the " Danger Signals " indicator is more than just a tool; it's a reflection of tested strategies that highlight the importance of risk management. Through rigorous validation, including the insights from "The Trading Mindwheel," this indicator helps traders navigate the complexities of the market with an informed, strategic approach.
Whether you're contemplating a new position or evaluating an existing one, the " Danger Signals " indicator is designed to provide the clarity needed to avoid potential pitfalls and capitalize on opportunities with confidence. Embrace a smarter way to trade, where awareness and preparation open the door to success.
Let's dive into each of the components of this indicator.
Volume: Volume refers to the number of shares or contracts traded in a security or an entire market during a given period. It is a measure of the total trading activity and liquidity, indicating the overall interest in a stock or market.
Price Action: the analysis of historical prices to inform trading decisions, without the use of technical indicators. It focuses on the movement of prices to identify patterns, trends, and potential reversal points in the market.
Relative Strength Line: The RS line is a popular tool used to compare the performance of a stock, typically calculated as the ratio of the stock's price to a benchmark index's price. It helps identify outperformers and underperformers relative to the market or a specific sector. The RS value is calculated by dividing the close price of the chosen stock by the close price of the comparative symbol (SPX by default).
Average True Range (ATR): ATR is a market volatility indicator used to show the average range prices swing over a specified period. It is calculated by taking the moving average of the true ranges of a stock for a specific period. The true range for a period is the greatest of the following three values:
The difference between the current high and the current low.
The absolute value of the current high minus the previous close.
The absolute value of the current low minus the previous close.
Average Daily Range (ADR): ADR is a measure used in trading to capture the average range between the high and low prices of an asset over a specified number of past trading days. Unlike the Average True Range (ATR), which accounts for gaps in the price from one day to the next, the Average Daily Range focuses solely on the trading range within each day and averages it out.
Anchored VWAP: AVWAP gives the average price of an asset, weighted by volume, starting from a specific anchor point. This provides traders with a dynamic average price considering both price and volume from a specific start point, offering insights into the market's direction and potential support or resistance levels.
Moving Averages: Moving Averages smooth out price data by creating a constantly updated average price over a specific period of time. It helps traders identify trends by flattening out the fluctuations in price data.
Stochastic: A stochastic oscillator is a momentum indicator used in technical analysis that compares a particular closing price of an asset to a range of its prices over a certain period of time. The theory behind the stochastic oscillator is that in a market trending upwards, prices will tend to close near their high, and in a market trending downwards, prices close near their low.
While each of these components offer unique insights into market behavior, providing sell signals under specific conditions, the power of combining these different signals lies in their ability to confirm each other's signals. This in turn reduces false positives and provides a more reliable basis for trading decisions
These signals can be recognized at any time, however the indicators power is in it's ability to take into account where a trade is in terms of your entry price and stop.
If a trade just started, it hasn’t earned much leeway. Kind of like a new employee that shows up late on the first day of work. It’s less forgivable than say the person who has been there for a while, has done well, is on time, and then one day comes in late.
Contextual Sensitivity:
For instance, a high volume sell-off coupled with a bearish price action pattern significantly strengthens the sell signal. When the price closes below an Anchored VWAP or a critical moving average in this context, it reaffirms the bearish sentiment, suggesting that the momentum is likely to continue downwards.
By considering the relative strength line (RS) alongside volume and price action, the indicator can differentiate between a normal retracement in a strong uptrend and a when a stock starts to become a laggard.
The integration of ATR and ADR provides a dynamic framework that adjusts to the market's volatility. A sudden increase in ATR or a character change detected through comparing short-term and long-term ADR can alert traders to emerging trends or reversals.
The "Danger Signals" indicator exemplifies the power of integrating diverse technical indicators to create a more sophisticated, responsive, and adaptable trading tool. This approach not only amplifies the individual strengths of each indicator but also mitigates their weaknesses.
Portfolio Heat Indicator can be found by clicking on the image below
Danger Signals Included
Price Closes Near Low - Daily Closing Range of 30% or Less
Price Closes Near Weekly Low - Weekly Closing Range of 30% or Less
Price Closes Near Daily Low on Heavy Volume - Daily Closing Range of 30% or Less on Heaviest Volume of the Last 5 Days
Price Closes Near Weekly Low on Heavy Volume - Weekly Closing Range of 30% or Less on Heaviest Volume of the Last 5 Weeks
Price Closes Below Moving Average - Price Closes Below One of 5 Selected Moving Averages
Price Closes Below Swing Low - Price Closes Below Most Recent Swing Low
Price Closes Below 1.5 ATR - Price Closes Below Trailing ATR Stop Based on Highest High of Last 10 Days
Price Closes Below AVWAP - Price Closes Below Selected Anchored VWAP (Anchors include: High of base, Low of base, Highest volume of base, Custom date)
Price Shows Aggressive Selling - Current Bars High is Greater Than Previous Day's High and Closes Near the Lows on Heaviest Volume of the Last 5 Days
Outside Reversal Bar - Price Makes a New High and Closes Near the Lows, Lower Than the Previous Bar's Low
Price Shows Signs of Stalling - Heavy Volume with a Close of Less than 1%
3 Consecutive Days of Lower Lows - 3 Days of Lower Lows
Close Lower than 3 Previous Lows - Close is Less than 3 Previous Lows
Character Change - ADR of Last Shorter Length is Larger than ADR of Longer Length
Fast Stochastic Crosses Below Slow Stochastic - Fast Stochastic Crosses Below Slow Stochastic
Fast & Slow Stochastic Curved Down - Both Stochastic Lines Close Lower than Previous Day for 2 Consecutive Days
Lower Lows & Lower Highs Intraday - Lower High and Lower Low on 30 Minute Timeframe
Moving Average Crossunder - Selected MA Crosses Below Other Selected MA
RS Starts Curving Down - Relative Strength Line Closes Lower than Previous Day for 2 Consecutive Days
RS Turns Negative Short Term - RS Closes Below RS of 7 Days Ago
RS Underperforms Price - Relative Strength Line Not at Highs, While Price Is
Moving Average Begins to Flatten Out - First Day MA Doesn't Close Higher
Price Moves Higher on Lighter Volume - Price Makes a New High on Light Volume and 15 Day Average Volume is Less than 50 Day Average
Price Hits % Target - Price Moves Set % Higher from Entry Price
Price Hits R Multiple - Price hits (Entry - Stop Multiplied by Setting) and Added to Entry
Price Hits Overhead Resistance - Price Crosses a Swing High from a Monthly Timeframe Chart from at Least 1 Year Ago
Price Hits Fib Level - Price Crosses a Fib Extension Drawn From Base High to Low
Price Hits a Psychological Level - Price Crosses a Multiple of 0 or 5
Heavy Volume After Significant Move - Above Average and Heaviest Volume of the Last 5 Days 35 Bars or More from Breakout
Moving Averages Begin to Slope Downward - Moving Averages Fall for 2 Consecutive Days
Blow Off Action - Highest Volume, Largest Spread, Multiple Gaps in a Row 35 Bars or More Post Breakout
Late Buying Frenzy - ANTS 35 Bars or More Post Breakout
Exhaustion Gap - Gap Up 5% or Higher with Price 125% or More Above 200sma
Market State Engine V2# Market State Engine
**Deterministic Confidence-Scoring System for TradingView**
A professional-grade PineScript v5 indicator that scores market conditions from 0-100, helping traders identify high-quality trading opportunities through systematic structure analysis, VWAP positioning, order flow dynamics, and time-based context.
---
## 🎯 Overview
The **Market State Engine** is not a trading bot—it's a **noise-reduction and opportunity-ranking system** designed to filter market conditions and surface only the highest-quality setups.
Instead of blindly taking every signal, this indicator:
- ✅ **Scores** market conditions objectively (0-100 scale)
- ✅ **Filters** out low-probability setups automatically
- ✅ **Classifies** opportunities into A, A+, and A++ grades
- ✅ **Alerts** only on confirmed structure shifts with supporting context
- ✅ **Keeps the human in control** - provides intelligence, not automation
### Philosophy: Reduce Noise. Enforce Discipline. Surface Quality.
---
## 🚀 Key Features
- **Deterministic Scoring** - No black boxes, fully explainable logic
- **Multi-Factor Analysis** - Combines 4 independent market state components
- **Structure-First Approach** - Only alerts on confirmed pivot breaks
- **VWAP Mean Reversion Logic** - Directional filtering based on VWAP zones
- **Order Flow Proxy** - CVD divergence and confirmation detection
- **Session-Aware Scoring** - Prioritizes high-volume New York sessions
- **Alert De-Duplication** - One alert per unique structure shift
- **Zero Repainting** - Uses confirmed pivots only (left=2, right=2)
- **Fully Configurable** - All parameters exposed as inputs
- **Visual Feedback** - VWAP bands, setup labels, and real-time score panel
---
## 📊 Scoring System (0-100)
The Market State Engine evaluates **four independent components**, each contributing up to **25 points** for a maximum total score of **100**.
### 🎯 Component Breakdown
| Component | Max Points | Description |
|-----------|------------|-------------|
| **VWAP Context** | 25 | Measures price deviation from session VWAP |
| **Structure Shift** | 25 | Confirms pivot breakout (HARD GATE) |
| **CVD Alignment** | 25 | Detects order flow divergence/confirmation |
| **Time-of-Day** | 25 | Identifies high-probability trading sessions |
---
### 1️⃣ VWAP Context (Max 25 Points)
**Purpose:** Identifies extreme price deviations from fair value for mean-reversion opportunities.
VWAP (Volume-Weighted Average Price) is calculated session-anchored to New York market time, with standard deviation bands creating zones of opportunity.
#### Band Structure:
- **1st Band**: ±1σ from VWAP (fair value zone)
- **2nd Band**: ±2σ from VWAP (moderate deviation)
- **3rd Band**: ±3σ from VWAP (extreme deviation)
#### Scoring Logic (Exclusive):
```
Price in 3rd VWAP Band (>2σ and ≤3σ) → +25 points
Price in 2nd VWAP Band (>1σ and ≤2σ) → +15 points
Otherwise (inside 1σ or beyond 3σ) → 0 points
```
**Key Insight:** The further price stretches from VWAP, the higher the probability of mean reversion.
---
### 2️⃣ Structure Shift (Max 25 Points) — **HARD GATE**
**Purpose:** Confirms momentum shift through confirmed pivot breakouts.
⚠️ **CRITICAL:** Structure shift is **mandatory**. If no valid structure shift occurs, the **total score becomes 0** regardless of other factors.
#### Detection Method:
Uses TradingView's `ta.pivothigh()` and `ta.pivotlow()` functions with **locked parameters**:
- **Left bars**: 2
- **Right bars**: 2
- **Source**: Configurable (Wick or Body)
- **Break confirmation**: Candle close only
#### Bullish Structure Shift:
- ✅ Prior swing high exists (confirmed pivot)
- ✅ Current candle **closes above** swing high + tick buffer
- ✅ Must occur in VWAP 2nd or 3rd band
- ✅ **VWAP Filter**: Price must be **at or below VWAP** (lower bands)
#### Bearish Structure Shift:
- ✅ Prior swing low exists (confirmed pivot)
- ✅ Current candle **closes below** swing low - tick buffer
- ✅ Must occur in VWAP 2nd or 3rd band
- ✅ **VWAP Filter**: Price must be **at or above VWAP** (upper bands)
#### Scoring:
```
Valid structure shift → +25 points
No structure shift → Total score = 0
```
**Tick Buffer:** Default 5 ticks (configurable) - prevents false breaks from minor price noise.
---
### 3️⃣ CVD Alignment (Max 25 Points)
**Purpose:** Detects institutional order flow through volume delta analysis.
CVD (Cumulative Volume Delta) is a proxy for order flow:
```
Close > Open → +Volume (buying pressure)
Close < Open → -Volume (selling pressure)
```
#### Scoring Logic:
| Condition | Points | Description |
|-----------|--------|-------------|
| **Divergence** | +25 | Price makes higher high + CVD makes lower high (bearish)Price makes lower low + CVD makes higher low (bullish) |
| **Confirmation** | +20 | Price and CVD both make higher highs or lower lows |
| **Neutral** | 0 | No clear divergence or confirmation |
**Lookback Window:** Last 20 bars (configurable) - prevents stale divergences.
**Key Insight:** Divergences suggest weakening momentum, while confirmations validate the trend.
---
### 4️⃣ Time-of-Day Context (Max 25 Points)
**Purpose:** Prioritizes high-volume, high-volatility New York sessions.
#### Scored Sessions (America/New_York timezone):
| Session | Time Range (NY) | Points | Description |
|---------|-----------------|--------|-------------|
| **Pre-Market** | 03:00 - 04:00 | +25 | Early liquidity injection |
| **Market Open** | 09:30 - 11:30 | +25 | Highest volume period |
| **Off-Hours** | All other times | 0 | Lower probability setups |
**Key Insight:** Structure shifts during active sessions have higher follow-through probability.
---
## 🏆 Setup Classification
Setups are graded based on total score thresholds (configurable):
| Grade | Score Range | Typical Components | Quality Level |
|-------|-------------|-------------------|---------------|
| **A++ Setup** | ≥90 | All 4 factors aligned(VWAP 3rd band + Structure + CVD + Session) | Premium - Rare |
| **A+ Setup** | ≥75 | Structure + VWAP + CVD or Session(3 of 4 factors) | High - Select |
| **A Setup** | ≥60 | Structure + VWAP + Session(Minimum viable setup) | Good - Regular |
| **No Grade** | <60 | Insufficient confluence | Filtered out |
**Default Thresholds:**
- A Setup: 60 points
- A+ Setup: 75 points
- A++ Setup: 90 points
---
## 📥 Installation
### Step 1: Download the Indicator
Download the `market_state_engine.pine` file from this repository.
### Step 2: Add to TradingView
1. Open (www.tradingview.com)
2. Open the **Pine Editor** (bottom panel)
3. Click **"New"** → **"Blank indicator"**
4. Delete all default code
5. Paste the contents of `market_state_engine.pine`
6. Click **"Add to Chart"**
### Step 3: Configure for Your Symbol
1. Click the **gear icon** next to the indicator name
2. Adjust **Tick Size** for your instrument:
- ES futures: `0.25`
- NQ futures: `0.25`
- Stocks: `0.01`
3. Save settings
---
## ⚙️ Configuration
### Symbol Settings
| Parameter | Default | Description |
|-----------|---------|-------------|
| **Tick Size** | 0.25 | Minimum price movement for your symbol |
| **Tick Buffer Count** | 5 | Ticks beyond swing for valid break |
### VWAP Settings
| Parameter | Default | Description |
|-----------|---------|-------------|
| **VWAP Band 1 (σ)** | 1.0 | 1st standard deviation multiplier |
| **VWAP Band 2 (σ)** | 2.0 | 2nd standard deviation multiplier |
| **VWAP Band 3 (σ)** | 3.0 | 3rd standard deviation multiplier |
### Session Settings
| Parameter | Default | Description |
|-----------|---------|-------------|
| **Session 1** | 0300-0400 | Pre-market window (NY time) |
| **Session 2** | 0930-1130 | Market open window (NY time) |
### Score Thresholds
| Parameter | Default | Description |
|-----------|---------|-------------|
| **A Setup Threshold** | 60 | Minimum score for A grade |
| **A+ Setup Threshold** | 75 | Minimum score for A+ grade |
| **A++ Setup Threshold** | 90 | Minimum score for A++ grade |
### CVD Settings
| Parameter | Default | Description |
|-----------|---------|-------------|
| **CVD Divergence Lookback** | 20 | Maximum bars for divergence detection |
### Swing Settings
| Parameter | Default | Options | Description |
|-----------|---------|---------|-------------|
| **Swing Detection Method** | Wick | Wick / Body | Use high/low or open/close for pivots |
### Visual Settings
| Parameter | Default | Description |
|-----------|---------|-------------|
| **Show VWAP Bands** | ✅ | Display VWAP and standard deviation bands |
| **Show Setup Labels** | ✅ | Display setup markers on chart |
| **Show Score Panel** | ✅ | Display real-time score breakdown |
---
## 📖 How to Use
### Step 1: Apply to 1-Minute Chart
⚠️ **The indicator is locked to 1-minute timeframe** - do not use on other timeframes.
### Step 2: Understand the Visual Signals
#### Setup Labels
- **Green Triangle (▲)** - Bullish (Long) setup detected
- **Red Triangle (▼)** - Bearish (Short) setup detected
- Label shows **Grade** (A/A+/A++) and **Total Score**
#### VWAP Bands
- **Yellow Line** - Session VWAP (fair value)
- **Blue Bands** - ±1σ (fair value zone)
- **Purple Bands** - ±2σ (moderate deviation)
- **Red Bands** - ±3σ (extreme deviation)
#### Score Panel (Top Right)
Real-time breakdown of all four components:
```
Component Score
VWAP Zone 15/25
Structure 25/25
CVD 20/25
Session 25/25
TOTAL 85/100 (A+)
```
### Step 3: Interpret Signals
#### Valid Long Setup:
✅ Green triangle below candle
✅ Price in **lower VWAP bands** (below VWAP)
✅ Structure shift breaks swing high
✅ Score ≥60
#### Valid Short Setup:
✅ Red triangle above candle
✅ Price in **upper VWAP bands** (above VWAP)
✅ Structure shift breaks swing low
✅ Score ≥60
### Step 4: Set Up Alerts (See Alert Conditions section)
---
## 🚦 Signal Filters (VWAP Zone Logic)
The indicator uses **directional VWAP filtering** to prevent counter-trend signals:
### Long Signals (Green)
**Only allowed when price is AT or BELOW VWAP**
- ✅ Lower 2nd band (-2σ to -1σ)
- ✅ Lower 3rd band (-3σ to -2σ)
- ✅ At VWAP exactly
- ❌ **BLOCKED** in upper bands (above VWAP)
**Logic:** Longs when price is stretched below fair value (mean reversion)
### Short Signals (Red)
**Only allowed when price is AT or ABOVE VWAP**
- ✅ Upper 2nd band (+1σ to +2σ)
- ✅ Upper 3rd band (+2σ to +3σ)
- ✅ At VWAP exactly
- ❌ **BLOCKED** in lower bands (below VWAP)
**Logic:** Shorts when price is stretched above fair value (mean reversion)
---
## 🎨 Visual Elements
### Chart Overlays
| Element | Color | Description |
|---------|-------|-------------|
| **VWAP Line** | Yellow | Session-anchored fair value |
| **±1σ Bands** | Blue | Fair value zone (no score) |
| **±2σ Bands** | Purple | Moderate deviation (15 pts) |
| **±3σ Bands** | Red | Extreme deviation (25 pts) |
| **Swing Highs** | Red ▼ | Confirmed pivot highs |
| **Swing Lows** | Green ▲ | Confirmed pivot lows |
| **Session Background** | Light Green | Active high-value session |
### Setup Labels
**Bullish Setup:**
```
A+
▲ 75
```
Green label below candle, shows grade and score
**Bearish Setup:**
```
A++
▼ 90
```
Red label above candle, shows grade and score
### Score Panel
Real-time table in top-right corner:
- Individual component scores (0-25 each)
- Total score (0-100)
- Current setup grade (A/A+/A++)
- Updates in real-time as market conditions change
---
## 🔔 Alert Conditions
### Setting Up Alerts
#### Method 1: Built-in Alert Conditions
1. Click **"Create Alert"** in TradingView
2. Select **Market State Engine** as condition
3. Choose alert type:
- **Bullish Setup** - Long signals only
- **Bearish Setup** - Short signals only
- **Any Setup** - All signals
4. Set to **"Once Per Bar Close"**
5. Configure notification method (app, email, webhook)
#### Method 2: Custom Alert Message
Alert messages include full breakdown:
```
A+ Setup Detected (Score: 85)
Components: VWAP(25) + Structure(25) + CVD(20) + Time(15)
CVD State: Confirmation
Direction: Long
Timeframe: 1m
```
### Alert Behavior
✅ **One alert per unique pivot break** - no spam
✅ **Fires on candle close only** - no repainting
✅ **Minimum score filter** - only A grade or higher (≥60)
✅ **Direction-specific** - separate bullish/bearish conditions
⚠️ **No cooldown between different pivots** - multiple alerts per session allowed if different swing levels break
---
## 🔧 Technical Details
### Timeframe Lock
- **Required**: 1-minute chart only
- **Reason**: Scoring model calibrated for 1m micro-structure
- **Future**: Multi-timeframe support planned for v2
### Timezone Configuration
- **Hard-coded**: `America/New_York`
- **Session Detection**: Uses TradingView's native session functions
- **Consistency**: All time-based logic uses NY timezone
### Swing Detection Parameters
**Locked to specification:**
- `ta.pivothigh(source, left=2, right=2)`
- `ta.pivotlow(source, left=2, right=2)`
**Implications:**
- Pivots confirmed 2 bars after formation
- No repainting - historical pivots don't move
- 4-bar minimum swing structure (2 left + pivot + 2 right)
### VWAP Calculation
- **Type**: Session-anchored (resets daily)
- **Source**: Typical price `(high + low + close) / 3`
- **Weighting**: Volume-weighted
- **Standard Deviation**: True population standard deviation
### CVD Proxy Formula
```pine
barDelta = close > open ? volume : close < open ? -volume : 0
CVD = cumulative sum of barDelta (session-reset)
```
### Performance Limits
- **Max Labels**: 500 (TradingView limit)
- **Max Bars Back**: 500
- **Memory**: Lightweight - uses only essential variables
---
## 💡 Best Practices
### 1. **Use as a Filter, Not a Strategy**
❌ Don't: Blindly take every signal
✅ Do: Use score as confluence for your existing analysis
### 2. **Higher Grades = Better Probability**
- **A Setups (60-74)**: Regular opportunities, still require discretion
- **A+ Setups (75-89)**: High-quality, multiple factors aligned
- **A++ Setups (90-100)**: Rare premium opportunities, strongest edge
### 3. **Respect the VWAP Zone Filter**
The indicator **automatically blocks**:
- Longs in upper VWAP bands (counter-trend)
- Shorts in lower VWAP bands (counter-trend)
Trust this logic - it enforces mean reversion discipline.
### 4. **Monitor the Score Panel**
Watch which components are scoring to understand **why** a setup formed:
- Missing CVD score? → No order flow confirmation
- Missing Time score? → Outside high-volume sessions
- Low VWAP score? → Weak deviation from fair value
### 5. **Combine with Risk Management**
The indicator provides **opportunity scoring**, not position sizing:
- Use stop losses based on swing structure
- Scale position size with setup grade (larger on A++, smaller on A)
- Set profit targets at VWAP or opposing band
### 6. **Session Awareness**
Prioritize signals during **active sessions**:
- **03:00-04:00 NY**: Pre-market momentum
- **09:30-11:30 NY**: Highest volume, tightest spreads
Off-hours signals (0 time score) are lower probability but still valid if other factors strong.
### 7. **Understand the Hard Gate**
If **no structure shift** occurs:
- Total score = 0
- No alerts fire
- Other components irrelevant
**Why?** Structure shift confirms momentum change - without it, there's no tradable opportunity.
### 8. **Avoid Over-Optimization**
Default settings are well-calibrated:
- Don't chase "perfect" parameters
- Test changes on historical data before live use
- Document any modifications
### 9. **Leverage Alert De-Duplication**
The indicator prevents spam automatically:
- One alert per unique swing break
- New swing levels = new alerts
- No need to manually filter notifications
### 10. **Supplement with Price Action**
Use the indicator alongside:
- Support/resistance levels
- Order flow footprint charts
- Volume profile
- Market internals (breadth, TICK, etc.)
---
## 📚 Example Scenarios
### Example 1: A++ Premium Setup (Score: 95)
```
Price: In lower 3rd VWAP band (-2.8σ) → VWAP: 25 pts
Structure: Close breaks swing high → Structure: 25 pts
CVD: Price LL + CVD HL (bullish div) → CVD: 25 pts
Time: 10:15 AM NY (market open) → Time: 25 pts
Direction: LONG (price below VWAP) → Valid
Grade: A++ (95/100)
```
**Interpretation:** All factors aligned - premium mean-reversion long opportunity.
---
### Example 2: A+ Strong Setup (Score: 80)
```
Price: In upper 2nd VWAP band (+1.5σ) → VWAP: 15 pts
Structure: Close breaks swing low → Structure: 25 pts
CVD: Price HH + CVD LH (bearish div) → CVD: 25 pts
Time: 2:00 PM NY (off-hours) → Time: 0 pts
Direction: SHORT (price above VWAP) → Valid
Grade: A+ (65/100)
```
**Interpretation:** Strong setup despite off-hours, bearish divergence adds confidence.
---
### Example 3: Filtered Setup (Score: 0)
```
Price: In upper 3rd VWAP band (+2.5σ) → VWAP: 25 pts (if allowed)
Structure: Close breaks swing high → Structure: BLOCKED
CVD: Price HH + CVD HH (confirmation) → CVD: 20 pts (if allowed)
Time: 10:00 AM NY → Time: 25 pts (if allowed)
Direction: LONG (price ABOVE VWAP) → ❌ INVALID ZONE
Grade: None (0/100) - NO ALERT
```
**Interpretation:** VWAP filter blocked long signal in upper band - prevents counter-trend trade.
---
## 🛠️ Troubleshooting
### No Signals Appearing
- ✅ Verify you're on **1-minute chart**
- ✅ Check **Tick Size** matches your symbol
- ✅ Ensure **VWAP Bands** are visible
- ✅ Wait for confirmed pivots (requires at least 5 bars of history)
### Alerts Not Firing
- ✅ Confirm alert is set to **"Once Per Bar Close"**
- ✅ Check score threshold (must be ≥60 by default)
- ✅ Verify VWAP zone filter isn't blocking signals
- ✅ Check that structure shift is actually occurring
### Score Always Zero
- ✅ No structure shift detected (hard gate active)
- ✅ Price may not be in valid VWAP zone (2nd or 3rd band)
- ✅ Insufficient swing history (wait for pivots to form)
### Too Many/Too Few Signals
**Too many signals:**
- Increase **A Setup Threshold** (e.g., 70 instead of 60)
- Increase **Tick Buffer Count** (reduces false breaks)
**Too few signals:**
- Decrease **A Setup Threshold** (e.g., 50 instead of 60)
- Decrease **Tick Buffer Count** (more sensitive to breaks)
---
## 📜 License
This indicator is provided under the **Mozilla Public License 2.0**.
---
## 🤝 Credits
Developed as a professional trading tool for systematic opportunity identification.
**Philosophy:** Reduce noise. Enforce discipline. Keep the human in control.
---
## 📞 Support
For questions, issues, or feature requests, please consult:
1. This README documentation
2. The specification document (`pinescript_market_state_engine_spec.docx`)
3. Inline code comments in `market_state_engine.pine`
---
## 🔄 Version History
**v1.0** (Current)
- Initial release
- 4-component scoring model (VWAP + Structure + CVD + Time)
- VWAP zone directional filtering
- Alert de-duplication
- Configurable inputs
- Real-time score panel
- Session-aware logic
---
## 🎓 Understanding the Numbers
### Quick Reference Card
| Score Range | Grade | Quality | Typical Use |
|-------------|-------|---------|-------------|
| 90-100 | A++ | Premium | Highest conviction trades |
| 75-89 | A+ | High | Strong probability setups |
| 60-74 | A | Good | Acceptable with discretion |
| 0-59 | None | Filtered | Skip or wait for confluence |
### Component Contribution Examples
**Minimum A Setup (60 points):**
- Structure (25) + VWAP 3rd band (25) + Time (25) = 75 ✅
**Typical A+ Setup (75 points):**
- Structure (25) + VWAP 2nd band (15) + CVD confirm (20) + Time (25) = 85 ✅
**Maximum A++ Setup (100 points):**
- Structure (25) + VWAP 3rd band (25) + CVD divergence (25) + Time (25) = 100 ✅
---
## 🎯 Final Reminder
**This is NOT a trading bot.**
**This is NOT financial advice.**
**This is a decision-support tool.**
Always:
- ✅ Use proper risk management
- ✅ Understand the logic before trading
- ✅ Backtest on your symbols
- ✅ Keep the human in control
**Happy Trading! 📈**
TRIZONACCI_Mean reversal_signalsMarket State Engine
Deterministic Confidence-Scoring System for TradingView
A professional-grade PineScript v5 indicator that scores market conditions from 0-100, helping traders identify high-quality trading opportunities through systematic structure analysis, VWAP positioning, order flow dynamics, and time-based context.
🎯 Overview
The Market State Engine is not a trading bot—it's a noise-reduction and opportunity-ranking system designed to filter market conditions and surface only the highest-quality setups.
Instead of blindly taking every signal, this indicator:
✅ Scores market conditions objectively (0-100 scale)
✅ Filters out low-probability setups automatically
✅ Classifies opportunities into A, A+, and A++ grades
✅ Alerts only on confirmed structure shifts with supporting context
✅ Keeps the human in control - provides intelligence, not automation
Philosophy: Reduce Noise. Enforce Discipline. Surface Quality.
🚀 Key Features
Deterministic Scoring - No black boxes, fully explainable logic
Multi-Factor Analysis - Combines 4 independent market state components
Structure-First Approach - Only alerts on confirmed pivot breaks
VWAP Mean Reversion Logic - Directional filtering based on VWAP zones
Order Flow Proxy - CVD divergence and confirmation detection
Session-Aware Scoring - Prioritizes high-volume New York sessions
Alert De-Duplication - One alert per unique structure shift
Zero Repainting - Uses confirmed pivots only (left=2, right=2)
Fully Configurable - All parameters exposed as inputs
Visual Feedback - VWAP bands, setup labels, and real-time score panel
📊 Scoring System (0-100)
The Market State Engine evaluates four independent components, each contributing up to 25 points for a maximum total score of 100.
🎯 Component Breakdown
Component Max Points Description
VWAP Context 25 Measures price deviation from session VWAP
Structure Shift 25 Confirms pivot breakout (HARD GATE)
CVD Alignment 25 Detects order flow divergence/confirmation
Time-of-Day 25 Identifies high-probability trading sessions
1️⃣ VWAP Context (Max 25 Points)
Purpose: Identifies extreme price deviations from fair value for mean-reversion opportunities.
VWAP (Volume-Weighted Average Price) is calculated session-anchored to New York market time, with standard deviation bands creating zones of opportunity.
Band Structure:
1st Band: ±1σ from VWAP (fair value zone)
2nd Band: ±2σ from VWAP (moderate deviation)
3rd Band: ±3σ from VWAP (extreme deviation)
Scoring Logic (Exclusive):
Price in 3rd VWAP Band (>2σ and ≤3σ) → +25 points
Price in 2nd VWAP Band (>1σ and ≤2σ) → +15 points
Otherwise (inside 1σ or beyond 3σ) → 0 points
Key Insight: The further price stretches from VWAP, the higher the probability of mean reversion.
2️⃣ Structure Shift (Max 25 Points) — HARD GATE
Purpose: Confirms momentum shift through confirmed pivot breakouts.
⚠️ CRITICAL: Structure shift is mandatory. If no valid structure shift occurs, the total score becomes 0 regardless of other factors.
Detection Method:
Uses TradingView's ta.pivothigh() and ta.pivotlow() functions with locked parameters:
Left bars: 2
Right bars: 2
Source: Configurable (Wick or Body)
Break confirmation: Candle close only
Bullish Structure Shift:
✅ Prior swing high exists (confirmed pivot)
✅ Current candle closes above swing high + tick buffer
✅ Must occur in VWAP 2nd or 3rd band
✅ VWAP Filter: Price must be at or below VWAP (lower bands)
Bearish Structure Shift:
✅ Prior swing low exists (confirmed pivot)
✅ Current candle closes below swing low - tick buffer
✅ Must occur in VWAP 2nd or 3rd band
✅ VWAP Filter: Price must be at or above VWAP (upper bands)
Scoring:
Valid structure shift → +25 points
No structure shift → Total score = 0
Tick Buffer: Default 5 ticks (configurable) - prevents false breaks from minor price noise.
3️⃣ CVD Alignment (Max 25 Points)
Purpose: Detects institutional order flow through volume delta analysis.
CVD (Cumulative Volume Delta) is a proxy for order flow:
Close > Open → +Volume (buying pressure)
Close < Open → -Volume (selling pressure)
Scoring Logic:
Condition Points Description
Divergence +25 Price makes higher high + CVD makes lower high (bearish)
Price makes lower low + CVD makes higher low (bullish)
Confirmation +20 Price and CVD both make higher highs or lower lows
Neutral 0 No clear divergence or confirmation
Lookback Window: Last 20 bars (configurable) - prevents stale divergences.
Key Insight: Divergences suggest weakening momentum, while confirmations validate the trend.
4️⃣ Time-of-Day Context (Max 25 Points)
Purpose: Prioritizes high-volume, high-volatility New York sessions.
Scored Sessions (America/New_York timezone):
Session Time Range (NY) Points Description
Pre-Market 03:00 - 04:00 +25 Early liquidity injection
Market Open 09:30 - 11:30 +25 Highest volume period
Off-Hours All other times 0 Lower probability setups
Key Insight: Structure shifts during active sessions have higher follow-through probability.
🏆 Setup Classification
Setups are graded based on total score thresholds (configurable):
Grade Score Range Typical Components Quality Level
A++ Setup ≥90 All 4 factors aligned
(VWAP 3rd band + Structure + CVD + Session) Premium - Rare
A+ Setup ≥75 Structure + VWAP + CVD or Session
(3 of 4 factors) High - Select
A Setup ≥60 Structure + VWAP + Session
(Minimum viable setup) Good - Regular
No Grade <60 Insufficient confluence Filtered out
Default Thresholds:
A Setup: 60 points
A+ Setup: 75 points
A++ Setup: 90 points
📥 Installation
Step 1: Download the Indicator
Download the market_state_engine.pine file from this repository.
Step 2: Add to TradingView
Open TradingView
Open the Pine Editor (bottom panel)
Click "New" → "Blank indicator"
Delete all default code
Paste the contents of market_state_engine.pine
Click "Add to Chart"
Step 3: Configure for Your Symbol
Click the gear icon next to the indicator name
Adjust Tick Size for your instrument:
ES futures: 0.25
NQ futures: 0.25
Stocks: 0.01
Save settings
⚙️ Configuration
Symbol Settings
Parameter Default Description
Tick Size 0.25 Minimum price movement for your symbol
Tick Buffer Count 5 Ticks beyond swing for valid break
VWAP Settings
Parameter Default Description
VWAP Band 1 (σ) 1.0 1st standard deviation multiplier
VWAP Band 2 (σ) 2.0 2nd standard deviation multiplier
VWAP Band 3 (σ) 3.0 3rd standard deviation multiplier
Session Settings
Parameter Default Description
Session 1 0300-0400 Pre-market window (NY time)
Session 2 0930-1130 Market open window (NY time)
Score Thresholds
Parameter Default Description
A Setup Threshold 60 Minimum score for A grade
A+ Setup Threshold 75 Minimum score for A+ grade
A++ Setup Threshold 90 Minimum score for A++ grade
CVD Settings
Parameter Default Description
CVD Divergence Lookback 20 Maximum bars for divergence detection
Swing Settings
Parameter Default Options Description
Swing Detection Method Wick Wick / Body Use high/low or open/close for pivots
Visual Settings
Parameter Default Description
Show VWAP Bands ✅ Display VWAP and standard deviation bands
Show Setup Labels ✅ Display setup markers on chart
Show Score Panel ✅ Display real-time score breakdown
📖 How to Use
Step 1: Apply to 1-Minute Chart
⚠️ The indicator is locked to 1-minute timeframe - do not use on other timeframes.
Step 2: Understand the Visual Signals
Setup Labels
Green Triangle (▲) - Bullish (Long) setup detected
Red Triangle (▼) - Bearish (Short) setup detected
Label shows Grade (A/A+/A++) and Total Score
VWAP Bands
Yellow Line - Session VWAP (fair value)
Blue Bands - ±1σ (fair value zone)
Purple Bands - ±2σ (moderate deviation)
Red Bands - ±3σ (extreme deviation)
Score Panel (Top Right)
Real-time breakdown of all four components:
Component Score
VWAP Zone 15/25
Structure 25/25
CVD 20/25
Session 25/25
TOTAL 85/100 (A+)
Step 3: Interpret Signals
Valid Long Setup:
✅ Green triangle below candle
✅ Price in lower VWAP bands (below VWAP)
✅ Structure shift breaks swing high
✅ Score ≥60
Valid Short Setup:
✅ Red triangle above candle
✅ Price in upper VWAP bands (above VWAP)
✅ Structure shift breaks swing low
✅ Score ≥60
Step 4: Set Up Alerts (See Alert Conditions section)
🚦 Signal Filters (VWAP Zone Logic)
The indicator uses directional VWAP filtering to prevent counter-trend signals:
Long Signals (Green)
Only allowed when price is AT or BELOW VWAP
✅ Lower 2nd band (-2σ to -1σ)
✅ Lower 3rd band (-3σ to -2σ)
✅ At VWAP exactly
❌ BLOCKED in upper bands (above VWAP)
Logic: Longs when price is stretched below fair value (mean reversion)
Short Signals (Red)
Only allowed when price is AT or ABOVE VWAP
✅ Upper 2nd band (+1σ to +2σ)
✅ Upper 3rd band (+2σ to +3σ)
✅ At VWAP exactly
❌ BLOCKED in lower bands (below VWAP)
Logic: Shorts when price is stretched above fair value (mean reversion)
🎨 Visual Elements
Chart Overlays
Element Color Description
VWAP Line Yellow Session-anchored fair value
±1σ Bands Blue Fair value zone (no score)
±2σ Bands Purple Moderate deviation (15 pts)
±3σ Bands Red Extreme deviation (25 pts)
Swing Highs Red ▼ Confirmed pivot highs
Swing Lows Green ▲ Confirmed pivot lows
Session Background Light Green Active high-value session
Setup Labels
Bullish Setup:
A+
▲ 75
Green label below candle, shows grade and score
Bearish Setup:
A++
▼ 90
Red label above candle, shows grade and score
Score Panel
Real-time table in top-right corner:
Individual component scores (0-25 each)
Total score (0-100)
Current setup grade (A/A+/A++)
Updates in real-time as market conditions change
🔔 Alert Conditions
Setting Up Alerts
Method 1: Built-in Alert Conditions
Click "Create Alert" in TradingView
Select Market State Engine as condition
Choose alert type:
Bullish Setup - Long signals only
Bearish Setup - Short signals only
Any Setup - All signals
Set to "Once Per Bar Close"
Configure notification method (app, email, webhook)
Method 2: Custom Alert Message
Alert messages include full breakdown:
A+ Setup Detected (Score: 85)
Components: VWAP(25) + Structure(25) + CVD(20) + Time(15)
CVD State: Confirmation
Direction: Long
Timeframe: 1m
Alert Behavior
✅ One alert per unique pivot break - no spam
✅ Fires on candle close only - no repainting
✅ Minimum score filter - only A grade or higher (≥60)
✅ Direction-specific - separate bullish/bearish conditions
⚠️ No cooldown between different pivots - multiple alerts per session allowed if different swing levels break
🔧 Technical Details
Timeframe Lock
Required: 1-minute chart only
Reason: Scoring model calibrated for 1m micro-structure
Future: Multi-timeframe support planned for v2
Timezone Configuration
Hard-coded: America/New_York
Session Detection: Uses TradingView's native session functions
Consistency: All time-based logic uses NY timezone
Swing Detection Parameters
Locked to specification:
ta.pivothigh(source, left=2, right=2)
ta.pivotlow(source, left=2, right=2)
Implications:
Pivots confirmed 2 bars after formation
No repainting - historical pivots don't move
4-bar minimum swing structure (2 left + pivot + 2 right)
VWAP Calculation
Type: Session-anchored (resets daily)
Source: Typical price (high + low + close) / 3
Weighting: Volume-weighted
Standard Deviation: True population standard deviation
CVD Proxy Formula
barDelta = close > open ? volume : close < open ? -volume : 0
CVD = cumulative sum of barDelta (session-reset)
Performance Limits
Max Labels: 500 (TradingView limit)
Max Bars Back: 500
Memory: Lightweight - uses only essential variables
💡 Best Practices
1. Use as a Filter, Not a Strategy
❌ Don't: Blindly take every signal
✅ Do: Use score as confluence for your existing analysis
2. Higher Grades = Better Probability
A Setups (60-74): Regular opportunities, still require discretion
A+ Setups (75-89): High-quality, multiple factors aligned
A++ Setups (90-100): Rare premium opportunities, strongest edge
3. Respect the VWAP Zone Filter
The indicator automatically blocks:
Longs in upper VWAP bands (counter-trend)
Shorts in lower VWAP bands (counter-trend)
Trust this logic - it enforces mean reversion discipline.
4. Monitor the Score Panel
Watch which components are scoring to understand why a setup formed:
Missing CVD score? → No order flow confirmation
Missing Time score? → Outside high-volume sessions
Low VWAP score? → Weak deviation from fair value
5. Combine with Risk Management
The indicator provides opportunity scoring, not position sizing:
Use stop losses based on swing structure
Scale position size with setup grade (larger on A++, smaller on A)
Set profit targets at VWAP or opposing band
6. Session Awareness
Prioritize signals during active sessions:
03:00-04:00 NY: Pre-market momentum
09:30-11:30 NY: Highest volume, tightest spreads
Off-hours signals (0 time score) are lower probability but still valid if other factors strong.
7. Understand the Hard Gate
If no structure shift occurs:
Total score = 0
No alerts fire
Other components irrelevant
Why? Structure shift confirms momentum change - without it, there's no tradable opportunity.
8. Avoid Over-Optimization
Default settings are well-calibrated:
Don't chase "perfect" parameters
Test changes on historical data before live use
Document any modifications
9. Leverage Alert De-Duplication
The indicator prevents spam automatically:
One alert per unique swing break
New swing levels = new alerts
No need to manually filter notifications
10. Supplement with Price Action
Use the indicator alongside:
Support/resistance levels
Order flow footprint charts
Volume profile
Market internals (breadth, TICK, etc.)
📚 Example Scenarios
Example 1: A++ Premium Setup (Score: 95)
Price: In lower 3rd VWAP band (-2.8σ) → VWAP: 25 pts
Structure: Close breaks swing high → Structure: 25 pts
CVD: Price LL + CVD HL (bullish div) → CVD: 25 pts
Time: 10:15 AM NY (market open) → Time: 25 pts
Direction: LONG (price below VWAP) → Valid
Grade: A++ (95/100)
Interpretation: All factors aligned - premium mean-reversion long opportunity.
Example 2: A+ Strong Setup (Score: 80)
Price: In upper 2nd VWAP band (+1.5σ) → VWAP: 15 pts
Structure: Close breaks swing low → Structure: 25 pts
CVD: Price HH + CVD LH (bearish div) → CVD: 25 pts
Time: 2:00 PM NY (off-hours) → Time: 0 pts
Direction: SHORT (price above VWAP) → Valid
Grade: A+ (65/100)
Interpretation: Strong setup despite off-hours, bearish divergence adds confidence.
Example 3: Filtered Setup (Score: 0)
Price: In upper 3rd VWAP band (+2.5σ) → VWAP: 25 pts (if allowed)
Structure: Close breaks swing high → Structure: BLOCKED
CVD: Price HH + CVD HH (confirmation) → CVD: 20 pts (if allowed)
Time: 10:00 AM NY → Time: 25 pts (if allowed)
Direction: LONG (price ABOVE VWAP) → ❌ INVALID ZONE
Grade: None (0/100) - NO ALERT
Interpretation: VWAP filter blocked long signal in upper band - prevents counter-trend trade.
🛠️ Troubleshooting
No Signals Appearing
✅ Verify you're on 1-minute chart
✅ Check Tick Size matches your symbol
✅ Ensure VWAP Bands are visible
✅ Wait for confirmed pivots (requires at least 5 bars of history)
Alerts Not Firing
✅ Confirm alert is set to "Once Per Bar Close"
✅ Check score threshold (must be ≥60 by default)
✅ Verify VWAP zone filter isn't blocking signals
✅ Check that structure shift is actually occurring
Score Always Zero
✅ No structure shift detected (hard gate active)
✅ Price may not be in valid VWAP zone (2nd or 3rd band)
✅ Insufficient swing history (wait for pivots to form)
Too Many/Too Few Signals
Too many signals:
Increase A Setup Threshold (e.g., 70 instead of 60)
Increase Tick Buffer Count (reduces false breaks)
Too few signals:
Decrease A Setup Threshold (e.g., 50 instead of 60)
Decrease Tick Buffer Count (more sensitive to breaks)
📜 License
This indicator is provided under the Mozilla Public License 2.0.
🤝 Credits
Developed as a professional trading tool for systematic opportunity identification.
Philosophy: Reduce noise. Enforce discipline. Keep the human in control.
📞 Support
For questions, issues, or feature requests, please consult:
This README documentation
The specification document (pinescript_market_state_engine_spec.docx)
Inline code comments in market_state_engine.pine
🔄 Version History
v1.0 (Current)
Initial release
4-component scoring model (VWAP + Structure + CVD + Time)
VWAP zone directional filtering
Alert de-duplication
Configurable inputs
Real-time score panel
Session-aware logic
🎓 Understanding the Numbers
Quick Reference Card
Score Range Grade Quality Typical Use
90-100 A++ Premium Highest conviction trades
75-89 A+ High Strong probability setups
60-74 A Good Acceptable with discretion
0-59 None Filtered Skip or wait for confluence
Component Contribution Examples
Minimum A Setup (60 points):
Structure (25) + VWAP 3rd band (25) + Time (25) = 75 ✅
Typical A+ Setup (75 points):
Structure (25) + VWAP 2nd band (15) + CVD confirm (20) + Time (25) = 85 ✅
Maximum A++ Setup (100 points):
Structure (25) + VWAP 3rd band (25) + CVD divergence (25) + Time (25) = 100 ✅
🎯 Final Reminder
This is NOT a trading bot.
This is NOT financial advice.
This is a decision-support tool.
Always:
✅ Use proper risk management
✅ Understand the logic before trading
✅ Backtest on your symbols
✅ Keep the human in control
Happy Trading! 📈
ORB Fusion🎯 CORE INNOVATION: INSTITUTIONAL ORB FRAMEWORK WITH FAILED BREAKOUT INTELLIGENCE
ORB Fusion represents a complete institutional-grade Opening Range Breakout system combining classic Market Profile concepts (Initial Balance, day type classification) with modern algorithmic breakout detection, failed breakout reversal logic, and comprehensive statistical tracking. Rather than simply drawing lines at opening range extremes, this system implements the full trading methodology used by professional floor traders and market makers—including the critical concept that failed breakouts are often higher-probability setups than successful breakouts .
The Opening Range Hypothesis:
The first 30-60 minutes of trading establishes the day's value area —the price range where the majority of participants agree on fair value. This range is formed during peak information flow (overnight news digestion, gap reactions, early institutional positioning). Breakouts from this range signal directional conviction; failures to hold breakouts signal trapped participants and create exploitable reversals.
Why Opening Range Matters:
1. Information Aggregation : Opening range reflects overnight news, pre-market sentiment, and early institutional orders. It's the market's initial "consensus" on value.
2. Liquidity Concentration : Stop losses cluster just outside opening range. Breakouts trigger these stops, creating momentum. Failed breakouts trap traders, forcing reversals.
3. Statistical Persistence : Markets exhibit range expansion tendency —when price accepts above/below opening range with volume, it often extends 1.0-2.0x the opening range size before mean reversion.
4. Institutional Behavior : Large players (market makers, institutions) use opening range as reference for the day's trading plan. They fade extremes in rotation days and follow breakouts in trend days.
Historical Context:
Opening Range Breakout methodology originated in commodity futures pits (1970s-80s) where floor traders noticed consistent patterns: the first 30-60 minutes established a "fair value zone," and directional moves occurred when this zone was violated with conviction. J. Peter Steidlmayer formalized this observation in Market Profile theory, introducing the "Initial Balance" concept—the first hour (two 30-minute periods) defining market structure.
📊 OPENING RANGE CONSTRUCTION
Four ORB Timeframe Options:
1. 5-Minute ORB (0930-0935 ET):
Captures immediate market direction during "opening drive"—the explosive first few minutes when overnight orders hit the tape.
Use Case:
• Scalping strategies
• High-frequency breakout trading
• Extremely liquid instruments (ES, NQ, SPY)
Characteristics:
• Very tight range (often 0.2-0.5% of price)
• Early breakouts common (7 of 10 days break within first hour)
• Higher false breakout rate (50-60%)
• Requires sub-minute chart monitoring
Psychology: Captures panic buyers/sellers reacting to overnight news. Range is small because sample size is minimal—only 5 minutes of price discovery. Early breakouts often fail because they're driven by retail FOMO rather than institutional conviction.
2. 15-Minute ORB (0930-0945 ET):
Balances responsiveness with statistical validity. Captures opening drive plus initial reaction to that drive.
Use Case:
• Day trading strategies
• Balanced scalping/swing hybrid
• Most liquid instruments
Characteristics:
• Moderate range (0.4-0.8% of price typically)
• Breakout rate ~60% of days
• False breakout rate ~40-45%
• Good balance of opportunity and reliability
Psychology: Includes opening panic AND the first retest/consolidation. Sophisticated traders (institutions, algos) start expressing directional bias. This is the "Goldilocks" timeframe—not too reactive, not too slow.
3. 30-Minute ORB (0930-1000 ET):
Classic ORB timeframe. Default for most professional implementations.
Use Case:
• Standard intraday trading
• Position sizing for full-day trades
• All liquid instruments (equities, indices, futures)
Characteristics:
• Substantial range (0.6-1.2% of price)
• Breakout rate ~55% of days
• False breakout rate ~35-40%
• Statistical sweet spot for extensions
Psychology: Full opening auction + first institutional repositioning complete. By 10:00 AM ET, headlines are digested, early stops are hit, and "real" directional players reveal themselves. This is when institutional programs typically finish their opening positioning.
Statistical Advantage: 30-minute ORB shows highest correlation with daily range. When price breaks and holds outside 30m ORB, probability of reaching 1.0x extension (doubling the opening range) exceeds 60% historically.
4. 60-Minute ORB (0930-1030 ET) - Initial Balance:
Steidlmayer's "Initial Balance"—the foundation of Market Profile theory.
Use Case:
• Swing trading entries
• Day type classification
• Low-frequency institutional setups
Characteristics:
• Wide range (0.8-1.5% of price)
• Breakout rate ~45% of days
• False breakout rate ~25-30% (lowest)
• Best for trend day identification
Psychology: Full first hour captures A-period (0930-1000) and B-period (1000-1030). By 10:30 AM ET, all early positioning is complete. Market has "voted" on value. Subsequent price action confirms (trend day) or rejects (rotation day) this value assessment.
Initial Balance Theory:
IB represents the market's accepted value area . When price extends significantly beyond IB (>1.5x IB range), it signals a Trend Day —strong directional conviction. When price remains within 1.0x IB, it signals a Rotation Day —mean reversion environment. This classification completely changes trading strategy.
🔬 LTF PRECISION TECHNOLOGY
The Chart Timeframe Problem:
Traditional ORB indicators calculate range using the chart's current timeframe. This creates critical inaccuracies:
Example:
• You're on a 5-minute chart
• ORB period is 30 minutes (0930-1000 ET)
• Indicator sees only 6 bars (30min ÷ 5min/bar = 6 bars)
• If any 5-minute bar has extreme wick, entire ORB is distorted
The Problem Amplifies:
• On 15-minute chart with 30-minute ORB: Only 2 bars sampled
• On 30-minute chart with 30-minute ORB: Only 1 bar sampled
• Opening spike or single large wick defines entire range (invalid)
Solution: Lower Timeframe (LTF) Precision:
ORB Fusion uses `request.security_lower_tf()` to sample 1-minute bars regardless of chart timeframe:
```
For 30-minute ORB on 15-minute chart:
- Traditional method: Uses 2 bars (15min × 2 = 30min)
- LTF Precision: Requests thirty 1-minute bars, calculates true high/low
```
Why This Matters:
Scenario: ES futures, 15-minute chart, 30-minute ORB
• Traditional ORB: High = 5850.00, Low = 5842.00 (range = 8 points)
• LTF Precision ORB: High = 5848.50, Low = 5843.25 (range = 5.25 points)
Difference: 2.75 points distortion from single 15-minute wick hitting 5850.00 at 9:31 AM then immediately reversing. LTF precision filters this out by seeing it was a fleeting wick, not a sustained high.
Impact on Extensions:
With inflated range (8 points vs 5.25 points):
• 1.5x extension projects +12 points instead of +7.875 points
• Difference: 4.125 points (nearly $200 per ES contract)
• Breakout signals trigger late; extension targets unreachable
Implementation:
```pinescript
getLtfHighLow() =>
float ha = request.security_lower_tf(syminfo.tickerid, "1", high)
float la = request.security_lower_tf(syminfo.tickerid, "1", low)
```
Function returns arrays of 1-minute high/low values, then finds true maximum and minimum across all samples.
When LTF Precision Activates:
Only when chart timeframe exceeds ORB session window:
• 5-minute chart + 30-minute ORB: LTF used (chart TF > session bars needed)
• 1-minute chart + 30-minute ORB: LTF not needed (direct sampling sufficient)
Recommendation: Always enable LTF Precision unless you're on 1-minute charts. The computational overhead is negligible, and accuracy improvement is substantial.
⚖️ INITIAL BALANCE (IB) FRAMEWORK
Steidlmayer's Market Profile Innovation:
J. Peter Steidlmayer developed Market Profile in the 1980s for the Chicago Board of Trade. His key insight: market structure is best understood through time-at-price (value area) rather than just price-over-time (traditional charts).
Initial Balance Definition:
IB is the price range established during the first hour of trading, subdivided into:
• A-Period : First 30 minutes (0930-1000 ET for US equities)
• B-Period : Second 30 minutes (1000-1030 ET)
A-Period vs B-Period Comparison:
The relationship between A and B periods forecasts the day:
B-Period Expansion (Bullish):
• B-period high > A-period high
• B-period low ≥ A-period low
• Interpretation: Buyers stepping in after opening assessed
• Implication: Bullish continuation likely
• Strategy: Buy pullbacks to A-period high (now support)
B-Period Expansion (Bearish):
• B-period low < A-period low
• B-period high ≤ A-period high
• Interpretation: Sellers stepping in after opening assessed
• Implication: Bearish continuation likely
• Strategy: Sell rallies to A-period low (now resistance)
B-Period Contraction:
• B-period stays within A-period range
• Interpretation: Market indecisive, digesting A-period information
• Implication: Rotation day likely, stay range-bound
• Strategy: Fade extremes, sell high/buy low within IB
IB Extensions:
Professional traders use IB as a ruler to project price targets:
Extension Levels:
• 0.5x IB : Initial probe outside value (minor target)
• 1.0x IB : Full extension (major target for normal days)
• 1.5x IB : Trend day threshold (classifies as trending)
• 2.0x IB : Strong trend day (rare, ~10-15% of days)
Calculation:
```
IB Range = IB High - IB Low
Bull Extension 1.0x = IB High + (IB Range × 1.0)
Bear Extension 1.0x = IB Low - (IB Range × 1.0)
```
Example:
ES futures:
• IB High: 5850.00
• IB Low: 5842.00
• IB Range: 8.00 points
Extensions:
• 1.0x Bull Target: 5850 + 8 = 5858.00
• 1.5x Bull Target: 5850 + 12 = 5862.00
• 2.0x Bull Target: 5850 + 16 = 5866.00
If price reaches 5862.00 (1.5x), day is classified as Trend Day —strategy shifts from mean reversion to trend following.
📈 DAY TYPE CLASSIFICATION SYSTEM
Four Day Types (Market Profile Framework):
1. TREND DAY:
Definition: Price extends ≥1.5x IB range in one direction and stays there.
Characteristics:
• Opens and never returns to IB
• Persistent directional movement
• Volume increases as day progresses (conviction building)
• News-driven or strong institutional flow
Frequency: ~20-25% of trading days
Trading Strategy:
• DO: Follow the trend, trail stops, let winners run
• DON'T: Fade extremes, take early profits
• Key: Add to position on pullbacks to previous extension level
• Risk: Getting chopped in false trend (see Failed Breakout section)
Example: FOMC decision, payroll report, earnings surprise—anything creating one-sided conviction.
2. NORMAL DAY:
Definition: Price extends 0.5-1.5x IB, tests both sides, returns to IB.
Characteristics:
• Two-sided trading
• Extensions occur but don't persist
• Volume balanced throughout day
• Most common day type
Frequency: ~45-50% of trading days
Trading Strategy:
• DO: Take profits at extension levels, expect reversals
• DON'T: Hold for massive moves
• Key: Treat each extension as a profit-taking opportunity
• Risk: Holding too long when momentum shifts
Example: Typical day with no major catalysts—market balancing supply and demand.
3. ROTATION DAY:
Definition: Price stays within IB all day, rotating between high and low.
Characteristics:
• Never accepts outside IB
• Multiple tests of IB high/low
• Decreasing volume (no conviction)
• Classic range-bound action
Frequency: ~25-30% of trading days
Trading Strategy:
• DO: Fade extremes (sell IB high, buy IB low)
• DON'T: Chase breakouts
• Key: Enter at extremes with tight stops just outside IB
• Risk: Breakout finally occurs after multiple failures
Example: [/b> Pre-holiday trading, summer doldrums, consolidation after big move.
4. DEVELOPING:
Definition: Day type not yet determined (early in session).
Usage: Classification before 12:00 PM ET when IB extension pattern unclear.
ORB Fusion's Classification Algorithm:
```pinescript
if close > ibHigh:
ibExtension = (close - ibHigh) / ibRange
direction = "BULLISH"
else if close < ibLow:
ibExtension = (ibLow - close) / ibRange
direction = "BEARISH"
if ibExtension >= 1.5:
dayType = "TREND DAY"
else if ibExtension >= 0.5:
dayType = "NORMAL DAY"
else if close within IB:
dayType = "ROTATION DAY"
```
Why Classification Matters:
Same setup (bullish ORB breakout) has opposite implications:
• Trend Day : Hold for 2.0x extension, trail stops aggressively
• Normal Day : Take profits at 1.0x extension, watch for reversal
• Rotation Day : Fade the breakout immediately (likely false)
Knowing day type prevents catastrophic errors like fading a trend day or holding through rotation.
🚀 BREAKOUT DETECTION & CONFIRMATION
Three Confirmation Methods:
1. Close Beyond Level (Recommended):
Logic: Candle must close above ORB high (bull) or below ORB low (bear).
Why:
• Filters out wicks (temporary liquidity grabs)
• Ensures sustained acceptance above/below range
• Reduces false breakout rate by ~20-30%
Example:
• ORB High: 5850.00
• Bar high touches 5850.50 (wick above)
• Bar closes at 5848.00 (inside range)
• Result: NO breakout signal
vs.
• Bar high touches 5850.50
• Bar closes at 5851.00 (outside range)
• Result: BREAKOUT signal confirmed
Trade-off: Slightly delayed entry (wait for close) but much higher reliability.
2. Wick Beyond Level:
Logic: [/b> Any touch of ORB high/low triggers breakout.
Why:
• Earliest possible entry
• Captures aggressive momentum moves
Risk:
• High false breakout rate (60-70%)
• Stop runs trigger signals
• Requires very tight stops (difficult to manage)
Use Case: Scalping with 1-2 point profit targets where any penetration = trade.
3. Body Beyond Level:
Logic: [/b> Candle body (close vs open) must be entirely outside range.
Why:
• Strictest confirmation
• Ensures directional conviction (not just momentum)
• Lowest false breakout rate
Example: Trade-off: [/b> Very conservative—misses some valid breakouts but rarely triggers on false ones.
Volume Confirmation Layer:
All confirmation methods can require volume validation:
Volume Multiplier Logic: Rationale: [/b> True breakouts are driven by institutional activity (large size). Volume spike confirms real conviction vs. stop-run manipulation.
Statistical Impact: [/b>
• Breakouts with volume confirmation: ~65% success rate
• Breakouts without volume: ~45% success rate
• Difference: 20 percentage points edge
Implementation Note: [/b>
Volume confirmation adds complexity—you'll miss breakouts that work but lack volume. However, when targeting 1.5x+ extensions (ambitious goals), volume confirmation becomes critical because those moves require sustained institutional participation.
Recommended Settings by Strategy: [/b>
Scalping (1-2 point targets): [/b>
• Method: Close
• Volume: OFF
• Rationale: Quick in/out doesn't need perfection
Intraday Swing (5-10 point targets): [/b>
• Method: Close
• Volume: ON (1.5x multiplier)
• Rationale: Balance reliability and opportunity
Position Trading (full-day holds): [/b>
• Method: Body
• Volume: ON (2.0x multiplier)
• Rationale: Must be certain—large stops require high win rate
🔥 FAILED BREAKOUT SYSTEM
The Core Insight: [/b>
Failed breakouts are often more profitable [/b> than successful breakouts because they create trapped traders with predictable behavior.
Failed Breakout Definition: [/b>
A breakout that:
1. Initially penetrates ORB level with confirmation
2. Attracts participants (volume spike, momentum)
3. Fails to extend (stalls or immediately reverses)
4. Returns inside ORB range within N bars
Psychology of Failure: [/b>
When breakout fails:
• Breakout buyers are trapped [/b>: Bought at ORB high, now underwater
• Early longs reduce: Take profit, fearful of reversal
• Shorts smell blood: See failed breakout as reversal signal
• Result: Cascade of selling as trapped bulls exit + new shorts enter
Mirror image for failed bearish breakouts (trapped shorts cover + new longs enter).
Failure Detection Parameters: [/b>
1. Failure Confirmation Bars (default: 3): [/b>
How many bars after breakout to confirm failure?
Logic: Settings: [/b>
• 2 bars: Aggressive failure detection (more signals, more false failures)
• 3 bars Balanced (default)
• 5-10 bars: Conservative (wait for clear reversal)
Why This Matters:
Too few bars: You call "failed breakout" when price is just consolidating before next leg.
Too many bars: You miss the reversal entry (price already back in range).
2. Failure Buffer (default: 0.1 ATR): [/b>
How far inside ORB must price return to confirm failure?
Formula: Why Buffer Matters: clear rejection [/b> (not just hovering at level).
Settings: [/b>
• 0.0 ATR: No buffer, immediate failure signal
• 0.1 ATR: Small buffer (default) - filters noise
• [b>0.2-0.3 ATR: Large buffer - only dramatic failures count
Example: Reversal Entry System: [/b>
When failure confirmed, system generates complete reversal trade:
For Failed Bull Breakout (Short Reversal): [/b>
Entry: [/b> Current close when failure confirmed
Stop Loss: [/b> Extreme high since breakout + 0.10 ATR padding
Target 1: [/b> ORB High - (ORB Range × 0.5)
Target 2: Target 3: [/b> ORB High - (ORB Range × 1.5)
Example:
• ORB High: 5850, ORB Low: 5842, Range: 8 points
• Breakout to 5853, fails, reverses to 5848 (entry)
• Stop: 5853 + 1 = 5854 (6 point risk)
• T1: 5850 - 4 = 5846 (-2 points, 1:3 R:R)
• T2: 5850 - 8 = 5842 (-6 points, 1:1 R:R)
• T3: 5850 - 12 = 5838 (-10 points, 1.67:1 R:R)
[b>Why These Targets? [/b>
• T1 (0.5x ORB below high): Trapped bulls start panic
• T2 (1.0x ORB = ORB Mid): Major retracement, momentum fully reversed
• T3 (1.5x ORB): Reversal extended, now targeting opposite side
Historical Performance: [/b>
Failed breakout reversals in ORB Fusion's tracking system show:
• Win Rate: 65-75% (significantly higher than initial breakouts)
• Average Winner: 1.2x ORB range
• Average Loser: 0.5x ORB range (protected by stop at extreme)
• Expectancy: Strongly positive even with <70% win rate
Why Failed Breakouts Outperform: [/b>
1. Information Advantage: You now know what price did (failed to extend). Initial breakout trades are speculative; reversal trades are reactive to confirmed failure.
2. Trapped Participant Pressure: Every trapped bull becomes a seller. This creates sustained pressure.
3. Stop Loss Clarity: Extreme high is obvious stop (just beyond recent high). Breakout trades have ambiguous stops (ORB mid? Recent low? Too wide or too tight).
4. Mean Reversion Edge: Failed breakouts return to value (ORB mid). Initial breakouts try to escape value (harder to sustain).
Critical Insight: [/b>
"The best trade is often the one that trapped everyone else."
Failed breakouts create asymmetric opportunity because you're trading against [/b> trapped participants rather than with [/b> them. When you see a failed breakout signal, you're seeing real-time evidence that the market rejected directional conviction—that's exploitable.
📐 FIBONACCI EXTENSION SYSTEM
Six Extension Levels: [/b>
Extensions project how far price will travel after ORB breakout. Based on Fibonacci ratios + empirical market behavior.
1. 1.272x (27.2% Extension): [/b>
Formula: [/b> ORB High/Low + (ORB Range × 0.272)
Psychology: [/b> Initial probe beyond ORB. Early momentum + trapped shorts (on bull side) covering.
Probability of Reach: [/b> ~75-80% after confirmed breakout
Trading: [/b>
• First resistance/support after breakout
• Partial profit target (take 30-50% off)
• Watch for rejection here (could signal failure in progress)
Why 1.272? [/b> Related to harmonic patterns (1.272 is √1.618). Empirically, markets often stall at 25-30% extension before deciding whether to continue or fail.
2. 1.5x (50% Extension):
Formula: [/b> ORB High/Low + (ORB Range × 0.5)
Psychology: [/b> Breakout gaining conviction. Requires sustained buying/selling (not just momentum spike).
Probability of Reach: [/b> ~60-65% after confirmed breakout
Trading: [/b>
• Major partial profit (take 50-70% off)
• Move stops to breakeven
• Trail remaining position
Why 1.5x? [/b> Classic halfway point to 2.0x. Markets often consolidate here before final push. If day type is "Normal," this is likely the high/low for the day.
3. 1.618x (Golden Ratio Extension): [/b>
Formula: [/b> ORB High/Low + (ORB Range × 0.618)
Psychology: [/b> Strong directional day. Institutional conviction + retail FOMO.
Probability of Reach: [/b> ~45-50% after confirmed breakout
Trading: [/b>
• Final partial profit (close 80-90%)
• Trail remainder with wide stop (allow breathing room)
Why 1.618? [/b> Fibonacci golden ratio. Appears consistently in market geometry. When price reaches 1.618x extension, move is "mature" and reversal risk increases.
4. 2.0x (100% Extension): [/b>
Formula: ORB High/Low + (ORB Range × 1.0)
Psychology: [/b> Trend day confirmed. Opening range completely duplicated.
Probability of Reach: [/b> ~30-35% after confirmed breakout
Trading: Why 2.0x? [/b> Psychological level—range doubled. Also corresponds to typical daily ATR in many instruments (opening range ~ 0.5 ATR, daily range ~ 1.0 ATR).
5. 2.618x (Super Extension):
Formula: [/b> ORB High/Low + (ORB Range × 1.618)
Psychology: [/b> Parabolic move. News-driven or squeeze.
Probability of Reach: [/b> ~10-15% after confirmed breakout
[b>Trading: Why 2.618? [/b> Fibonacci ratio (1.618²). Rare to reach—when it does, move is extreme. Often precedes multi-day consolidation or reversal.
6. 3.0x (Extreme Extension): [/b>
Formula: [/b> ORB High/Low + (ORB Range × 2.0)
Psychology: [/b> Market melt-up/crash. Only in extreme events.
[b>Probability of Reach: [/b> <5% after confirmed breakout
Trading: [/b>
• Close immediately if reached
• These are outlier events (black swans, flash crashes, squeeze-outs)
• Holding for more is greed—take windfall profit
Why 3.0x? [/b> Triple opening range. So rare it's statistical noise. When it happens, it's headline news.
Visual Example:
ES futures, ORB 5842-5850 (8 point range), Bullish breakout:
• ORB High : 5850.00 (entry zone)
• 1.272x : 5850 + 2.18 = 5852.18 (first resistance)
• 1.5x : 5850 + 4.00 = 5854.00 (major target)
• 1.618x : 5850 + 4.94 = 5854.94 (strong target)
• 2.0x : 5850 + 8.00 = 5858.00 (trend day)
• 2.618x : 5850 + 12.94 = 5862.94 (extreme)
• 3.0x : 5850 + 16.00 = 5866.00 (parabolic)
Profit-Taking Strategy:
Optimal scaling out at extensions:
• Breakout entry at 5850.50
• 30% off at 1.272x (5852.18) → +1.68 points
• 40% off at 1.5x (5854.00) → +3.50 points
• 20% off at 1.618x (5854.94) → +4.44 points
• 10% off at 2.0x (5858.00) → +7.50 points
[b>Average Exit: Conclusion: [/b> Scaling out at extensions produces 40% higher expectancy than holding for home runs.
📊 GAP ANALYSIS & FILL PSYCHOLOGY
[b>Gap Definition: [/b>
Price discontinuity between previous close and current open:
• Gap Up : Open > Previous Close + noise threshold (0.1 ATR)
• Gap Down : Open < Previous Close - noise threshold
Why Gaps Matter: [/b>
Gaps represent unfilled orders [/b>. When market gaps up, all limit buy orders between yesterday's close and today's open are never filled. Those buyers are "left behind." Psychology: they wait for price to return ("fill the gap") so they can enter. This creates magnetic pull [/b> toward gap level.
Gap Fill Statistics (Empirical): [/b>
• Gaps <0.5% [/b>: 85-90% fill within same day
• Gaps 0.5-1.0% [/b>: 70-75% fill within same day, 90%+ within week
• Gaps >1.0% [/b>: 50-60% fill within same day (major news often prevents fill)
Gap Fill Strategy: [/b>
Setup 1: Gap-and-Go
Gap opens, extends away from gap (doesn't fill).
• ORB confirms direction away from gap
• Trade WITH ORB breakout direction
• Expectation: Gap won't fill today (momentum too strong)
Setup 2: Gap-Fill Fade
Gap opens, but fails to extend. Price drifts back toward gap.
• ORB breakout TOWARD gap (not away)
• Trade toward gap fill level
• Target: Previous close (gap fill complete)
Setup 3: Gap-Fill Rejection
Gap fills (touches previous close) then rejects.
• ORB breakout AWAY from gap after fill
• Trade away from gap direction
• Thesis: Gap filled (orders executed), now resume original direction
[b>Example: Scenario A (Gap-and-Go):
• ORB breaks upward to $454 (away from gap)
• Trade: LONG breakout, expect continued rally
• Gap becomes support ($452)
Scenario B (Gap-Fill):
• ORB breaks downward through $452.50 (toward gap)
• Trade: SHORT toward gap fill at $450.00
• Target: $450.00 (gap filled), close position
Scenario C (Gap-Fill Rejection):
• Price drifts to $450.00 (gap filled) early in session
• ORB establishes $450-$451 after gap fill
• ORB breaks upward to $451.50
• Trade: LONG breakout (gap is filled, now resume rally)
ORB Fusion Integration: [/b>
Dashboard shows:
• Gap type (Up/Down/None)
• Gap size (percentage)
• Gap fill status (Filled ✓ / Open)
This informs setup confidence:
• ORB breakout AWAY from unfilled gap: +10% confidence (gap becomes support/resistance)
• ORB breakout TOWARD unfilled gap: -10% confidence (gap fill may override ORB)
[b>📈 VWAP & INSTITUTIONAL BIAS [/b>
[b>Volume-Weighted Average Price (VWAP): [/b>
Average price weighted by volume at each price level. Represents true "average" cost for the day.
[b>Calculation: Institutional Benchmark [/b>: Institutions (mutual funds, pension funds) use VWAP as performance benchmark. If they buy above VWAP, they underperformed; below VWAP, they outperformed.
2. [b>Algorithmic Target [/b>: Many algos are programmed to buy below VWAP and sell above VWAP to achieve "fair" execution.
3. [b>Support/Resistance [/b>: VWAP acts as dynamic support (price above) or resistance (price below).
[b>VWAP Bands (Standard Deviations): [/b>
• [b>1σ Band [/b>: VWAP ± 1 standard deviation
- Contains ~68% of volume
- Normal trading range
- Bounces common
• [b>2σ Band [/b>: VWAP ± 2 standard deviations
- Contains ~95% of volume
- Extreme extension
- Mean reversion likely
ORB + VWAP Confluence: [/b>
Highest-probability setups occur when ORB and VWAP align:
Bullish Confluence: [/b>
• ORB breakout upward (bullish signal)
• Price above VWAP (institutional buying)
• Confidence boost: +15%
Bearish Confluence: [/b>
• ORB breakout downward (bearish signal)
• Price below VWAP (institutional selling)
• Confidence boost: +15%
[b>Divergence Warning:
• ORB breakout upward BUT price below VWAP
• Conflict: Breakout says "buy," VWAP says "sell"
• Confidence penalty: -10%
• Interpretation: Retail buying but institutions not participating (lower quality breakout)
📊 MOMENTUM CONTEXT SYSTEM
[b>Innovation: Candle Coloring by Position
Rather than fixed support/resistance lines, ORB Fusion colors candles based on their [b>relationship to ORB :
[b>Three Zones: [/b>
1. Inside ORB (Blue Boxes): [/b>
[b>Calculation:
• Darker blue: Near extremes of ORB (potential breakout imminent)
• Lighter blue: Near ORB mid (consolidation)
[b>Trading: [/b> Coiled spring—await breakout.
[b>2. Above ORB (Green Boxes):
[b>Calculation: 3. Below ORB (Red Boxes):
Mirror of above ORB logic.
[b>Special Contexts: [/b>
[b>Breakout Bar (Darkest Green/Red): [/b>
The specific bar where breakout occurs gets maximum color intensity regardless of distance. This highlights the pivotal moment.
[b>Failed Breakout Bar (Orange/Warning): [/b>
When failed breakout is confirmed, that bar gets orange/warning color. Visual alert: "reversal opportunity here."
[b>Near Extension (Cyan/Magenta Tint): [/b>
When price is within 0.5 ATR of an extension level, candle gets tinted cyan (bull) or magenta (bear). Indicates "target approaching—prepare to take profit."
[b>Why Visual Context? [/b>
Traditional indicators show lines. ORB Fusion shows [b>context-aware momentum [/b>. Glance at chart:
• Lots of blue? Consolidation day (fade extremes).
• Progressive green? Trend day (follow).
• Green then orange? Failed breakout (reversal setup).
This visual language communicates market state instantly—no interpretation needed.
🎯 TRADE SETUP GENERATION & GRADING [/b>
[b>Algorithmic Setup Detection: [/b>
ORB Fusion continuously evaluates market state and generates current best trade setup with:
• Action (LONG / SHORT / FADE HIGH / FADE LOW / WAIT)
• Entry price
• Stop loss
• Three targets
• Risk:Reward ratio
• Confidence score (0-100)
• Grade (A+ to D)
[b>Setup Types: [/b>
[b>1. ORB LONG (Bullish Breakout): [/b>
[b>Trigger: [/b>
• Bullish ORB breakout confirmed
• Not failed
[b>Parameters:
• Entry: Current close
• Stop: ORB mid (protects against failure)
• T1: ORB High + 0.5x range (1.5x extension)
• T2: ORB High + 1.0x range (2.0x extension)
• T3: ORB High + 1.618x range (2.618x extension)
[b>Confidence Scoring:
[b>Trigger: [/b>
• Bearish breakout occurred
• Failed (returned inside ORB)
[b>Parameters: [/b>
• Entry: Close when failure confirmed
• Stop: Extreme low since breakout + 0.10 ATR
• T1: ORB Low + 0.5x range
• T2: ORB Low + 1.0x range (ORB mid)
• T3: ORB Low + 1.5x range
[b>Confidence Scoring:
[b>Trigger:
• Inside ORB
• Close > ORB mid (near high)
[b>Parameters: [/b>
• Entry: ORB High (limit order)
• Stop: ORB High + 0.2x range
• T1: ORB Mid
• T2: ORB Low
[b>Confidence Scoring: [/b>
Base: 40 points (lower base—range fading is lower probability than breakout/reversal)
[b>Use Case: [/b> Rotation days. Not recommended on normal/trend days.
[b>6. FADE LOW (Range Trade):
Mirror of FADE HIGH.
[b>7. WAIT:
[b>Trigger: [/b>
• ORB not complete yet OR
• No clear setup (price in no-man's-land)
[b>Action: [/b> Observe, don't trade.
[b>Confidence: [/b> 0 points
[b>Grading System:
```
Confidence → Grade
85-100 → A+
75-84 → A
65-74 → B+
55-64 → B
45-54 → C
0-44 → D
```
[b>Grade Interpretation: [/b>
• [b>A+ / A: High probability setup. Take these trades.
• [b>B+ / B [/b>: Decent setup. Trade if fits system rules.
• [b>C [/b>: Marginal setup. Only if very experienced.
• [b>D [/b>: Poor setup or no setup. Don't trade.
[b>Example Scenario: [/b>
ES futures:
• ORB: 5842-5850 (8 point range)
• Bullish breakout to 5851 confirmed
• Volume: 2.0x average (confirmed)
• VWAP: 5845 (price above VWAP ✓)
• Day type: Developing (too early, no bonus)
• Gap: None
[b>Setup: [/b>
• Action: LONG
• Entry: 5851
• Stop: 5846 (ORB mid, -5 point risk)
• T1: 5854 (+3 points, 1:0.6 R:R)
• T2: 5858 (+7 points, 1:1.4 R:R)
• T3: 5862.94 (+11.94 points, 1:2.4 R:R)
[b>Confidence: LONG with 55% confidence.
Interpretation: Solid setup, not perfect. Trade it if your system allows B-grade signals.
[b>📊 STATISTICS TRACKING & PERFORMANCE ANALYSIS [/b>
[b>Real-Time Performance Metrics: [/b>
ORB Fusion tracks comprehensive statistics over user-defined lookback (default 50 days):
[b>Breakout Performance: [/b>
• [b>Bull Breakouts: [/b> Total count, wins, losses, win rate
• [b>Bear Breakouts: [/b> Total count, wins, losses, win rate
[b>Win Definition: [/b> Breakout reaches ≥1.0x extension (doubles the opening range) before end of day.
[b>Example: [/b>
• ORB: 5842-5850 (8 points)
• Bull breakout at 5851
• Reaches 5858 (1.0x extension) by close
• Result: WIN
[b>Failed Breakout Performance: [/b>
• [b>Total Failed Breakouts [/b>: Count of breakouts that failed
• [b>Reversal Wins [/b>: Count where reversal trade reached target
• [b>Failed Reversal Win Rate [/b>: Wins / Total Failed
[b>Win Definition for Reversals: [/b>
• Failed bull → reversal short reaches ORB mid
• Failed bear → reversal long reaches ORB mid
[b>Extension Tracking: [/b>
• [b>Average Extension Reached [/b>: Mean of maximum extension achieved across all breakout days
• [b>Max Extension Overall [/b>: Largest extension ever achieved in lookback period
[b>Example: 🎨 THREE DISPLAY MODES
[b>Design Philosophy: [/b>
Not all traders need all features. Beginners want simplicity. Professionals want everything. ORB Fusion adapts.
[b>SIMPLE MODE: [/b>
[b>Shows: [/b>
• Primary ORB levels (High, Mid, Low)
• ORB box
• Breakout signals (triangles)
• Failed breakout signals (crosses)
• Basic dashboard (ORB status, breakout status, setup)
• VWAP
[b>Hides: [/b>
• Session ORBs (Asian, London, NY)
• IB levels and extensions
• ORB extensions beyond basic levels
• Gap analysis visuals
• Statistics dashboard
• Momentum candle coloring
• Narrative dashboard
[b>Use Case: [/b>
• Traders who want clean chart
• Focus on core ORB concept only
• Mobile trading (less screen space)
[b>STANDARD MODE:
[b>Shows Everything in Simple Plus: [/b>
• Session ORBs (Asian, London, NY)
• IB levels (high, low, mid)
• IB extensions
• ORB extensions (1.272x, 1.5x, 1.618x, 2.0x)
• Gap analysis and fill targets
• VWAP bands (1σ and 2σ)
• Momentum candle coloring
• Context section in dashboard
• Narrative dashboard
[b>Hides: [/b>
• Advanced extensions (2.618x, 3.0x)
• Detailed statistics dashboard
[b>Use Case: [/b>
• Most traders
• Balance between information and clarity
• Covers 90% of use cases
[b>ADVANCED MODE:
[b>Shows Everything:
• All session ORBs
• All IB levels and extensions
• All ORB extensions (including 2.618x and 3.0x)
• Full gap analysis
• VWAP with both 1σ and 2σ bands
• Momentum candle coloring
• Complete statistics dashboard
• Narrative dashboard
• All context metrics
[b>Use Case: [/b>
• Professional traders
• System developers
• Those who want maximum information density
[b>Switching Modes: [/b>
Single dropdown input: "Display Mode" → Simple / Standard / Advanced
Entire indicator adapts instantly. No need to toggle 20 individual settings.
📖 NARRATIVE DASHBOARD
[b>Innovation: Plain-English Market State [/b>
Most indicators show data. ORB Fusion explains what the data [b>means [/b>.
[b>Narrative Components: [/b>
[b>1. Phase: [/b>
• "📍 Building ORB..." (during ORB session)
• "📊 Trading Phase" (after ORB complete)
• "⏳ Pre-Market" (before ORB session)
[b>2. Status (Current Observation): [/b>
• "⚠️ Failed breakout - reversal likely"
• "🚀 Bullish momentum in play"
• "📉 Bearish momentum in play"
• "⚖️ Consolidating in range"
• "👀 Monitoring for setup"
[b>3. Next Level:
Tells you what to watch for:
• "🎯 1.5x @ 5854.00" (next extension target)
• "Watch ORB levels" (inside range, await breakout)
[b>4. Setup: [/b>
Current trade setup + grade:
• "LONG " (bullish breakout, A-grade)
• "🔥 SHORT REVERSAL " (failed bull breakout, A+-grade)
• "WAIT " (no setup)
[b>5. Reason: [/b>
Why this setup exists:
• "ORB Bullish Breakout"
• "Failed Bear Breakout - High Probability Reversal"
• "Range Fade - Near High"
[b>6. Tip (Market Insight):
Contextual advice:
• "🔥 TREND DAY - Trail stops" (day type is trending)
• "🔄 ROTATION - Fade extremes" (day type is rotating)
• "📊 Gap unfilled - magnet level" (gap creates target)
• "📈 Normal conditions" (no special context)
[b>Example Narrative:
```
📖 ORB Narrative
━━━━━━━━━━━━━━━━
Phase | 📊 Trading Phase
Status | 🚀 Bullish momentum in play
Next | 🎯 1.5x @ 5854.00
📈 Setup | LONG
Reason | ORB Bullish Breakout
💡 Tip | 🔥 TREND DAY - Trail stops
```
[b>Glance Interpretation: [/b>
"We're in trading phase. Bullish breakout happened (momentum in play). Next target is 1.5x extension at 5854. Current setup is LONG with A-grade. It's a trend day, so trail stops (don't take early profits)."
Complete market state communicated in 6 lines. No interpretation needed.
[b>Why This Matters:
Beginner traders struggle with "So what?" question. Indicators show lines and signals, but what does it mean [/b>? Narrative dashboard bridges this gap.
Professional traders benefit too—rapid context assessment during fast-moving markets. No time to analyze; glance at narrative, get action plan.
🔔 INTELLIGENT ALERT SYSTEM
[b>Four Alert Types: [/b>
[b>1. Breakout Alert: [/b>
[b>Trigger: [/b> ORB breakout confirmed (bull or bear)
[b>Message: [/b>
```
🚀 ORB BULLISH BREAKOUT
Price: 5851.00
Volume Confirmed
Grade: A
```
[b>Frequency: [/b> Once per bar (prevents spam)
[b>2. Failed Breakout Alert: [/b>
[b>Trigger: [/b> Breakout fails, reversal setup generated
[b>Message: [/b>
```
🔥 FAILED BULLISH BREAKOUT!
HIGH PROBABILITY SHORT REVERSAL
Entry: 5848.00
Stop: 5854.00
T1: 5846.00
T2: 5842.00
Historical Win Rate: 73%
```
[b>Why Comprehensive? [/b> Failed breakout alerts include complete trade plan. You can execute immediately from alert—no need to check chart.
[b>3. Extension Alert:
[b>Trigger: [/b> Price reaches extension level for first time
[b>Message: [/b>
```
🎯 Bull Extension 1.5x reached @ 5854.00
```
[b>Use: [/b> Profit-taking reminder. When extension hit, consider scaling out.
[b>4. IB Break Alert: [/b>
[b>Trigger: [/b> Price breaks above IB high or below IB low
[b>Message: [/b>
```
📊 IB HIGH BROKEN - Potential Trend Day
```
[b>Use: [/b> Day type classification. IB break suggests trend day developing—adjust strategy to trend-following mode.
[b>Alert Management: [/b>
Each alert type can be enabled/disabled independently. Prevents notification overload.
[b>Cooldown Logic: [/b>
Alerts won't fire if same alert type triggered within last bar. Prevents:
• "Breakout" alert every tick during choppy breakout
• Multiple "extension" alerts if price oscillates at level
Ensures: One clean alert per event.
⚙️ KEY PARAMETERS EXPLAINED
[b>Opening Range Settings: [/b>
• [b>ORB Timeframe [/b> (5/15/30/60 min): Duration of opening range window
- 30 min recommended for most traders
• [b>Use RTH Only [/b> (ON/OFF): Only trade during regular trading hours
- ON recommended (avoids thin overnight markets)
• [b>Use LTF Precision [/b> (ON/OFF): Sample 1-minute bars for accuracy
- ON recommended (critical for charts >1 minute)
• [b>Precision TF [/b> (1/5 min): Timeframe for LTF sampling
- 1 min recommended (most accurate)
[b>Session ORBs: [/b>
• [b>Show Asian/London/NY ORB [/b> (ON/OFF): Display multi-session ranges
- OFF in Simple mode
- ON in Standard/Advanced if trading 24hr markets
• [b>Session Windows [/b>: Time ranges for each session ORB
- Defaults align with major session opens
[b>Initial Balance: [/b>
• [b>Show IB [/b> (ON/OFF): Display Initial Balance levels
- ON recommended for day type classification
• [b>IB Session Window [/b> (0930-1030): First hour of trading
- Default is standard for US equities
• [b>Show IB Extensions [/b> (ON/OFF): Project IB extension targets
- ON recommended (identifies trend days)
• [b>IB Extensions 1-4 [/b> (0.5x, 1.0x, 1.5x, 2.0x): Extension multipliers
- Defaults are Market Profile standard
[b>ORB Extensions: [/b>
• [b>Show Extensions [/b> (ON/OFF): Project ORB extension targets
- ON recommended (defines profit targets)
• [b>Enable Individual Extensions [/b> (1.272x, 1.5x, 1.618x, 2.0x, 2.618x, 3.0x)
- Enable 1.272x, 1.5x, 1.618x, 2.0x minimum
- Disable 2.618x and 3.0x unless trading very volatile instruments
[b>Breakout Detection:
• [b>Confirmation Method [/b> (Close/Wick/Body):
- Close recommended (best balance)
- Wick for scalping
- Body for conservative
• [b>Require Volume Confirmation [/b> (ON/OFF):
- ON recommended (increases reliability)
• [b>Volume Multiplier [/b> (1.0-3.0):
- 1.5x recommended
- Lower for thin instruments
- Higher for heavy volume instruments
[b>Failed Breakout System: [/b>
• [b>Enable Failed Breakouts [/b> (ON/OFF):
- ON strongly recommended (highest edge)
• [b>Bars to Confirm Failure [/b> (2-10):
- 3 bars recommended
- 2 for aggressive (more signals, more false failures)
- 5+ for conservative (fewer signals, higher quality)
• [b>Failure Buffer [/b> (0.0-0.5 ATR):
- 0.1 ATR recommended
- Filters noise during consolidation near ORB level
• [b>Show Reversal Targets [/b> (ON/OFF):
- ON recommended (visualizes trade plan)
• [b>Reversal Target Mults [/b> (0.5x, 1.0x, 1.5x):
- Defaults are tested values
- Adjust based on average daily range
[b>Gap Analysis:
• [b>Show Gap Analysis [/b> (ON/OFF):
- ON if trading instruments that gap frequently
- OFF for 24hr markets (forex, crypto—no gaps)
• [b>Gap Fill Target [/b> (ON/OFF):
- ON to visualize previous close (gap fill level)
[b>VWAP:
• [b>Show VWAP [/b> (ON/OFF):
- ON recommended (key institutional level)
• [b>Show VWAP Bands [/b> (ON/OFF):
- ON in Standard/Advanced
- OFF in Simple
• [b>Band Multipliers (1.0σ, 2.0σ):
- Defaults are standard
- 1σ = normal range, 2σ = extreme
[b>Day Type: [/b>
• [b>Show Day Type Analysis [/b> (ON/OFF):
- ON recommended (critical for strategy adaptation)
• [b>Trend Day Threshold [/b> (1.0-2.5 IB mult):
- 1.5x recommended
- When price extends >1.5x IB, classifies as Trend Day
[b>Enhanced Visuals:
• [b>Show Momentum Candles [/b> (ON/OFF):
- ON for visual context
- OFF if chart gets too colorful
• [b>Show Gradient Zone Fills [/b> (ON/OFF):
- ON for professional look
- OFF for minimalist chart
• [b>Label Display Mode [/b> (All/Adaptive/Minimal):
- Adaptive recommended (shows nearby labels only)
- All for information density
- Minimal for clean chart
• [b>Label Proximity [/b> (1.0-5.0 ATR):
- 3.0 ATR recommended
- Labels beyond this distance are hidden (Adaptive mode)
[b>🎓 PROFESSIONAL USAGE PROTOCOL [/b>
[b>Phase 1: Learning the System (Week 1) [/b>
[b>Goal: [/b> Understand ORB concepts and dashboard interpretation
[b>Setup: [/b>
• Display Mode: STANDARD
• ORB Timeframe: 30 minutes
• Enable ALL features (IB, extensions, failed breakouts, VWAP, gap analysis)
• Enable statistics tracking
[b>Actions: [/b>
• Paper trade ONLY—no real money
• Observe ORB formation every day (9:30-10:00 AM ET for US markets)
• Note when ORB breakouts occur and if they extend
• Note when breakouts fail and reversals happen
• Watch day type classification evolve during session
• Track statistics—which setups are working?
[b>Key Learning: [/b>
• How often do breakouts reach 1.5x extension? (typically 50-60% of confirmed breakouts)
• How often do breakouts fail? (typically 30-40%)
• Which setup grade (A/B/C) actually performs best? (should see A-grade outperforming)
• What day type produces best results? (trend days favor breakouts, rotation days favor fades)
[b>Phase 2: Parameter Optimization (Week 2) [/b>
[b>Goal: [/b> Tune system to your instrument and timeframe
[b>ORB Timeframe Selection:
• Run 5 days with 15-minute ORB
• Run 5 days with 30-minute ORB
• Compare: Which captures better breakouts on your instrument?
• Typically: 30-minute optimal for most, 15-minute for very liquid (ES, SPY)
[b>Volume Confirmation Testing:
• Run 5 days WITH volume confirmation
• Run 5 days WITHOUT volume confirmation
• Compare: Does volume confirmation increase win rate?
• If win rate improves by >5%: Keep volume confirmation ON
• If no improvement: Turn OFF (avoid missing valid breakouts)
[b>Failed Breakout Bars:
[b>Goal: [/b> Develop personal trading rules based on system signals
[b>Setup Selection Rules: [/b>
Define which setups you'll trade:
• [b>Conservative: [/b> Only A+ and A grades
• [b>Balanced: [/b> A+, A, B+ grades
• [b>Aggressive: [/b> All grades B and above
Test each approach for 5-10 trades, compare results.
[b>Position Sizing by Grade: [/b>
Consider risk-weighting by setup quality:
• A+ grade: 100% position size
• A grade: 75% position size
• B+ grade: 50% position size
• B grade: 25% position size
Example: If max risk is $1000/trade:
• A+ setup: Risk $1000
• A setup: Risk $750
• B+ setup: Risk $500
This matches bet sizing to edge.
[b>Day Type Adaptation: [/b>
Create rules for different day types:
Trend Days:
• Take ALL breakout signals (A/B/C grades)
• Hold for 2.0x extension minimum
• Trail stops aggressively (1.0 ATR trail)
• DON'T fade—reversals unlikely
Rotation Days:
• ONLY take failed breakout reversals
• Ignore initial breakout signals (likely to fail)
• Take profits quickly (0.5x extension)
• Focus on fade setups (Fade High/Fade Low)
Normal Days:
• Take A/A+ breakout signals only
• Take ALL failed breakout reversals (high probability)
• Target 1.0-1.5x extensions
• Partial profit-taking at extensions
Time-of-Day Rules: [/b>
Breakouts at different times have different probabilities:
10:00-10:30 AM (Early Breakout):
• ORB just completed
• Fresh breakout
• Probability: Moderate (50-55% reach 1.0x)
• Strategy: Conservative position sizing
10:30-12:00 PM (Mid-Morning):
• Momentum established
• Volume still healthy
• Probability: High (60-65% reach 1.0x)
• Strategy: Standard position sizing
12:00-2:00 PM (Lunch Doldrums):
• Volume dries up
• Whipsaw risk increases
• Probability: Low (40-45% reach 1.0x)
• Strategy: Avoid new entries OR reduce size 50%
2:00-4:00 PM (Afternoon Session):
• Late-day positioning
• EOD squeezes possible
• Probability: Moderate-High (55-60%)
• Strategy: Watch for IB break—if trending all day, follow
[b>Phase 4: Live Micro-Sizing (Month 2) [/b>
[b>Goal: [/b> Validate paper trading results with minimal risk
[b>Setup: [/b>
• 10-20% of intended full position size
• Take ONLY A+ and A grade setups
• Follow stop loss and targets religiously
[b>Execution: [/b>
• Execute from alerts OR from dashboard setup box
• Entry: Close of signal bar OR next bar market order
• Stop: Use exact stop from setup (don't widen)
• Targets: Scale out at T1/T2/T3 as indicated
[b>Tracking: [/b>
• Log every trade: Entry, Exit, Grade, Outcome, Day Type
• Calculate: Win rate, Average R-multiple, Max consecutive losses
• Compare to paper trading results (should be within 15%)
[b>Red Flags: [/b>
• Win rate <45%: System not suitable for this instrument/timeframe
• Major divergence from paper trading: Execution issues (slippage, late entries, emotional exits)
• Max consecutive losses >8: Hitting rough patch OR market regime changed
[b>Phase 5: Scaling Up (Months 3-6)
[b>Goal: [/b> Gradually increase to full position size
[b>Progression: [/b>
• Month 3: 25-40% size (if micro-sizing profitable)
• Month 4: 40-60% size
• Month 5: 60-80% size
• Month 6: 80-100% size
[b>Milestones Required to Scale Up: [/b>
• Minimum 30 trades at current size
• Win rate ≥48%
• Profit factor ≥1.2
• Max drawdown <20%
• Emotional control (no revenge trading, no FOMO)
[b>Advanced Techniques:
[b>Multi-Timeframe ORB: Assumes first 30-60 minutes establish value. Violation: Market opens after major news, price discovery continues for hours (opening range meaningless).
2. [b>Volume Indicates Conviction: ES, NQ, RTY, SPY, QQQ—high liquidity, clean ORB formation, reliable extensions
• [b>Large-Cap Stocks: AAPL, MSFT, TSLA, NVDA (>$5B market cap, >5M daily volume)
• [b>Liquid Futures: CL (crude oil), GC (gold), 6E (EUR/USD), ZB (bonds)—24hr markets benefit from session ORBs
• [b>Major Forex Pairs: [/b> EUR/USD, GBP/USD, USD/JPY—London/NY session ORBs work well
[b>Performs Poorly On: [/b>
• [b>Illiquid Stocks: <$1M daily volume, wide spreads, gappy price action
• [b>Penny Stocks: [/b> Manipulated, pump-and-dump, no real price discovery
• [b>Low-Volume ETFs: Exotic sector ETFs, leveraged products with thin volume
• [b>Crypto on Sketchy Exchanges: Wash trading, spoofing invalidates volume analysis
• [b>Earnings Days: [/b> ORB completes before earnings release, then completely resets (useless)
• Binary Event Days: FDA approvals, court rulings—discontinuous price action
[b>Known Weaknesses: [/b>
• [b>Slow Starts: ORB doesn't complete until 10:00 AM (30-min ORB). Early morning traders have no signals for 30 minutes. Consider using 15-minute ORB if this is problematic.
• [b>Failure Detection Lag: [/b> Failed breakout requires 3+ bars to confirm. By the time system signals reversal, price may have already moved significantly back inside range. Manual traders watching in real-time can enter earlier.
• [b>Extension Overshoot: [/b> System projects extensions mathematically (1.5x, 2.0x, etc.). Actual moves may stop short (1.3x) or overshoot (2.2x). Extensions are targets, not magnets.
• [b>Day Type Misclassification: [/b> Early in session, day type is "Developing." By the time it's classified definitively (often 11:00 AM+), half the day is over. Strategy adjustments happen late.
• [b>Gap Assumptions: [/b> System assumes gaps want to fill. Strong trend days never fill gaps (gap becomes support/resistance forever). Blindly trading toward gaps can backfire on trend days.
• [b>Volume Data Quality: Forex doesn't have centralized volume (uses tick volume as proxy—less reliable). Crypto volume is often fake (wash trading). Volume confirmation less effective on these instruments.
• [b>Multi-Session Complexity: [/b> When using Asian/London/NY ORBs simultaneously, chart becomes cluttered. Requires discipline to focus on relevant session for current time.
[b>Risk Factors: [/b>
• [b>Opening Gaps: Large gaps (>2%) can create distorted ORBs. Opening range might be unusually wide or narrow, making extensions unreliable.
• [b>Low Volatility Environments:[/b> When VIX <12, opening ranges can be tiny (0.2-0.3%). Extensions are equally tiny. Profit targets don't justify commission/slippage.
• [b>High Volatility Environments:[/b> When VIX >30, opening ranges are huge (2-3%+). Extensions project unrealistic targets. Failed breakouts happen faster (volatility whipsaw).
• [b>Algorithm Dominance:[/b> In heavily algorithmic markets (ES during overnight session), ORB levels can be manipulated—algos pin price to ORB high/low intentionally. Breakouts become stop-runs rather than genuine directional moves.
[b>⚠️ RISK DISCLOSURE[/b>
Trading futures, stocks, options, forex, and cryptocurrencies involves substantial risk of loss and is not suitable for all investors. Opening Range Breakout strategies, while based on sound market structure principles, do not guarantee profits and can result in significant losses.
The ORB Fusion indicator implements professional trading concepts including Opening Range theory, Market Profile Initial Balance analysis, Fibonacci extensions, and failed breakout reversal logic. These methodologies have theoretical foundations but past performance—whether backtested or live—is not indicative of future results.
Opening Range theory assumes the first 30-60 minutes of trading establish a meaningful value area and that breakouts from this range signal directional conviction. This assumption may not hold during:
• Major news events (FOMC, NFP, earnings surprises)
• Market structure changes (circuit breakers, trading halts)
• Low liquidity periods (holidays, early closures)
• Algorithmic manipulation or spoofing
Failed breakout detection relies on patterns of trapped participant behavior. While historically these patterns have shown statistical edges, market conditions change. Institutional algorithms, changing market structure, or regime shifts can reduce or eliminate edges that existed historically.
Initial Balance classification (trend day vs rotation day vs normal day) is a heuristic framework, not a deterministic prediction. Day type can change mid-session. Early classification may prove incorrect as the day develops.
Extension projections (1.272x, 1.5x, 1.618x, 2.0x, etc.) are probabilistic targets derived from Fibonacci ratios and empirical market behavior. They are not "support and resistance levels" that price must reach or respect. Markets can stop short of extensions, overshoot them, or ignore them entirely.
Volume confirmation assumes high volume indicates institutional participation and conviction. In algorithmic markets, volume can be artificially high (HFT activity) or artificially low (dark pools, internalization). Volume is a proxy, not a guarantee of conviction.
LTF precision sampling improves ORB accuracy by using 1-minute bars but introduces additional data dependencies. If 1-minute data is unavailable, inaccurate, or delayed, ORB calculations will be incorrect.
The grading system (A+/A/B+/B/C/D) and confidence scores aggregate multiple factors (volume, VWAP, day type, IB expansion, gap context) into a single assessment. This is a mechanical calculation, not artificial intelligence. The system cannot adapt to unprecedented market conditions or events outside its programmed logic.
Real trading involves slippage, commissions, latency, partial fills, and rejected orders not present in indicator calculations. ORB Fusion generates signals at bar close; actual fills occur with delay. Opening range forms during highest volatility (first 30 minutes)—spreads widen, slippage increases. Execution quality significantly impacts realized results.
Statistics tracking (win rates, extension levels reached, day type distribution) is based on historical bars in your lookback window. If lookback is small (<50 bars) or market regime changed, statistics may not represent future probabilities.
Users must independently validate system performance on their specific instruments, timeframes, and broker execution environment. Paper trade extensively (100+ trades minimum) before risking capital. Start with micro position sizing (5-10% of intended size) for 50+ trades to validate execution quality matches expectations.
Never risk more than you can afford to lose completely. Use proper position sizing (0.5-2% risk per trade maximum). Implement stop losses on every single trade without exception. Understand that most retail traders lose money—sophisticated indicators do not change this fundamental reality. They systematize analysis but cannot eliminate risk.
The developer makes no warranties regarding profitability, suitability, accuracy, reliability, or fitness for any purpose. Users assume full responsibility for all trading decisions, parameter selections, risk management, and outcomes.
By using this indicator, you acknowledge that you have read, understood, and accepted these risk disclosures and limitations, and you accept full responsibility for all trading activity and potential losses.
[b>═══════════════════════════════════════════════════════════════════════════════[/b>
[b>CLOSING STATEMENT[/b>
[b>═══════════════════════════════════════════════════════════════════════════════[/b>
Opening Range Breakout is not a trick. It's a framework. The first 30-60 minutes reveal where participants believe value lies. Breakouts signal directional conviction. Failures signal trapped participants. Extensions define profit targets. Day types dictate strategy. Failed breakouts create the highest-probability reversals.
ORB Fusion doesn't predict the future—it identifies [b>structure[/b>, detects [b>breakouts[/b>, recognizes [b>failures[/b>, and generates [b>probabilistic trade plans[/b> with defined risk and reward.
The edge is not in the opening range itself. The edge is in recognizing when the market respects structure (follow breakouts) versus when it violates structure (fade breakouts). The edge is in detecting failures faster than discretionary traders. The edge is in systematic classification that prevents catastrophic errors—like fading a trend day or holding through rotation.
Most indicators draw lines. ORB Fusion implements a complete institutional trading methodology: Opening Range theory, Market Profile classification, failed breakout intelligence, Fibonacci projections, volume confirmation, gap psychology, and real-time performance tracking.
Whether you're a beginner learning market structure or a professional seeking systematic ORB implementation, this system provides the framework.
"The market's first word is its opening range. Everything after is commentary." — ORB Fusion
STAX# STAX - MapleStax Candle by Candle Automation
## Overview
STAX is a trend-following indicator that automates the "MapleStax Candle by Candle (CBC)" methodology for futures and equity trading. This system uses a higher timeframe anchor trend combined with lower timeframe execution filters to identify high-probability pullback entries in the direction of the prevailing trend.
## How It Works
### 1. Anchor Trend Detection (10-Minute CBC Flip)
The core of this system is the CBC (Candle by Candle) flip logic on the anchor timeframe (default: 10 minutes):
- **Bullish Flip**: Occurs when a 10m candle closes ABOVE the high of the previous 10m candle
- **Bearish Flip**: Occurs when a 10m candle closes BELOW the low of the previous 10m candle
- Once a flip occurs, the trend remains in that direction until an opposite flip happens
The anchor trend is calculated using `request.security()` with `lookahead=barmerge.lookahead_off` and indexed historical data ` ` to ensure non-repainting behavior. This means signals will not change or disappear after they appear.
### 2. Execution Filters (Current Timeframe)
On your current chart timeframe (recommended: 3 minutes), the indicator applies two key filters:
**EMA Confirmation**:
- For LONG signals: 9-period EMA must be greater than 20-period EMA
- For SHORT signals: 9-period EMA must be less than 20-period EMA
**VWAP Filter** (Strict or Target mode):
- **Strict Mode** (default): Only shows signals when price is on the correct side of VWAP
- LONG signals only above VWAP
- SHORT signals only below VWAP
- **Target Mode**: Shows all valid signals but uses VWAP as the take profit target when price is on the "wrong" side
### 3. Entry Signal Logic
The indicator looks for pullback entries:
- **BUY Signal**: 10m trend is Bullish + EMA 9 > 20 + Current 3m candle is RED (close < open)
- Logic: Wait for a red pullback candle in a bullish trend with bullish EMA alignment
- **SELL Signal**: 10m trend is Bearish + EMA 9 < 20 + Current 3m candle is GREEN (close > open)
- Logic: Wait for a green retracement candle in a bearish trend with bearish EMA alignment
This pullback logic helps you enter after a brief counter-trend move, improving risk/reward compared to chasing breakouts.
### 4. Risk Management
**Stop Loss**: Automatically set at the previous 10-minute candle's low (for longs) or high (for shorts). This represents the last swing point that would invalidate the trend structure.
**Take Profit**:
- When aligned with VWAP: Fixed tick-based target (default: 20 ticks, adjustable)
- When counter to VWAP: Target is VWAP itself, providing a logical profit target
The indicator displays TP and SL levels visually and alerts when they are hit.
### 5. Signal Management
To prevent over-trading, the indicator includes a **cooldown period** (default: 10 bars minimum between signals). This stops signal spam in choppy conditions and forces you to wait for the market to develop before taking another trade.
### 6. Time Session Filters
Two separate trading sessions can be configured with 12-hour clock inputs:
- **Session 1**: Default 9:30 AM - 4:00 PM (New York regular hours)
- **Session 2**: Optional second session for extended hours or different time zones
Signals only appear during enabled sessions, helping you trade during liquid market hours.
## What Makes This Original
This indicator automates a specific methodology (MapleStax CBC) that combines multiple proven concepts:
1. Higher timeframe trend structure (CBC flip logic)
2. Lower timeframe execution timing (EMA filters)
3. Pullback entry strategy (counter-colored candles)
4. Volume-based target selection (VWAP integration)
5. Swing-based stop placement (previous anchor swing points)
The combination of these elements into an automated system with visual feedback and alert functionality is what provides value beyond using these indicators separately.
## How to Use
1. **Choose Your Timeframes**:
- Anchor timeframe: 10 minutes (adjustable) for trend direction
- Execution timeframe: 3-5 minutes recommended for entries
2. **Select VWAP Mode**:
- **Strict Mode**: More conservative, only trades with VWAP bias
- **Target Mode**: More aggressive, uses VWAP as profit target
3. **Configure Sessions**: Enable Session 1 and optionally Session 2 to match your trading hours
4. **Set Risk Parameters**: Adjust take profit ticks based on your instrument and risk tolerance
5. **Watch for Signals**:
- Green "BUY" label below bars = Long entry
- Red "SELL" label above bars = Short entry
- Dashed red line = Stop loss level
- Green "TP ✓" or Red "SL ✗" labels show exit points
6. **Monitor the Status Table**: The table in the top-right shows:
- Current 10m trend direction
- EMA alignment status
- VWAP position
- Active session status
- Current signal state
- Active trade information
7. **Set Alerts**: Use TradingView's alert system with the built-in alert conditions:
- BUY Signal
- SELL Signal
- Take Profit Hit
- Stop Loss Hit
## Best Practices
- **Recommended Timeframes**: 3m execution chart with 10m anchor works well for active trading
- **Instrument Selection**: Works best on liquid futures contracts (ES, NQ, CL, etc.) and major forex pairs
- **Session Trading**: Enable Session 1 for New York hours; avoid low-volume periods
- **Backtest First**: Always backtest the settings on your specific instrument before live trading
- **Use Realistic Parameters**: Default 20-tick TP is conservative; adjust based on instrument volatility
## Limitations and Warnings
**This indicator does NOT**:
- Guarantee profitable trades (past performance does not indicate future results)
- Account for slippage, commissions, or real-world execution challenges
- Work equally well in all market conditions (performs poorly in low-volume, range-bound markets)
- Replace proper risk management and position sizing
- Provide financial advice
**Repainting**: This indicator is designed to be non-repainting. Signals use indexed historical data from the anchor timeframe, meaning they will not change or disappear after they appear. However, the current bar's status will update in real-time until it closes.
**Market Conditions**: This trend-following pullback system performs best in trending markets with clear directional bias. In choppy, range-bound conditions, expect more false signals despite the cooldown filter.
**Stop Loss Execution**: The stop loss levels shown are theoretical. In fast-moving markets, actual fills may occur at worse prices due to slippage.
## Input Parameters
**Anchor Settings**:
- Anchor Timeframe: Higher timeframe for trend detection (default: 10 minutes)
**EMA Settings**:
- Fast EMA: Short-period EMA for execution bias (default: 9)
- Slow EMA: Long-period EMA for execution bias (default: 20)
**VWAP Settings**:
- Strict VWAP Filter: Toggle between strict filtering and target mode
**Signal Management**:
- Min Bars Between Signals: Cooldown period to prevent spam (default: 10 bars)
**Time Filters**:
- Session 1 & 2: Configure up to two trading sessions with start/end times in 12-hour format
**Risk Management**:
- Take Profit (Ticks): Fixed tick target when aligned with VWAP (default: 20)
**Visual Settings**:
- Show Trend Background: Background color based on 10m trend
- Show Stop Loss Lines: Display SL levels on chart
- Show EMAs: Display 9/20 EMAs on chart
- Show VWAP: Display daily VWAP on chart
## Technical Notes
- Uses Pine Script v5
- Non-repainting implementation via `request.security()` with `lookahead_off` and indexed data
- Suitable for alerts and automated trading integration
- Maximum 50 labels and 50 lines to maintain performance
- Status table updates on each bar close
## Credits
This indicator automates the MapleStax Candle by Candle methodology. The CBC flip logic and pullback entry concept are part of the MapleStax trading education system.
---
**Disclaimer**: This indicator is for educational and informational purposes only. It is not financial advice. Trading futures, forex, and equities carries substantial risk of loss. Past performance is not indicative of future results. Always trade with risk capital you can afford to lose and use proper position sizing.
AMT Structure: 80% Traverse, PD Levels & nPOCsHere is a clean, professional description formatted for the TradingView description box. It highlights the methodology (AMT/80% Rule), the specific features, and the credits.
Title: AMT Structure: 80% Traverse, PD Levels & nPOCs
Description:
This indicator is a comprehensive toolkit designed for futures traders utilizing Auction Market Theory (AMT) and Volume Profile strategies. It consolidates multiple scripts into a single, unified overlay to declutter your chart while providing essential structural references for the 80% Traverse setup, intraday context, and longer-term auction targets.
Key Features:
1. 80% Rule / Traverse Setup (Chart Champions Logic)
Automated RTH Open Detection: Hardcoded to the 08:30 AM CT Open to ensure accuracy for US Futures (ES/NQ) regardless of your chart's timezone settings.
Value Area Logic: Automatically calculates the Previous Day's Value Area High (VAH), Value Area Low (VAL), and Point of Control (POC).
Setup Detection: If the market opens outside of the previous day's value, the script highlights the Value Area in color (default: Purple), signaling that an 80% traverse (filling the value area) is structurally possible if price re-enters value.
Background Fill: Optional shading between VAH and VAL to clearly visualize the "playing field" for the traverse.
2. Auction Market Theory (AMT) Premarket Levels
Overnight High/Low: Automatically captures the highest and lowest prices traded during the overnight session (17:00 - 08:30 CT).
Breakout Alerts: Includes logic to detect and alert when these overnight levels are broken during the RTH session.
Auto-Cleanup: Lines can be set to auto-delete after a specified time (default: 60 mins into the session) to keep the chart clean after the Initial Balance (IB) period.
3. Structural Reference Levels
Previous Day Levels: Plots Previous Day High, Low, and Equilibrium (Midpoint) as standard reference lines.
Initial Balance (IB): Option to display the First Hour High and Low (08:30 - 09:30 CT) to assess day type (Neutral, Trend, Normal Variation, etc.).
RTH VWAP: An anchored VWAP that resets specifically at the RTH Open (08:30 CT), distinct from the standard 24-hour VWAP.
4. Naked Points of Control (nPOCs)
Multi-Timeframe Tracking: Tracks and plots Naked POCs for Daily, Weekly, and Monthly profiles.
Auto-Cleanup: Lines automatically delete themselves the moment price touches them, ensuring you only see untested levels.
Customization: Toggle each timeframe on/off individually.
Settings & Customization:
Global Offset: Move all text labels to the right with a single setting to prevent price action from obscuring text.
8:30 Open Offset: Independent offset for the Open label to distinguish it from other opening references.
Smart Coloring: Text labels automatically match their corresponding line colors for easy identification.
Modular Toggles: Every section (AMT, VWAP, PD Levels, CCV, nPOCs) can be turned on or off individually to suit your specific trading plan.
Usage: This tool is specifically tuned for ES and NQ futures trading but can be adapted for other instruments. It replaces the need for separate indicators for Overnight Highs/Lows, Previous Day Levels, and Volume Profile targeting.


