VWAP ATRATR Trailing stoploss with VWAP for confirmation and entry/exit points VWAP resets on ATR crossอินดิเคเตอร์ Pine Script®โดย dysrupt11238
Chanh: VWAPVWAP session, week, month, quarter, year Enjoy! Chanhอินดิเคเตอร์ Pine Script®โดย chanhvu6
VWAP Enhanced (Visual Feedback)This is the standard Volume-Weighted Average Price (VWAP) indicator, with the addition of an adjustable anchored time point. This modification aligns with the objective of analyzing price action relative to a specific subsequent event.อินดิเคเตอร์ Pine Script®โดย cinderrazor27
NY VWAP 2std to 3std Probabilities + Exit ZonesHow it works: Time buckets Early: 10:30 – 12:00 Mid: 12:00 – 14:00 Late: 14:00 – 16:00 Bands 2σ band (s2up / s2dn) → this is where the “potential breakout” starts. 3σ band (s3up / s3dn) → this is the “target” for the 2→3σ move. Counting logic If during a given bucket, the price touches the 2σ band, it counts as a 2σ hit. If after that, in the same bucket, the price also touches the 3σ band, it counts as a 3σ hit. Probability calculation \text{Probability 2→3σ} = \frac{\text{# of 3σ hits}}{\text{# of 2σ hits}} \times 100 For example, if in the late session the lower 2σ band is hit 10 times, and of those 10 times, 6 eventually hit the lower 3σ band, the script will show 60%. Labels / lines On the chart, Upper/Lower 2→3σ probabilities are displayed per bucket. So yes: “Late Lower 2σ → 3σ: 60%” means: if price touches the lower 2σ band in the late session, historically, 60% of those touches continued to the 3σ band. ⚠ Important caveats: These are historical probabilities, not predictions. Small sample sizes in a bucket can make percentages unstable early in the day. The script only counts session NY bars (0930–1600) and ignores pre-10:30 hits to reduce opening volatility noise.อินดิเคเตอร์ Pine Script®โดย seanhillis972
VWAP Histogram with EMAsBased on VWAP and Moving Averages. Bias turns +ve if dynamic colour of the moving averages turns green. All moving avaerages are customisable. อินดิเคเตอร์ Pine Script®โดย ptyhll14
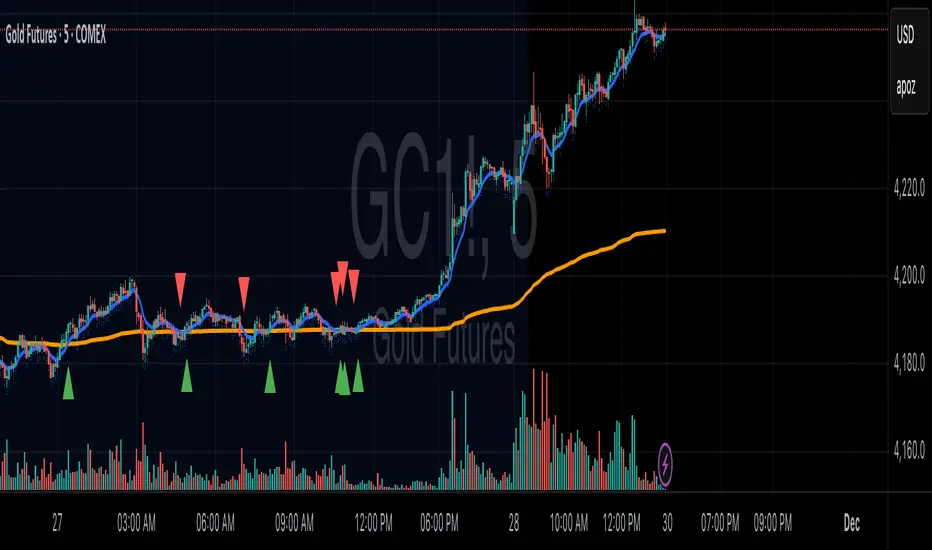
VWAP + EMA9 With SignalsThis script is for scalping on the 5 minute timeframe. It contains signals that indicate intersection of VWAP by the EMA9. It contains Buy signals when a candle closes above both lines indicating a quick continuation of a long position (quick scalp) as well as Sell signals when a candle closes below both lines indicating a quick continuation of a short position (quick scalp). Please note that i do not recommend entries at Buy and Sell signals during Accumulation/Consolidation. Positions should be taken with volume.อินดิเคเตอร์ Pine Script®โดย tlc_futures_trader2424 1.9 K
VWAP & EMA9 Cross AlertAlerts the user when VWAP and EMA 9 cross. It gives a general direction of the market to help make decisions. อินดิเคเตอร์ Pine Script®โดย maltrades232
VWAP & EMA9 Cross AlertAlerts when EMA9 and VWAP Cross. This provides an indicator of general market direction based on these 2 indicators. อินดิเคเตอร์ Pine Script®โดย maltrades237
vwap por colorMuestra distinto color cuando el precio esta arriba o abajo del vwapอินดิเคเตอร์ Pine Script®โดย AlanBartonRevival27
VWAP (SIYL) Stdev Bands v2v2 indicator to allow for reversion-to-mean trading via the Stay In Your Lane approach. อินดิเคเตอร์ Pine Script®โดย jmaybe39
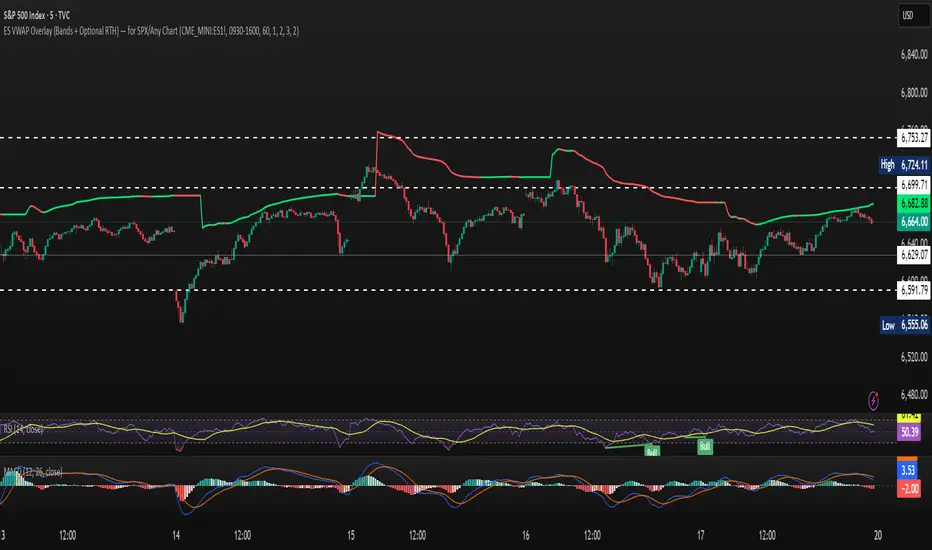
ES VWAP Overlay for SPX VWAP indicator for SPX. Since SPX does not have volume (index) it's using /es to mimic SPX volume. I find it good for day tradingอินดิเคเตอร์ Pine Script®โดย mmelnikovที่อัปเดต: 11
Auto AVWAP (Anchored-VWAP) with Breakout Screener_v2Updated indicator for AWAP breakout. The indicator identified the candle that breaks out of AVWAPอินดิเคเตอร์ Pine Script®โดย manoharvs29
Volume Weighted Average Price - CoinruleVWAP with additional Anchor Periods as supported on Coinrule.อินดิเคเตอร์ Pine Script®โดย Coinruleที่อัปเดต: 82
VWAP + Multi EMAIn this script you will get VWAP band with multiple exponential moving average.อินดิเคเตอร์ Pine Script®โดย dctiitk11128
Anchored VWAP ClickIt calculates AVWAP set from a mouse click on a chart instead of having to edit a popup box, manually transferring date and time from the chart. It's the Oct 2021 sample script from Tradingview to demonstrate their new chart interactive capabilities of Pine script. www.tradingview.com I take no credit for this, just noticed it wasn't in the Public Library. This ability to accept OnMouse positional data from the chart, into an indicator has been needed in TV for a long time. Glad to see they continue to grow the capabilities. อินดิเคเตอร์ Pine Script®โดย claypuzzle99337
Auto Anchored Volume Weighted Average Price - Custom AVWAP Based on Brian Shannon's AVWAP - This indicator anchors vwap to the highest high, lowest low and highest volume bar of a user defined lookback period. In the chart example above on AVAX, the lookback period is set to 90 days - The blue line depicts AVWAP from the highest bar in in the last 90 dats - The purple Line is AVWAP from the lowest bar in the last 90 days - The golden line is AVWAP from the highest volume bar in the last 90 Days These levels act as a price magnet and strong levels of support and resistance. I use them to identify chart locations for where I want to do business and look for trade setups. Unlike moving averages, AVWAP will maintain it's chart position no matter the chart resolution. One way to take advantage of this is to wait for price to get to one of these levels, go to lower timeframes and find low risk setups based on your trading strategy. You can customise the look and feel and which anchors you want displayed. You can use multiple instances with varying lookback periods to display shorter and longer term levels simultaneously อินดิเคเตอร์ Pine Script®โดย elScipio1515797
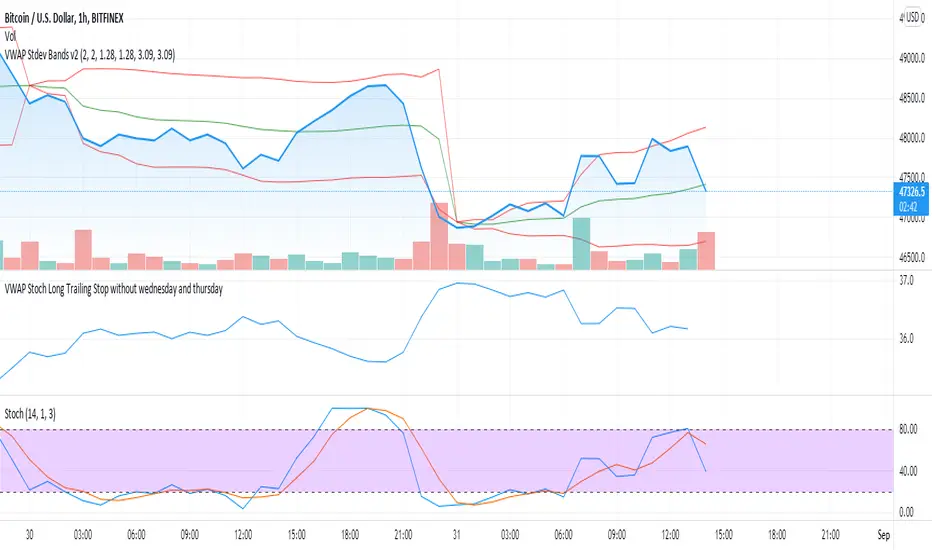
VWAP Stoch Long Trailing Stop without wednesday and thursdaySimple trading strategy based on VWAP and Stochastic indicators and a 3% trailing stop. After backtesting, wednesdays and thursdays seemed to be bad entry days so they are blacklisted.กลยุทธ์ Pine Script®โดย Drflexfunk83
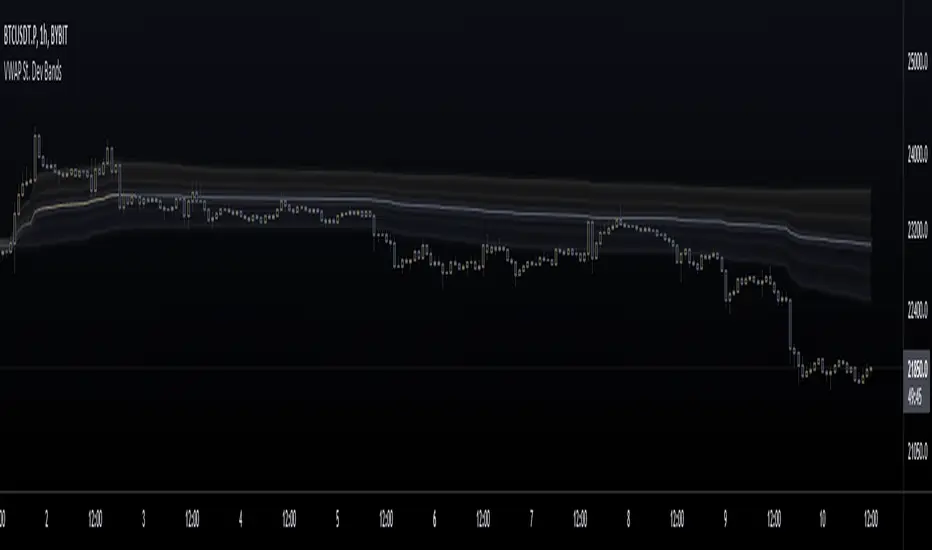
VWAP St. Dev BandsThis indicator allows you to add up to 3 volatility bands to VWAP based on its Standard Deviation. Best use is for intraday but you can choose higher timeframes too. For day trading a band of 3 standard deviations usually works well as an overbought/oversold region, allowing for mean reversion trading, but you are free to come up with your own strategies. Enjoy! อินดิเคเตอร์ Pine Script®โดย FractalTrade_ที่อัปเดต: 33335
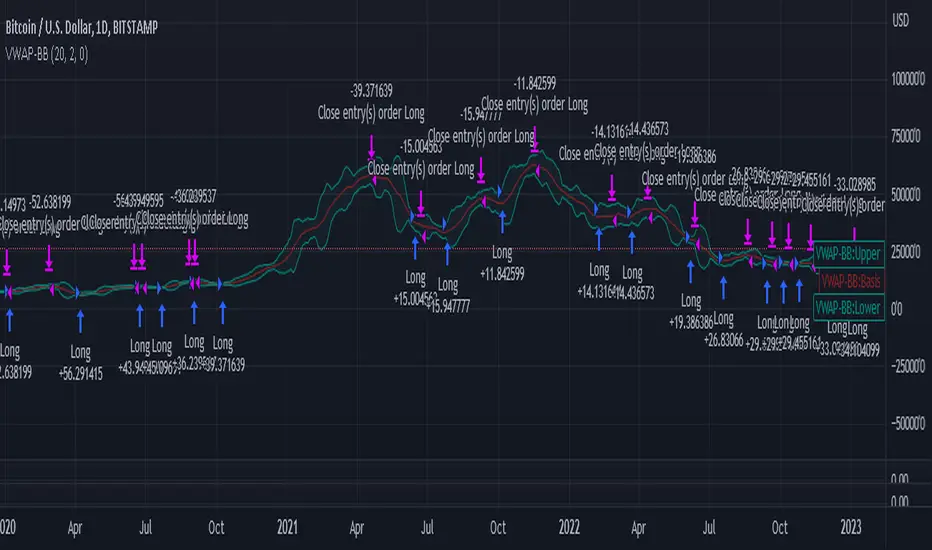
VWAP-Bollinger BandsThis script uses Bollinger bands but with a VWAP as the source, it uses the high crossing the upper band as a buy signal and a low crossing the lower band as a sell signal Its default settings are for a day chart - Crypto 30 periods, forex 24 periods and stocks 20 periods, which basically line up with a month per asset class ive seen good results in crypto and stocks, settings used between1% and 10% equity per trade with a 0.1% fee which lines up with Binance fee structure and $25 per trade which lines up with Commsec on the ASXกลยุทธ์ Pine Script®โดย Wayne-oที่อัปเดต: 242
Vwap Ribbon - JDThis indicator displays a custom timeframe VWAP line together with several multiples of this timeframe After a large price move, the price often tends to return to one of these multiples JD. #nottradingadvice #DYORอินดิเคเตอร์ Pine Script®โดย Duyck77328
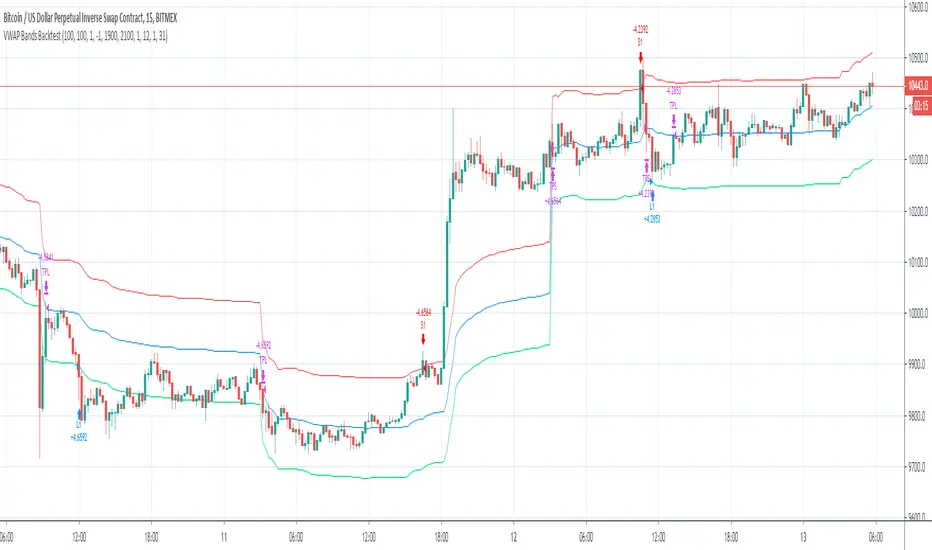
VWAP Bands BacktestThis is a backtest for evaluating the profitability of a vwap offsets strategy over time. I took part of the code to create the script from Noro So there is a link for its code กลยุทธ์ Pine Script®โดย PyBotShop33147
VWAP Pivots ( Classic / Camarilla / Woodie ) Pivot points based on VWAP values instead of OHLCอินดิเคเตอร์ Pine Script®โดย rumpypumpydumpyที่อัปเดต: 1414 1 K
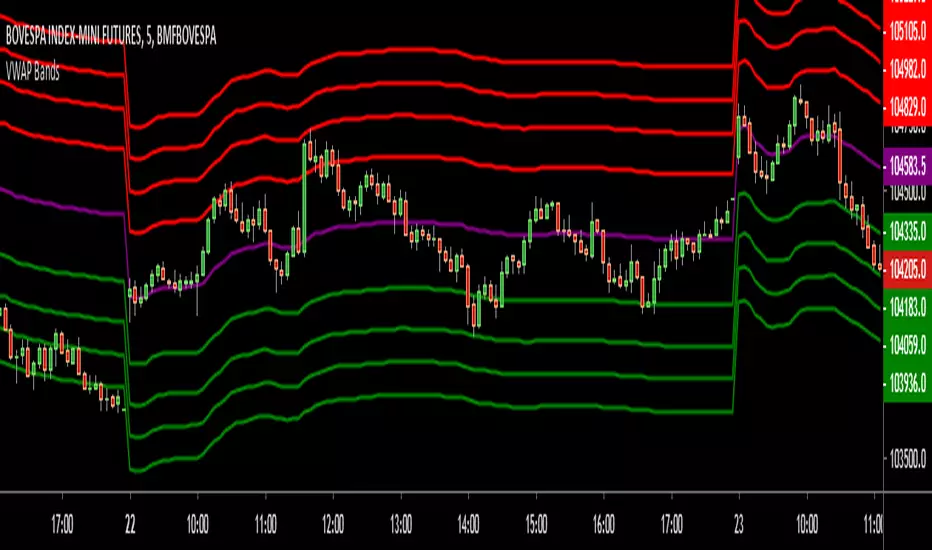
VWAP BandsThis indicator plots distant VWAP lines that serve as support and resistance. You can add more lines from the script. Good trades!อินดิเคเตอร์ Pine Script®โดย felipekr55346