AVWAP Band✨ AVWAP Band by Mars ✨
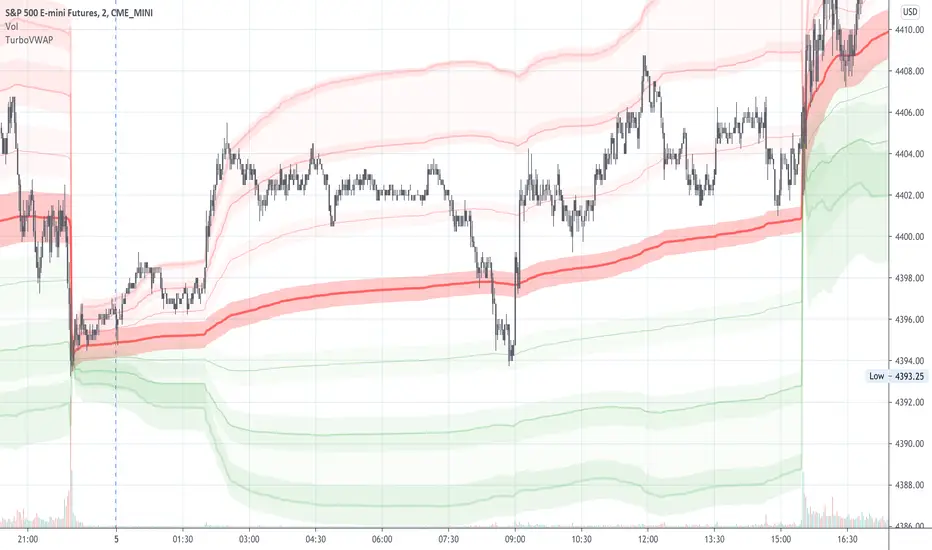
The AVWAP Band indicator eliminates the guesswork of selecting multipliers for your VWAP analysis. Instead of using arbitrary deviations, this indicator provides three distinct VWAP lines calculated from different price points - giving you a complete VWAP band with just one tool.
What Makes This Different From Standard VWAP
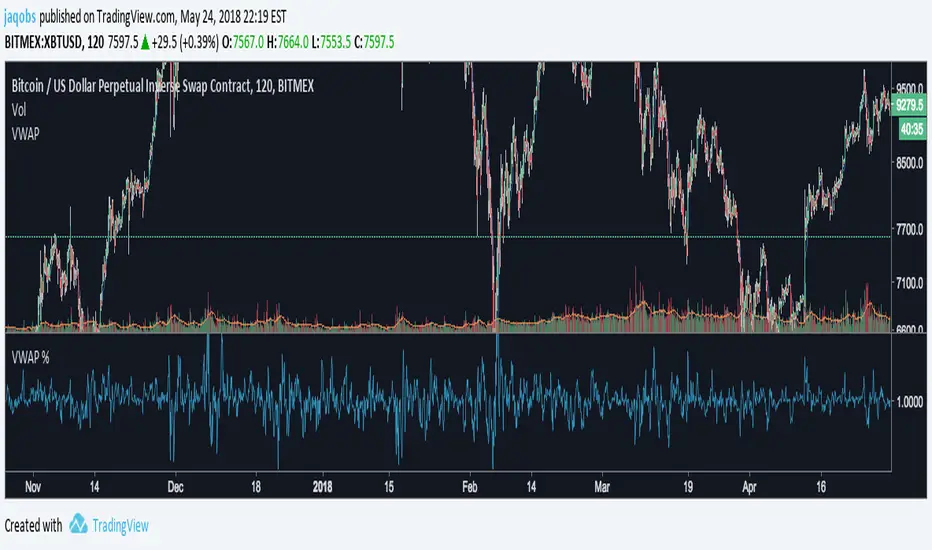
Traditional VWAP indicators use multipliers (1.0, 2.0, 3.0) which require constant adjustment across different markets and timeframes. The AVWAP Band simplifies this by using natural price points:
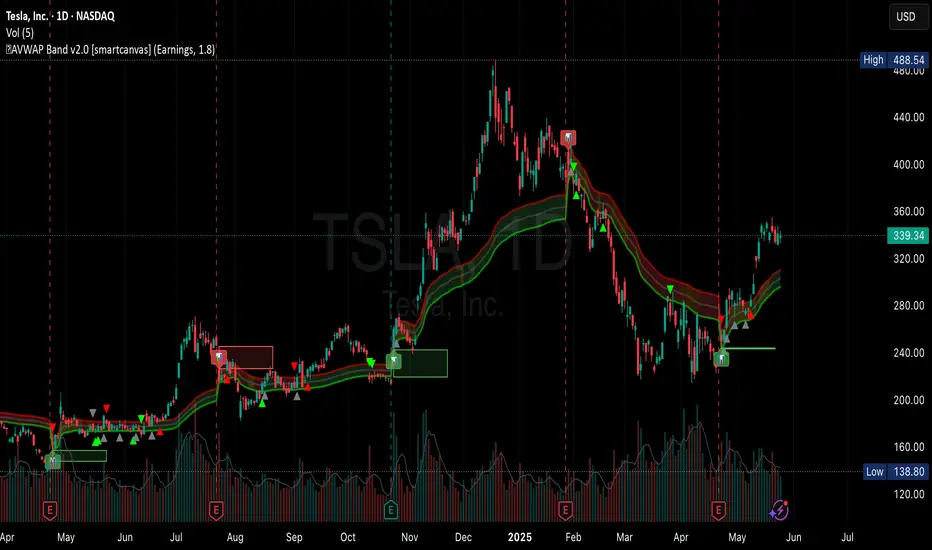
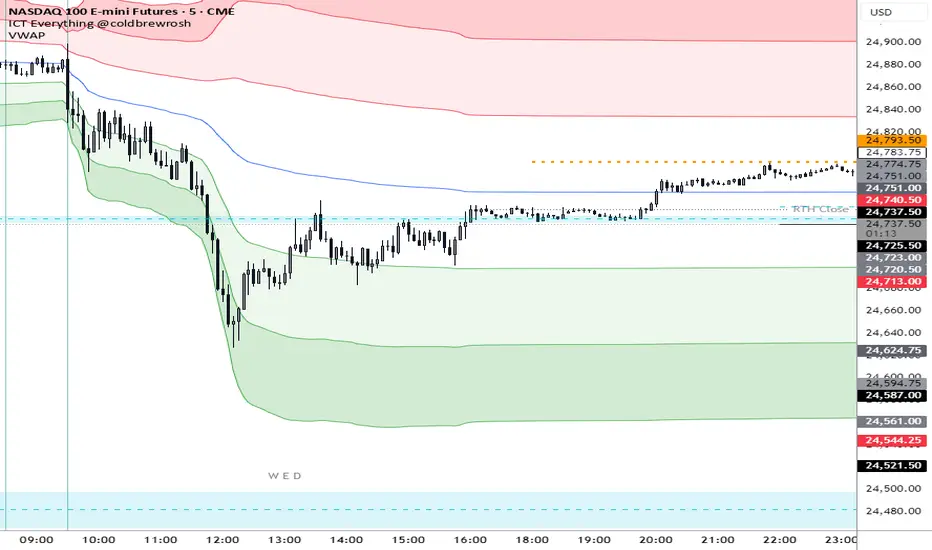
Low-based VWAP (green) - acts as support
High-based VWAP (red) - acts as resistance
HL2-based VWAP (gray) - acts as the centerline
Key Features
Reduces cognitive load - no more guessing which multiplier to use
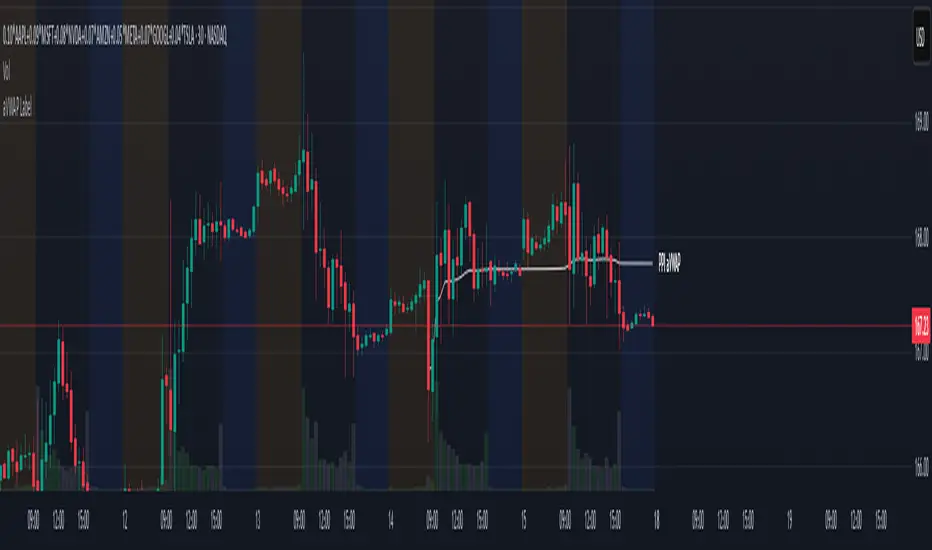
User-selected anchor point (click to set date)
Customizable colors and line styles
Built-in alerts for all crossover/crossunder events
Visual anchor point marker
How To Use It
After adding the indicator to your chart, you have to click on your anchor point
Watch for price reactions at each VWAP line
Look for crossovers between price and the different VWAPs
Use the HL2 VWAP as a centerline to determine overall bias
Trading Applications
Support/Resistance levels for intraday trading
Mean-reversion signals when price touches band extremes
Trend confirmation when price holds above/below centerline
Range identification between upper and lower bands
Volatility assessment based on band width
Customization Options
Toggle each VWAP line individually
Adjust line colors to match your chart theme
Control line width and transparency
Enable/disable anchor point label
This indicator simplifies VWAP analysis by giving you natural price-based bands without the need to adjust multipliers across different markets. The high, low, and HL2 sources create a complete VWAP picture with just one tool.
VIDEO
Feedback and suggestions welcome!
อินดิเคเตอร์ Pine Script®