ATR Price Targets w/POC
ATR Price Targets with Point of Control (POC):
This script is designed to help traders identify key price target levels based on configurable multipliers of the the Average True Range (ATR) and the volume based Point of Control (POC). It is intended for intraday traders looking to capture significant price movements.
Features:
ATR Price Targets: The script calculates three levels of price targets above and below the first bar of the day, based on the ATR of the last 22 days (assuming 5-minute candles). These targets are adjustable through the settings, allowing traders to set their own ATR multipliers.
Point of Control (POC): The POC is determined as the price level of the highest volume bar since the start time, providing an indication of the most traded price within the specified period.
Customizable Start Time: Traders can set their desired start time for the calculation of price targets and POC, allowing for flexibility in aligning the indicator with their trading strategy.
Plot Lines: The ATR price targets are plotted as lines for easy visualization on the chart.
Usage:
The ATR price targets can be used as potential take-profit or stop-loss levels.
The POC can serve as a key level for assessing market sentiment and potential reversals.
Traders can adjust the ATR multipliers and start time based on their specific trading style and market conditions.
Settings:
ATR Price Targets 1, 2, 3: Adjust the multipliers for the ATR price targets. By default, these are set to 1*ATR for T1+/T1-, 3*ATR for T2+/T2- and ATR*6 for T3+/T3-. Adjust with caution as the price targets found in defaults have proven to be more accurate over intraday cycles for volatile stocks.
Start Hour & Start Minute: Set the starting hour and minute for the calculations. By default, these are set to the opening 5 minute intraday bar, but can also be set to the opening bar of pre-market hours.
ค้นหาในสคริปต์สำหรับ "VOLUME BAR"

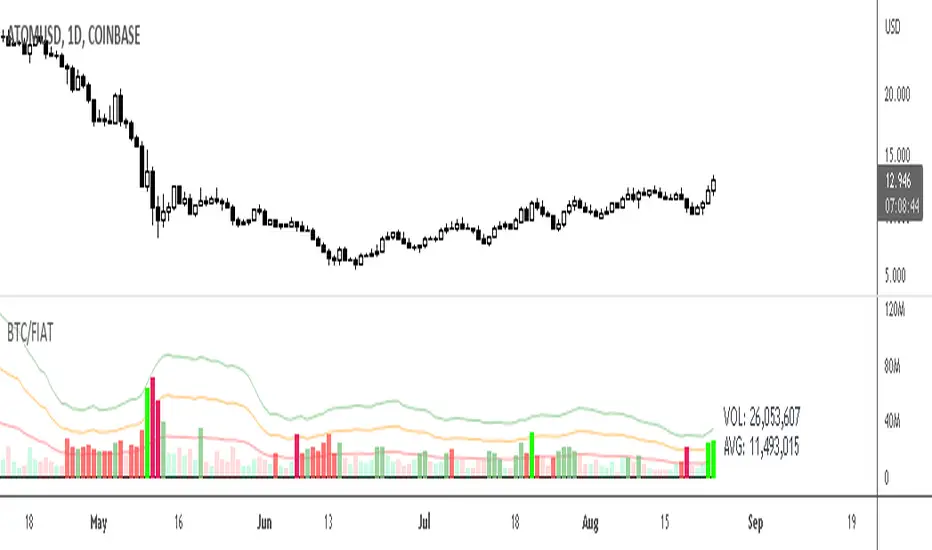
BTC/Fiat Inverse Volume Info for Altcoins
displays the Alt Coin volume in BTC if it is a BTC pair (or whatever the quote currency is)
displays the Alt Coin volume in USDT if it is a USDT pair (or whatever the quote currency)
displays the current volume and average volume in label beside bars
volume bars that exceed averages are highlighted
configuration options and moving average overrides available
alerts enabled
Divergence + EMAS' + VolumeHi,
This strategy takes in consideration multiple factors: includes RSI divergence, plus cross of EMAs and volume
STRATEGY:
you can change the EMAs input best use for daily charts
BUY: ALERT:
WHEN RSI divergence ABOVE 0 AND EMA 5 CROSS-OVER EMA 12
AND THE CANDLE NEED TO CLOSE ABOVE BOTH MOVING AVERAGE
And THE VOLUME BAR NEED TO BE HIGHER THAN THE PREVIOUS ONE
Then a buy signal will appear
SELL ALERT:
WHEN RSI divergence BELOW 0 AND MA 5 CROSS-UNDER EMA 12
AND THE CANDLE NEED TO CLOSE below BOTH MOVING AVERAGE
THE VOLUME BAR NEED TO BE HIGHER THAN THE PREVIOUS ONE
Then a sell signal will appear
Ema 200 FILTER. :::
When this box is activated, all trades under the EMA 200 will not appear on the chart,, when deactivated, trades will appear. On the chart.
that way u prevent wrong trades. obviously u will need to use support and resistance to find re entry point or the lowest point when under the 200 EMA.
No strategy is perfect but this one get close to it.
VOLUME: the volume box is turn off , only to display or not display in the chart, but is considered on the math within the strategy so by turning off you are only turning off the visual part
any questions feel free to ask, thanks!

High Volume BarsThis script colors bars whenever their volume has exceeded more than a standard deviation (or multiples of it) from a given amount of bars in the past.
Volume is commonly used as confirmation for a break of a significant level, or as indicative of offside positions when a level fails to be defended. Conviction or Excess, depending on the context.

FnoPulse Volume PressureFnoPulse VP is an indicator it will show stock volatility condition. it is created based on the intraday volume movements. By using this we can detect the momentum in the stock, read on. ( we can apply this in lower timeframes like , 5min, 15min, 30min, 1hr)
FnoPulse VP has 2 main components:
Delta Volumes (Green/red area )
MA line (yellow)
How does it work?
The Delta volume bar is in green. it indicates buyers are aggressive on that stock.
The Delta volume bar is in red. it indicates seller are aggressive on that stock.
The MA line. to show the 30 candle volume average.
What are the signals?
it wont generate any signals. just it will plot the buyer and seller volumes.
Can we set the Alert on this?
No, we can not set the alert based on the buyer/seller volumes.
IMPORTANT: this script does not generate any signals. Perfectly catches long runs in trends at all underlings (stocks, indexes ) at 5 min, 15min, 30min, 1hr time frame. Lower/High period gives more incorrect signals. Don't use this in daily time frame.
Try it! Good luck and good trading!
For access, please PM us or visit the link below in our Signature.

Multi MA on candlestick volume indicatorUses 5 volume moving averages to change the candlestick color depending on how high above average volume is.
The volumes plotted at the bottom of the chart are set to the same settings as the indicator, you can see the volume bars that stick higher above the orange moving average are a different color on the chart to the smaller ones.
Any volume bar that is below the moving average is colored purple.

Volume, Simple Relative Volume HighlightThis script plots volume bars and highlight bars that have an unusual activity, compare to the average (Standard: Simple Moving Average, 50 periods).
The script is useful for checking daily volume levels on equities. Where there is high volume, there is likely volatility, wich is good for day trading and swing trading entries.

VolumeZThis study show you the volume bar that are significant above the median >2 times per 5 bars
the volume bar is shown as volume/price
you can change and modify to make it better :)

POC Volume Bar (Highest Volume in Range)What the highlighted POC bar means
🔶 1. Institutional interest
A POC often identifies where big money stepped in.
🔶 2. Support or resistance pivot
Large volume often signals:
• A reversal
• A breakout
• Or the beginning of a trend
🔶 3. Liquidity magnet
Price tends to revisit high-volume bars.
They act like magnets.
🔶 4. Trend confirmation or exhaustion
High volume on:
• Green candle → bullish participation
• Red candle → distribution / aggressive selling

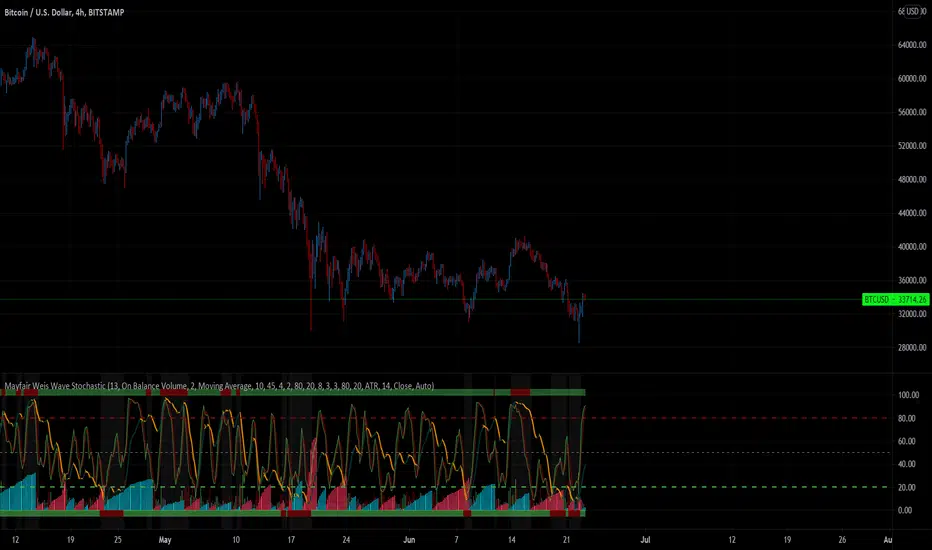
Mayfair Volume Stochastic 1.0This indicator takes some of the simple tools such as RSI and Stochastic, and provides information of the macro picture for both trending and non-trending markets;
The Relative Strength Index part of the indicator is standard and is used in technical analysis that ranges between zero and one (or zero and 100 on some charting platforms.
This indicator has the ability to change between multiple settings; Elders Force Index, Money Flow Index, On Balance Volume & Price Volume Trend.
The Stochastic part is measuring not only the conventional Stochastic K – but also the accumulation/distribution and this is used with the volume bars at the bottom.
All are uniquely combined to give “False bar” signals when certain criteria is met – this is visualised by the Green turning Red on the upper and lower boundaries of the indicator. When Red, the trend is false, when green the trend is trending.
It’s a unique view of the market, confirmation of trend (false or not) inclusive of the volume profile across the bottom. Colour set to Red (Bearish), Green (Bullish) and Grey is undecisive volume.
Volume Based Supply & DemandVolume Based Supply & Demand Zone indicator compares the size of volume bars so that if there is a noticeable increase in volume (noticeable here meaning above the indicator threshold) it marks the bar high and low prior to the bigger volume candle.

Volume Based S/RI got a question if it would be possible to Automatically draw S/R levels based on Volume rather than RSI as I had earlier done in this script;
Well it certainly is and it looks as though it might even be tradeable.
The indicator compares the size of volume bars so that if there is a noticeable increase in volume (noticeable here meaning above the indicator threshold) it marks the bar high and low prior to the bigger volume candle.

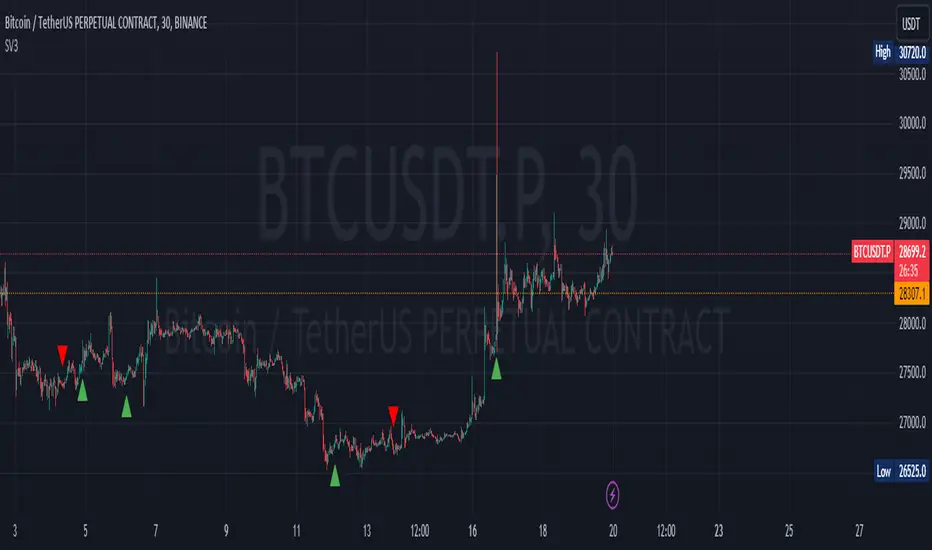
Thuận-Pro Full $$$📘 INDICATOR MANUAL: THUẬN-PRO FINAL
The Ultimate Price Action & Momentum System
1. OVERVIEW
Thuận-Pro Final is an all-in-one trading system designed for precision and safety. It combines Market Structure, Supply/Demand Zones, and Momentum Confluence to identify high-probability trade setups.
2. VISUAL FEATURES
Green Boxes (Support Zones): Strong buying areas.
Red Boxes (Resistance Zones): Strong selling areas.
"BUY" / "SELL" Labels: Instant signals generated when price tests a zone and confirms a rejection.
Purple Lines (Fibonacci Targets): Auto-generated profit targets (1.272, 1.618, 2.618) when price breaks the All-Time High (Blue Sky mode).
Bottom Pane:
RSI + MACD: Color-coded trend strength.
Volume + Yellow Line: Real-time volume analysis vs. EMA 21.
3. HOW TO TRADE (STRATEGY)
🟢 BUY SIGNAL (Long Setup)
Zone: Price drops into a Green Box (Support).
Reaction: Price touches the zone but CLOSES inside or above the box bottom (Valid Rejection/Spring).
Confirmation: A green "BUY" label appears below the candle.
Momentum (Optional): RSI is Oversold (≤ 35) and Volume bar is above the Yellow Line.
🔴 SELL SIGNAL (Short Setup)
Zone: Price rallies into a Red Box (Resistance).
Reaction: Price touches the zone but CLOSES inside or below the box top (Valid Rejection/Upthrust).
Confirmation: A red "SELL" label appears above the candle.
Momentum (Optional): RSI is Overbought (≥ 65) and Volume bar is above the Yellow Line.
4. SMART ALERTS
Set up alerts in TradingView to never miss a move:
Touch Support: Triggered when price tests a Green Zone.
Touch Resistance: Triggered when price tests a Red Zone.
Break High: Trend Reversal (Bearish ➔ Bullish).
Break Low: Trend Reversal (Bullish ➔ Bearish).
5. PRO TIPS
Safe Entry: The indicator filters out "Knife Catching." If a candle closes outside the box (breaking the zone), the signal will NOT appear.
Profit Taking: Use the Purple Fibonacci Lines (1.618) as your primary target when the market breaks new highs.
Stop Loss: Place SL slightly below the Green Box (for Buy) or above the Red Box (for Sell).
Developed by: Nguyen Duc Thuan

Thuận-Pro Full OptionThe Ultimate Price Action & Momentum System
1. OVERVIEW
Thuận-Pro Final is an all-in-one trading system designed for precision and safety. It combines Market Structure, Supply/Demand Zones, and Momentum Confluence to identify high-probability trade setups.
2. VISUAL FEATURES
Green Boxes (Support Zones): Strong buying areas.
Red Boxes (Resistance Zones): Strong selling areas.
"BUY" / "SELL" Labels: Instant signals generated when price tests a zone and confirms a rejection.
Purple Lines (Fibonacci Targets): Auto-generated profit targets (1.272, 1.618, 2.618) when price breaks the All-Time High (Blue Sky mode).
Bottom Pane:
RSI + MACD: Color-coded trend strength.
Volume + Yellow Line: Real-time volume analysis
3. HOW TO TRADE (STRATEGY)
🟢 BUY SIGNAL (Long Setup)
Zone: Price drops into a Green Box (Support).
Reaction: Price touches the zone but CLOSES inside or above the box bottom (Valid Rejection/Spring).
Confirmation: A green "BUY" label appears below the candle.
Momentum (Optional): RSI is Oversold (≤ 35) and Volume bar is above the Yellow Line.
🔴 SELL SIGNAL (Short Setup)
Zone: Price rallies into a Red Box (Resistance).
Reaction: Price touches the zone but CLOSES inside or below the box top (Valid Rejection/Upthrust).
Confirmation: A red "SELL" label appears above the candle.
Momentum (Optional): RSI is Overbought (≥ 65) and Volume bar is above the Yellow Line.
4. SMART ALERTS
Set up alerts in TradingView to never miss a move:
Touch Support: Triggered when price tests a Green Zone.
Touch Resistance: Triggered when price tests a Red Zone.
Break High: Trend Reversal (Bearish ➔ Bullish).
Break Low: Trend Reversal (Bullish ➔ Bearish).
5. PRO TIPS
Safe Entry: The indicator filters out "Knife Catching." If a candle closes outside the box (breaking the zone), the signal will NOT appear.
Profit Taking: Use the Purple Fibonacci Lines (1.618) as your primary target when the market breaks new highs.
Stop Loss: Place SL slightly below the Green Box (for Buy) or above the Red Box (for Sell).
Developed by: Nguyen Duc Thuan

OrderBlock / FVG / BoS / Pivots (Multi-Tools) v 1.3Questo indicatore identifica e visualizza diversi pattern di price action utilizzati nel trading Smart Money Concepts (SMC). Ecco cosa fa:
Funzionalità Principali
-Order Blocks (OB) - Identifica blocchi di ordini istituzionali dove il prezzo potrebbe rimbalzare
-Fair Value Gaps (FVG) - Rileva gap di prezzo che potrebbero essere riempiti
-Break of Structure (BoS) - Segnala rotture di strutture di mercato importanti
-Rejection Blocks (RJB) - Trova zone di rifiuto del prezzo
-Premium Premium Discount Discount (PPDD) - Identifica order blocks formati dopo sweep di liquidità
Caratteristiche Aggiuntive
-Pivot Points - Visualizza massimi e minimi di mercato
-High Volume Bars - Evidenzia candele con volume anomalo
-Stacked OB+FVG - Segnala quando order block e fair value gap si sovrappongono
Personalizzazione
L'indicatore offre controlli completi per:
-Colori personalizzabili per ogni elemento
-Numero massimo di box visualizzabili
-Trasparenza e stili dei bordi
-Etichette e dimensioni
-Opzioni per evidenziare zone "mitigate" (già testate dal prezzo)
È uno strumento molto utile per trader che seguono la metodologia "Smart Money" e cercano di identificare dove gli operatori istituzionali potrebbero aver piazzato i loro ordini.
////////////////////////////////////////////////////////////////////////////////
This indicator identifies and displays various price action patterns used in Smart Money Concepts (SMC) trading. Here's what it does:
Main Features
-Order Blocks (OB) - Identifies institutional order blocks where the price could bounce
-Fair Value Gaps (FVG) - Detects price gaps that could be filled
-Break of Structure (BoS) - Alerts breakouts of important market structures
-Rejection Blocks (RJB) - Finds price rejection zones
-Premium Premium Discount Discount (PPDD) - Identifies order blocks formed after liquidity sweeps
Additional Features
-Pivot Points - Displays market highs and lows
-High Volume Bars - Highlights candles with abnormal volume
-Stacked OB+FVG - Alerts when order blocks and fair value gaps overlap
Customization
The indicator offers complete controls for:
-Customizable colors for each element
-Maximum number of displayable boxes
-Transparency and border styles
-Labels and sizes
-Options to highlight "mitigated" zones (already tested by the price)
It's a tool Very useful for traders following the "Smart Money Concepts" and trying to identify where institutional traders may have placed their orders.

Sequence Volume BarsThis script in TradingView is designed to identify sequences of bars with increasing volume. It creates two indicators: one for bullish trends (green sequence) and another for bearish trends (red sequence).
Green Sequence: The script considers a green sequence when the current closing price is higher than the previous one, and the volume is increasing. When the green sequence approaches a user-defined length, it highlights it on the chart with a green triangle below the bar.
Red Sequence: Similarly, the script looks for a bearish sequence when the current closing price is lower than the previous one, and the volume is increasing. When the red sequence approaches the specified length, it highlights it with a red triangle above the bar.
Both indicators can also send alerts when their respective sequences reach the specified length minus one. This script can be useful for traders seeking entry points based on specific volume patterns in the market.
P.S. I'm not sure how this can be useful to you, but sometimes a pump and dump can be predicted. Maybe you'll come up with ideas on how to refine this concept.
-----------
Этот скрипт для TradingView предназначен для выявления последовательностей баров с ростом объема. Он создает два индикатора: один для бычьих трендов (зеленая последовательность) и другой для медвежьих трендов (красная последовательность).
Зеленая последовательность: Скрипт считает, что происходит зеленая последовательность, если текущая цена закрытия выше предыдущей, а объем увеличивается. Когда зеленая последовательность по длине приближается к заданной пользователем, он выделяет это на графике зеленым треугольником под баром.
Красная последовательность: Аналогично скрипт ищет медвежью последовательность, когда текущая цена закрытия ниже предыдущей, а объем растет. Когда красная последовательность приближается к указанной длине, он выделяет это красным треугольником над баром.
Оба индикатора могут также отправлять предупреждения, когда соответствующая последовательность достигает заданной длины минус один. Этот скрипт может быть полезен для трейдеров, ищущих входные точки, основанные на определенных шаблонах объема в рынке.
Не знаю как вам может это пригодиться, но иногда предсказывается пам и дамп. Может у Вас появится идея как доработать эту идею
Tick Profile HeatmapThis is a market internal TICK heatmap with the intent of displaying areas of price associated to stronger reactions with NYSE TICK (by default).
This code is based off of a variation of a Volume Profile coded originally by colejustice who originally used code from LuxAlgo . The full-width volume bars that colejustice setup were replaced with full-width bars representative of TICK breaking +/- $500, the current cumulative value representing the "heat" is comprised of hlc3 by default but that can be changed. In a future update I may add additional logic here to capture highs and lows in the heatmap specifically, and perhaps additional colors.
As with other traditional profiling studies, this indicators purpose is to visualize correspondence to specific price levels, allowing rapid assessment where the most TICK activity is occurring, and where it hasn't been. This information may provide areas of support and resistance and regions where price may move quickly repeatedly.
All of the same input guidance that colejustice provided is the same for those pre-existing inputs:
Inputs are set up such that you can customize the lookback period, number of rows, and width of rows for most major timeframes individually. Timeframes between those available will use the next lower timeframe settings (e.g., 2m chart will use the 1m settings.)
Zero usage of volume is present in this indicator, only TICK data so please don't confuse it with volume studies.

Gaussian Fisher Transform Price Reversals - FTRHello Traders !
Looking for better trading results ?
"This indicator shows you how to identify price reversals in a timely manner." John F. Ehlers
Introduction :
The Gaussian Fisher Transform Price Reversals indicator, dubbed FTR for short, is a stat based price reversal detection indicator inspired by and based on the work of the electrical engineer now private trader John F. Ehlers.
The Fisher Transform :
It is a common assumption that prices have a gaussian / normal probability density function(PDF), i.e. a sample of n close prices would be normally distributed if the probability of observing a price value say at any given standard deviation range is equal to that probability in the case of the normal distribution, e.g. 68% off all samples fell within one standard deviation around the mean, which is what we would expect if the data was normal.
However Price Action is not normally distributed and thus can not be conventionally interpreted in this way, Formally the Fisher Transform, transforms the distribution of bounded ranging price action (were price action takes values in a range from -1 to 1) into that of a normal distribution, alternatively it may be said the Fisher Transform changes the PDF of any waveform so that the transformed output has n approximately Gaussian PDF, It does so through the following equations. taken directly from the work of John F. Ehlers - Using The Fisher Transform
By substituting price data in the above formulas, bounded ranging price actions (over a given user defined period lookback - this determines the range price ranges in, see the Intermediate formula above) distribution is transformed to that in the normal case. This means when the input, the Intermediate ,(the Midpoint - see formula above) approaches either limit within the range the outputs are greatly amplified, this amplification accentuates /puts more weight on the larger deviations or limits within the range, conversely when price action is varying round the mean of the range the output is approximately equal to unity (the input is approximately equal to the input, the intermediate)
The inputs (Intermediates) are converted to normal outputs and the nonlinear Transfer of the Fisher Transform with varying senesitivity's (gammas) can be seen in the graph / image above. Although sensitivity adjustments are not currently available in this script (I forgot to add it) the outputs may be greatly amplified as gamma (the coefficient of the Fisher Transformation - see Fish equation) approaches 1. the purple line show this graphically, as a higher gamma leads to a greater amplification than in the standard case (the red line which is the standard fisher transformation, the black plot is the Fish with a gamma of 1, which is unity sensativity)
Reversal plots and Breakouts :
- Support lines are plotted with their corresponding Fish value when there is a crossover of the Fish and Fish SMA <= a given standard deviation of Fish
- Resistance lines are plotted with their corresponding Fish value when there is a crossunder of the Fish and Fish SMA >= a given standard deviation of Fish
- Reversals are these support and resistance line plots
Breakouts and Volume bars :
Breakouts cause the reversal lines to break (when the high/low is above the resistance/support), Breakouts are more "high quality" when they occur conditional on high volume, the highlighted bars represent volume standard deviations ranging from -3 to 3. When breakouts occure on high volume this may be a sign of the continutaion of the trend (reversals would signify the start of a new trend).
Hope you enjoy, Happy Trading !
(be sure to rocket the script if you liked it, this helps me know which of my scripts are the most useful)

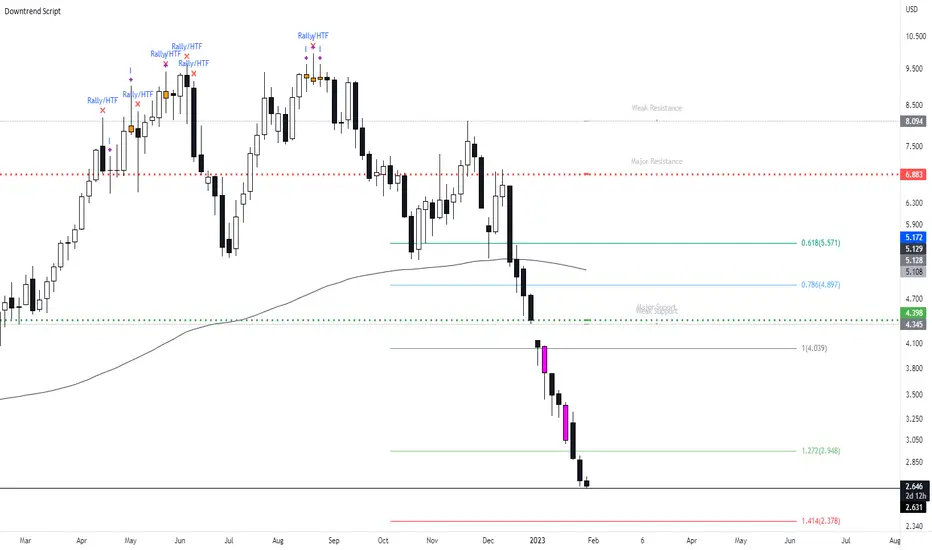
New Bearish Downtrend Script - Perfect for Short SellingIts been a while since i last uploaded a script, what i have for you today is a script which works very efficiently for downtrends and spotting reversals. This is a script i use on a weekly basis when looking to short sell.
This script includes :
Updated** Rally Candles for HTF and LTF ( End of Impulsive move signal) - The psychology of the candle when used with market information can be viewed as a end or near to the end of a big impulsive leg - when this candle occurs in BEARISH CONDITIONS, we can assume price is likely to move away short term.
Major and Minor Support Levels HTF (Areas of interest)
The Psychology on these levels is price will do something at these key levels - it takes in the last quarter price action of High Open Low Close to generate the price levels and when price comes into these areas we are likely to see a bounce or rejection from this area.
Bearish Breakout Volume Candle - This candle will paint a Purple colour bar when volume breaks above the 7day average - this shows strong momentum in the market and will usually be seen when price is in a downtrend with strong momentum.. However when this does occur we can expect a short term bounce or base so don't trade the volume bar alone.
Indecision Candles - Psychology of this candle is to show exhaustion in the trend and ideally what to see this candle appear with Rally Candles at key areas for stronger set up. When the trend is moving up, the bearish doji can appear - i tend to look at this situation as a pause in the trend.
200 EMA
Everything in this script has alert conditions to provide an edge in the markets
This is an example of how the script will look on the HTF I'm using the Daily Timeframe for reference on TSLA
This is an example of how the script looks like on the LTF, price hit the Major Resistance twice and failed to hit the 3rd time and on each leg of the impulse, the chart portrayed the LTF Rally Candles
Heres an example on how to use both Major Resistance ( Area of Interest) Rally Candle and Volume Breakout as a trade set up idea - This setup idea was on Crude Oil last week and into this week.
When added to confluences such as Supply Zones, Mitigation Levels, Quasimodo patterns etc... this will enhance the script.
I will answer any questions if i haven't made the script clear or take any requests to improve the script.
Also will be uploading the Bullish Uptrend Script soon.
TACBotzTACBotz is designed to work in any market condition, and allows users to:
1. Detect the direction of trends in the price - using confluence between moving averages and oscillators
2. Detect volume trends - using moving averages and volume bar to volume bar comparisons
3. Automatic and real-time support & resistance levels - by using calculations that detect irregular price action patterns
4. Identify ideal entries and exits that are volume , trend, and/or support & resistance driven by identifying confluences on the above signals
5. Combine signals to form advanced strategies by using repeatable patterns such as Sc0 entry to Fade, or Sc1 entry to Fade
6. Filter out bad and/or dangerous entries by avoiding entering longs into resistance levels, or shorts into support levels
7. Identify holding conditions by scaling out with exit signals or monitoring background trend color (toggle Background Trend to "On" in the settings)

Volume & Highlights
Large or small volume bars are highlighted.
Normal bars are using the same colors as the built-in volume indicator.

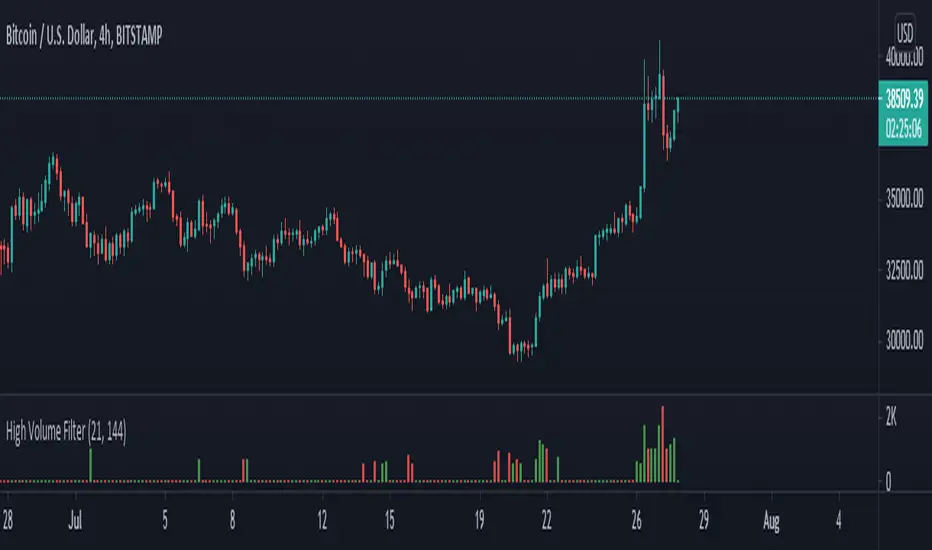
High Volume Filter - Taylor V1High Volume Filter
- Hide Small Volume Bar
- Show High Volume Bar
Able to Change the Filter Average Period
PSWave‴ | Price Spread Wave‴What does it do?
This indicator allows you to identify possible top and bottom reversals by having a prior Spread Price Volume reversal identifiable by positive (top reversal) and negative (bottom reversal) waves.
How does it work?
Everytime the wave starts ending its movement by shrinking the size of the histogram bars, it might be signing that a price reversal is on its way. It is possible to adjust the wave shape by increasing/decreasing its gradient value analysis, but it's so easy to use that most of the times no reconfiguration is needed, just add it and let it guide you.
What's my filling?
I've been testing this indicator for weeks and so far with incredible reversal signals specially if working in conjunction with Volume Wave (VolWave).
Indicator attributes:
- generally waves formation makes a symmetrical arc
- when the second half of a wave is elongated (compared to its first half), it suggests a lack of directional force of the current movement
- peak / bottom formation suggests reversal of the current movement
- smaller amplitude of a wave (compared to the previous wave) suggests loss of power, and vice-verse
- indicates divergence indication between peaks / bottoms
- when the volume bar touches the volume wave band, it suggests imminent reversal of the current movement
- band opening suggests movement increasing strength in that direction
- wavelengths (distance between two peaks / bottoms) tend to be similar
- subsequent wave rarely occurs
Technical information:
- the calculation of the positive movement is independent of the calculation of the positive movement
- the black line in the upper and lower zone is the average of the wave that is overcome, suggests strength in movement
- bands suggest delimitation of a wave's peak / bottom
To have access to this indicator, please DM me.
Don't contact me in the comment area.
