Ross Cameron 5 Pillars FilterFirst, I am not Ross Cameron. This indicator is based on his five pillars of stock selection.
ROSS CAMERON 5 PILLARS MOMENTUM FILTER
🎯 OVERVIEW
This indicator automatically checks if the current symbol meets Ross Cameron's famous "5 Pillars" stock selection criteria from Warrior Trading - a proven methodology for identifying high-probability momentum day trading setups.
📊 ROSS CAMERON'S 5 PILLARS
1️⃣ RELATIVE VOLUME ≥5x (Automated ✅)
• Compares current volume to 30-day average
• Minimum 5x confirms institutional/retail interest
• High RVol = high liquidity and momentum potential
2️⃣ DAILY % CHANGE ≥10% (Automated ✅)
• Stock must already be showing momentum
• Default threshold: 10% up from previous close
• Confirms demand is already present
3️⃣ NEWS CATALYST (Manual Check ⚠️)
• Breaking news justifies the price movement
• Look for: earnings, FDA approvals, partnerships, contracts
• 🔥 icon flags stocks with ≥15% momentum (likely news-driven)
4️⃣ PRICE RANGE $1-$20 (Automated ✅)
• Sweet spot for retail trader momentum
• Highly volatile small-cap stocks
• Accessible price range for position building
5️⃣ FLOAT <10 MILLION SHARES (Automated ✅)
• Low float creates supply/demand imbalances
• Enables explosive 50-100%+ intraday moves
• Automatically checked when data available
• Shows actual float with ✅/❌ indicator
🚀 KEY FEATURES
✅ GREEN BACKGROUND HIGHLIGHT
• Visual alert when ALL automated criteria are met
• Instantly identify potential setups while scanning watchlist
📋 DETAILED BREAKDOWN TABLE
• Shows pass/fail status for each pillar
• Displays actual values (RVol, %, Float, etc.)
• Color-coded for quick interpretation
🔥 STRONG MOMENTUM INDICATOR
• Highlights stocks ≥15% (likely have news catalyst)
• Helps prioritize which stocks to research first
🔔 BUILT-IN ALERTS
• "Ross Cameron Criteria Met" - All automated criteria pass
• "Strong Momentum Alert" - Stock showing explosive movement
⚙️ FULLY CUSTOMIZABLE
• Adjust all thresholds to your trading style
• Configurable table position and display
• Toggle volume spike filter on/off
💡 HOW TO USE
BEST WORKFLOW:
1. Build a watchlist of small-cap stocks using TradingView's Stock Screener
2. Add this indicator to your charts
3. Flip through your watchlist - look for GREEN BACKGROUNDS
4. Check the table for detailed breakdown of each pillar
5. VERIFY NEWS CATALYST (required for Pillar 3)
6. If float shows N/A, verify manually on Finviz
7. Execute your trading plan with proper risk management
OPTIMAL TIMING:
• Pre-Market (8:00-9:30 AM ET) - Identify gap-up candidates
• Morning Session (9:30 AM-12:00 PM ET) - Prime momentum window
• Avoid lunch hour (12:00-2:00 PM ET) - Low volume, choppy
ALERT SETUP:
1. Click "Create Alert" on your chart
2. Select "Ross Cameron Criteria Met" condition
3. Get notified when new setups appear real-time
⚙️ CUSTOMIZABLE SETTINGS
PILLAR 1 - RELATIVE VOLUME:
• Min RVol: 5.0x (Ross's minimum, increase for more selective)
• RVol Period: 30 days (industry standard)
PILLAR 2 - MOMENTUM:
• Min Daily %: 10% (increase to 15% for stronger setups)
PILLAR 3 - CATALYST:
• Strong Momentum %: 15% (threshold for 🔥 indicator)
PILLAR 4 - PRICE RANGE:
• Min Price: $1.00 (adjust based on account size)
• Max Price: $20.00 (Ross's sweet spot)
PILLAR 5 - FLOAT:
• Max Float: 10M shares (ultra-aggressive traders use 5M)
ADDITIONAL FILTERS:
• Volume Spike: 2x (Warrior Trading standard)
• Confirms intraday momentum continuation
📈 INTERPRETATION GUIDE
✅ GREEN BACKGROUND = GO!
• All automated criteria are met
• Check news catalyst before trading
• Verify setup on chart (not overextended)
• Follow your risk management plan
❌ NO GREEN BACKGROUND = WAIT
• At least one criterion failed
• Check table to see which pillar(s) failed
• May become valid later if momentum increases
🔥 FLAME ICON = HIGH PRIORITY
• Stock showing very strong momentum (≥15%)
• Likely has significant news catalyst
• Research news IMMEDIATELY
• Often the best setups of the day
⚠️ N/A FOR FLOAT = MANUAL CHECK
• TradingView doesn't have float data for this symbol
• Verify on Finviz.com or similar
• If float >10M, setup is invalid per Ross's criteria
📚 RECOMMENDED STRATEGIES
GAP AND GO:
• Stock gaps up 10%+ on news
• Enters above gap high with volume
• Targets: 20-50% gains
VWAP BOUNCE:
• Pullback to VWAP support
• Enters on bounce with volume confirmation
• Tight stop below VWAP
HIGH OF DAY BREAKOUT:
• New HOD with volume surge
• Momentum continuation play
• Trail stop as it runs
ABCD PATTERN:
• Classic reversal pattern
• Enters on D-point breakout
• Target: A-B distance from C
⚠️ RISK WARNINGS
• DAY TRADING IS HIGHLY RISKY - Most day traders lose money
• This indicator finds setups - YOUR EXECUTION determines success
• Always use proper risk management (1-2% risk per trade)
• Never trade without stop losses
• Paper trade extensively before using real money
• Past performance does not guarantee future results
🔧 TECHNICAL DETAILS
• Pine Script v6
• Works on any timeframe (calculates daily metrics automatically)
• Compatible with TradingView Free, Pro, Premium
• No repainting - all calculations based on confirmed data
• Efficient code - minimal lag
📊 DATA SOURCES
• Relative Volume: Calculated from 30-day volume average
• Daily %: Previous day's close vs current price
• Float: TradingView's shares_outstanding_float data
• Volume Spike: 20-period volume moving average
🎯 WHO THIS IS FOR
IDEAL FOR:
✅ Day traders focused on momentum strategies
✅ Traders who follow Ross Cameron/Warrior Trading methodology
✅ Small-cap stock traders ($1-$20 range)
✅ Scalpers and swing traders seeking high-volatility setups
NOT IDEAL FOR:
❌ Long-term investors
❌ Large-cap stock traders
❌ Options-only traders
❌ Traders who don't monitor news catalysts
💬 USAGE TIPS
1. COMBINE WITH OTHER TOOLS
• Use alongside your charting/technical analysis
• Verify pattern setups (bull flags, ABCD, etc.)
• Check Level 2 / Time & Sales for confirmation
2. MAINTAIN A WATCHLIST
• Update daily with fresh small-cap movers
• Use Finviz Gap Scanner as starting point
• Focus on sectors with momentum
3. RISK MANAGEMENT IS KEY
• Never risk more than 1-2% per trade
• Use 2:1 minimum profit/loss ratio
• Cut losses quickly, let winners run
• Position size based on volatility (ATR)
4. TRACK YOUR RESULTS
• Keep a trading journal
• Note which setups work best for you
• Refine criteria based on your data
• Continuous improvement mindset
📝 DISCLAIMER
This indicator is for EDUCATIONAL PURPOSES ONLY. It is not investment advice, a recommendation to buy/sell securities, or a guarantee of profits. Trading involves substantial risk of loss. Always:
• Conduct your own research and due diligence
• Consult with a licensed financial advisor
• Never risk money you cannot afford to lose
• Understand that most day traders lose money
• Practice in a simulator before trading real money
The creator of this indicator is not affiliated with Ross Cameron or Warrior Trading. This is an independent implementation of publicly available trading methodology.
📈 SUPPORT & FEEDBACK
If you find this indicator helpful, please:
• Give it a thumbs up 👍
• Leave a comment with your experience
• Share with other momentum traders
• Follow for updates and new indicators
For questions or suggestions, leave a comment below!
---
🏆 HAPPY TRADING! Remember: The indicator finds opportunities, but YOUR discipline, risk management, and execution determine your success.
#DayTrading #Momentum #RossCameron #WarriorTrading #SmallCaps #GapAndGo #Scalping #StockScreener
ค้นหาในสคริปต์สำหรับ "Trailing stop"

Kronos Scalper (RAVINDRA KHADSE) 11.11.2025Nice — below is a ready-to-copy TradingView Pine Script (v5) strategy named “Kronos Scalper”.
It’s a self-contained scalping strategy (non-repainting) with configurable EMAs trend filter, RSI entry filter, ATR-based stop loss / take profit, optional trailing stop, plots and entry/exit labels. Drop it into TradingView’s Pine editor and Add to Chart → Strategy Tester.

Higher Timeframe Candle LevelsThis is an indicator that shows higher time frame candle levels from various preset timeframes. These higher time frame candles act as support and resistance levels, so look for reversals and continuations off of these levels. When price exceeds the high or low of these levels, you should look for breakouts in the same direction and trade with the trend.
It includes candle levels for the following timeframes: 1 hour, 4 hour, 1 day, 1 week, 1 month, 1 quarter and 1 year. The indicator also includes a trend candle coloring feature, trend strength scoring table, stop loss feature, line identification labels, alerts for trend changes, alerts for level touches and full customization of all options.
How To Trade With This Indicator
These higher timeframe candle levels will act as support and resistance levels, so look for price to react at any of the levels you have turned on and then look for potential bounce or reversal signs at those levels so you can trade those direction changes. Price outside of the higher timeframe candle highs and low typically signals a breakout as well, so look for price to continue after passing the highs or lows.
You can use the direction of the higher timeframe candles as your trend as well. Try to only trade in the direction of the trend of the higher timeframes to increase the likelihood of your trade going in your favor.
The highs and lows of daily and up levels are excellent levels to find quick reversal off of. Watch for price action to struggle to break through these levels and then trade the reversal. If price breaks through these levels easily, watch for price to retest the level and then continue beyond that level. Trade the retest in the direction of the trend.
The open, close and midline levels are excellent for trading bounces. Watch for price to form wicks beyond these levels and close on the other side and use that as a sign that price may bounce there. Use that with price action to confirm your trade and then take trades off of those level bounces.
Use the alerts for daily and up timeframe level touches across all of your favorite markets so that way you are always notified in real time when price is at a level that could provide a potential trading opportunity.
Higher Time Frame Candle Levels
The indicator shows the current candle open, previous open, previous high, previous low, previous close and previous candle body midline levels of each candle for each time frame. This helps you easily see what is going on with the higher time frame candles and read the price action from your lower time frame charts.
Each candle level will paint red if it was a down candle or green if it was an up candle, except the midlines and current candle open lines, those are a different color for easy differentiation. The line colors can be customized to your preferences in the settings and you can also toggle the candle body coloring on or off, as well as change the color of the candle body background.
Each timeframe can be adjusted to your preferences, allowing you to turn all of the levels on or off. You can also adjust how many previous candles show up on your chart so you can backtest it and see for yourself how accurate these levels are.
When adjusting the number of candles, you will get a notification if you have more than 500 lines turned on, so just turn down the number of levels for whatever timeframe you can’t see on your chart to lower that number below 500. The notification will go away once you are under 500 lines again. Each candle has 6 lines if all levels are turned on for that timeframe: open, current candle open, close, high, low and midline. The default settings keep you under 500 lines total, so just be aware of that limitation when adjusting those numbers and adjust the number of levels down on the timeframes that are not useful on the current chart bar.
You can also extend the levels right on any time frame from the daily levels and above. This is useful when price is breaking above or below all levels and you need to know if there are any other previous candle levels in the way as price moves away from the most recent higher time frame candles.
To understand the intraday trend of each higher time frame, look to see where price is at according to each higher time frame candle. If the price is above the midline of the candle, it is bullish. If the price is above the candle body it is more bullish. If the price is above the high, it is very bullish. If the price is below the midline of the candle, it is bearish. If the price is below the candle body it is more bearish. If the price is below the low, it is very bearish. Make sure you backtest this yourself and go through lots of historical data to get a feel for how price reacts to these levels and establishes the trend. Then use that trend information to your advantage and trade in the direction of the trend.
Since users are limited to a certain amount of historical bars based on which Tradingview plan you have, some longer timeframe levels won’t show up because the start of that candle is too far back in history. You will get a notification at the top of that chart if that happens. It will tell you to lower the display timeframe for that timeframe until that notification goes away, which means it was able to plot the most recent candle for that timeframe on your chart.
Trend Candle Coloring
The indicator includes a feature that paints the candles based on whether the current time frame candles are above or below the most recent midline, candle body or high & low of a higher time frame candle of your choice. This helps you see the overall trend of the higher timeframe so you can trade with the trend.
The candle coloring will have an up color, down color and neutral color which can all be customized to suit your preferences. If the current time frame candle close is above the setting you choose, it will show the up color. If the current time frame candle close is below the setting you choose, it will show the down color. If the current time frame candle close is equal to or in the middle of the setting you chose, it will show the neutral color.
So, for example if you set it to candle body, then it will show the up color if the current candle is above the top of the candle body, down color if it is below the bottom of the candle body and neutral color if it is inside the candle body. This helps you wait for price action to move beyond the inside of the previous higher time frame candle before taking a position when price is breaking out of that previous candle so you can trade the momentum of that move. The candle coloring is fully customizable, but make sure to turn off your candle coloring on other indicators and your chart settings for it to show up properly.
Trend Strength Scoring Table
The trend strength scoring table displays a table at the bottom of the screen(table position is customizable), showing a score for the trend strength of each higher time frame. If the current candle close is above the midline, its strength is 1. If the current candle close is above the midline, but below the top of the candle body, its strength is 2. If the current candle close is above the high, its strength is 3. The same goes for below the midline, bottom of the candle body and below the low, but the scores would be negative 1, 2 or 3 instead.
This trend strength table allows you to quickly identify the trend on each higher time frame so you can wait until the trend is the same across all time frames before placing a trade in the direction of the trend. It also shows a total score on the far right side that adds all of the current trend scores together to give you a total strength score. Try to only trade when that number is very high compared to how many time frames you have turned on. Each time frame can have up to a maximum score of 3 if bullish and -3 if bearish. Each time frame in the table can be turned on or off to suit your preferences.
Stop Loss Feature
There is also a stop loss feature that you can set to whatever time frame you choose and whatever direction you chose, such as long or short. It will follow the most recent higher time frame candle’s trend using one of the following settings: candle body, high & low or midline. Once a new higher time frame candle is created, the stop loss will update to the most recent candle’s levels so you can use these levels as a trailing stop loss to maximize your wins.
If you have it set to use the candle body and it is set to long mode, then the stop loss will use the previous higher time frame candle’s lowest candle body level. So if it was an up candle previously, it will use the open. If it was a down candle previously, it will use the close. The opposite is true for short positions.
The stop loss will start working once you turn it on in the settings and will update automatically as new higher time frame candles are formed. It also shows a line of where the stop loss was previously since it was turned on.
I recommend using the high & low setting, especially when the market starts trending.
Candle Level Identification Labels
There are labels for each level starting with the 4 hour time frame and above so you can easily tell what level of each candle you are looking at, even if the rest of the candle is not showing within the chart pane. You can customize the label coloring for up candles and down candles and midlines as well as adjust the number of bars that the labels are offset from the current bar so they are visible on your chart without overlapping the current price action or other indicator labels. Labels for each time frame can be turned on or off as needed. The 1 hour labels were not included because it clogs up the chart, but it has labels for all time frames from the 4 hour candles and up.
Alerts
The indicator includes alerts for when the trend has changed to the opposite direction. The trend change alert is based on your settings for the Trend Candle Coloring. Whatever settings you have the trend candle coloring set to, will be used to set up your alerts. The Trend Candle Coloring setting must be turned on as well when creating your alerts for it to work properly. Make sure to backtest your settings and then create your alerts.
It also has alerts for when price is touching an open or close, high or low, midline or any of those levels for each timeframe. This allows you to be notified when price touches one of these levels so you can check the chart and look for potential trade opportunities if price wants to bounce off of that level. To make it easy for you to get alerts on many different tickers, just use the alert for any level touch on whatever timeframes you want.
Other Indicators To Pair This With
Use this in combination with our Trend Strength Indicator so you can visually see the historic and current trend for all of these levels. You should also use our Breakout Scanner to find other markets with strong trends so you always know which market is trending the strongest and can trade those. Trend Strength Indicator, Higher Timeframe Candle Levels and the Breakout Scanner all use the same levels and calculate the trend scores the same way so they are designed to work together to help you quickly be able to read a chart and find what direction to trade in.

Ornstein-Uhlenbeck Trend Channel [BOSWaves]Ornstein-Uhlenbeck Trend Channel - Adaptive Mean Reversion with Dynamic Equilibrium Geometry
Overview
The Ornstein-Uhlenbeck Trend Channel introduces an advanced equilibrium-mapping framework that blends statistical mean reversion with adaptive trend geometry. Traditional channels and regression bands react linearly to volatility, often failing to capture the natural rhythm of price equilibrium. This model evolves that concept through a dynamic reversion engine, where equilibrium adapts continuously to volatility, trend slope, and structural bias - forming a living channel that bends, expands, and contracts in real time.
The result is a smooth, equilibrium-driven representation of market balance - not just trend direction. Instead of static bands or abrupt slope shifts, traders see fluid, volatility-aware motion that mirrors the natural pull-and-release dynamic of market behavior. Each channel visualizes the probabilistic boundaries of fair value, showing where price tends to revert and where it accelerates away from its statistical mean.
Unlike conventional envelopes or Bollinger-type constructs, the Ornstein-Uhlenbeck framework is volatility-reactive and equilibrium-sensitive, providing traders with a contextual map of where price is likely to stabilize, extend, or exhaust.
Theoretical Foundation
The Ornstein-Uhlenbeck Trend Channel is inspired by stochastic mean-reversion processes - mathematical models used to describe systems that oscillate around a drifting equilibrium. While linear regression channels assume constant variance, financial markets operate under variable volatility and shifting equilibrium points. The OU process accounts for this by treating price as a mean-seeking motion governed by volatility and trend persistence.
At its core are three interacting components:
Equilibrium Mean (μ) : Represents the evolving balance point of price, adjusting to directional bias and volatility.
Reversion Rate (θ) : Defines how strongly price is pulled back toward equilibrium after deviation, capturing the self-correcting nature of market structure.
Volatility Coefficient (σ) : Controls how far and how quickly price can diverge from equilibrium before mean reversion pressure increases.
By embedding this stochastic model inside a volatility-adjusted framework, the system accurately scales across different markets and conditions - maintaining meaningful equilibrium geometry across crypto, forex, indices, or commodities. This design gives traders a mathematically grounded yet visually intuitive interpretation of dynamic balance in live market motion.
How It Works
The Ornstein-Uhlenbeck Trend Channel is constructed through a structured multi-stage process that merges stochastic logic with volatility mechanics:
Equilibrium Estimation Core : The indicator begins by identifying the evolving mean using adaptive smoothing influenced by trend direction and volatility. This becomes the live centerline - the statistical anchor around which price naturally oscillates.
Volatility Normalization Layer : ATR or rolling deviation is used to calculate volatility intensity. The output scales the channel width dynamically, ensuring that boundaries reflect current variance rather than static thresholds.
Directional Bias Engine : EMA slope and trend confirmation logic determine whether equilibrium should tilt upward or downward. This creates asymmetrical channel motion that bends with the prevailing trend rather than staying horizontal.
Channel Boundary Construction : Upper and lower bands are plotted at volatility-proportional distances from the mean. These envelopes form the “statistical pressure zones” that indicate where mean reversion or acceleration may occur.
Signal and Lifecycle Control : Channel breaches, mean crossovers, and slope flips mark statistically significant events - exhaustion, continuation, or rebalancing. Older equilibrium zones gradually fade, ensuring a clear, context-aware visual field.
Through these layers, the channel forms a continuously updating equilibrium corridor that adapts in real time - breathing with the market’s volatility and rhythm.
Interpretation
The Ornstein-Uhlenbeck Trend Channel reframes how traders interpret balance and momentum. Instead of viewing price as directional movement alone, it visualizes the constant tension between trending force and equilibrium pull.
Uptrend Phases : The equilibrium mean tilts upward, with price oscillating around or slightly above the midline. Upper band touches signal momentum extension; lower touches reflect healthy reversion.
Downtrend Phases : The mean slopes downward, with upper-band interactions marking resistance zones and lower bands acting as reversion boundaries.
Equilibrium Transitions : Flat mean sections indicate balance or distribution phases. Breaks from these neutral zones often precede directional expansion.
Overextension Events : When price closes beyond an outer boundary, it marks statistically significant disequilibrium - an early warning of exhaustion or volatility reset.
Visually, the OU channel translates volatility and equilibrium into structured geometry, giving traders a statistical lens on trend quality, reversion probability, and volatility stress points.
Strategy Integration
The Ornstein-Uhlenbeck Trend Channel integrates seamlessly into both mean-reversion and trend-continuation systems:
Trend Alignment : Use mean slope direction to confirm higher-timeframe bias before entering continuation setups.
Reversion Entries : Target rejections from outer bands when supported by volume or divergence, capturing snapbacks toward equilibrium.
Volatility Breakout Mapping : Monitor boundary expansions to identify transition from compression to expansion phases.
Liquidity Zone Confirmation : Combine with BOS or order-block indicators to validate structural zones against equilibrium positioning.
Momentum Filtering : Align with oscillators or volume profiles to isolate equilibrium-based pullbacks with statistical context.
Technical Implementation Details
Core Engine : Stochastic Ornstein-Uhlenbeck process for continuous mean recalibration.
Volatility Framework : ATR- and deviation-based scaling for dynamic channel expansion.
Directional Logic : EMA-slope driven bias for adaptive mean tilt.
Channel Composition : Independent upper and lower envelopes with smoothing and transparency control.
Signal Structure : Alerts for mean crossovers and boundary breaches.
Performance Profile : Lightweight, multi-timeframe compatible implementation optimized for real-time responsiveness.
Optimal Application Parameters
Timeframe Guidance:
1 - 5 min : Reactive equilibrium tracking for short-term scalping and microstructure analysis.
15 - 60 min : Medium-range setups for volatility-phase transitions and intraday structure.
4H - Daily : Macro equilibrium mapping for identifying exhaustion, distribution, or reaccumulation zones.
Suggested Configuration:
Mean Length : 20 - 50
Volatility Multiplier : 1.5× - 2.5×
Reversion Sensitivity : 0.4 - 0.8
Smoothing : 2 - 5
Parameter tuning should reflect asset liquidity, volatility, and desired reversion frequency.
Performance Characteristics
High Effectiveness:
Trending environments with cyclical pullbacks and volatility oscillation.
Markets exhibiting consistent equilibrium-return behavior (indices, majors, high-cap crypto).
Reduced Effectiveness:
Low-volatility consolidations with minimal variance.
Random walk markets lacking definable equilibrium anchors.
Integration Guidelines
Confluence Framework : Pair with BOSWaves structural tools or momentum oscillators for context validation.
Directional Control : Follow mean slope alignment for directional conviction before acting on channel extremes.
Risk Calibration : Use outer band violations for controlled contrarian entries or trailing stop management.
Multi-Timeframe Synergy : Derive macro equilibrium zones on higher timeframes and refine entries on lower levels.
Disclaimer
The Ornstein-Uhlenbeck Trend Channel is a professional-grade equilibrium and volatility framework. It is not predictive or profit-assured; performance depends on parameter calibration, volatility regime, and disciplined execution. BOSWaves recommends using it as part of a comprehensive analytical stack combining structure, liquidity, and momentum context.

SA_EMA Combo + UT BotEMA Combo + UT Bot is an indicator designed to make it easier to track trend direction and momentum reversals on the same chart.
The indicator combines multiple EMA lines (50/100/150/200) with a short- and medium-term EMA cloud. This cloud visually shows whether the market is in a bullish or bearish trend through color changes.
In addition, it uses the UT Bot algorithm to generate buy and sell signals adapted to market volatility. These signals are triggered when the price crosses the ATR-based trailing stop level.
Users can choose to use Heikin Ashi candles and adjust signal sensitivity via the Key Value parameter. This allows traders to follow overall trends and potential reversal zones using a single tool.
Disclaimer: This indicator is for technical analysis purposes only and should not be considered financial advice.
Developed for Future Alpha Club.
Darvas Lines/Box1. Overview
The Darvas Lines/Box (v1.0) is a dynamic trend following indicator based on the renowned method developed by Nicolas Darvas. It's designed to identify clear price consolidation ranges and detect decisive breakouts, crucial for positional and swing trading strategies.
This indicator automatically draws and adjusts the consolidation ranges, and includes modern enhancements such as Advanced Retest Confirmation and exposed alert conditions, providing reliable signals for monitoring and acting on trend continuations.
2. Core Features
Custom Display Mode (Lines/Box): Allows the user to toggle the visualization between showing just the Breakout Lines (Lines) or displaying the consolidation area with a filled background box (Box).
Source Selection (Wicks/Body): Users can choose whether the box boundaries are defined by the candlestick wicks (price extremes) or the candlestick body (open/close price). This feature is critical for adjusting sensitivity to market noise.
Dynamic Box Drawing: Draws Darvas boxes automatically by tracking price highs and lows based on user-defined parameters (Bars to Define Range, Max Box Height).
Retest Confirmation: Detects if the old resistance/support line functions effectively after a breakout. When a retest is confirmed, the line is extended and its color changes.
Price Labels (Stable Lock): Displays the highest and lowest box prices, fixed to the left outer edge of the box. This ensures stable visibility.
Progress Labels: Visualizes the current line price and the percentage distance to the closing price on the right side of the box, showing progress toward the next breakout.
3. Trading Strategy: How to Use the Indicator
This indicator is primarily used to identify trend initiation and trend continuation signals.
A. Entry Strategy (Breakout)
Long Entry Action: Consider taking a long entry when the price closes above the Upper Line (Green Line), signaled by a BULLISH BREAKOUT alert.
Signal: Use the BULLISH BREAKOUT alert.
Short Entry Action: Consider taking a short entry when the price closes below the Lower Line (Red Line), signaled by a BEARISH BREAKOUT alert.
Signal: Use the BEARISH BREAKOUT alert.
B. Retest Strategy (Add-on/Confirmation)
Action: When the price pulls back to touch the broken line (signaled by RETEST CONFIRMED), this confirms the break's validity.
Alert: The RETEST CONFIRMED alert is triggered at this moment.
C. Risk Management (General)
Stop Loss: The initial stop-loss is typically set just beyond the opposite side of the broken box. As the trend progresses and new boxes form, the lower boundary of the most recently formed box can be used as a trailing stop for managing risk.
4. Setting Parameters
Line Source (Wicks/Body): Crucial for sensitivity. 'Wicks' tracks price extremes; 'Body' tracks stronger close-to-close movements, ignoring noise.
Bars to Define Range: Defines the calculation period (in bars) for the box.
Cooldown Bars After Breakout: Sets the waiting period after a breakout before a new box can start forming.
Retest Lookback Bars (Phase 3): Sets the maximum number of bars to check for a retest during the cooldown phase.
Max Gap for Retest (%): Defines the maximum percentage distance from the line allowed to confirm a retest (Set to Zero (0.0%) for near-touch detection).
Alert Frequency (Breakout): Allows selection between Continuous and Once per Box for breakout signals.
5. Alerts: How to Set Up the Triggers
This indicator exposes several specific conditions to the TradingView alert panel, allowing you to select the exact event you want to monitor.
Step-by-Step Alert Setup:
Open the Alert Panel on the chart.
In the Condition field, select the indicator's name.
In the Alert Condition field, choose the specific event you want to monitor:
1. ANY DARVAS EVENT (Consolidated)
2. BULLISH BREAKOUT (Individual)
3. BEARISH BREAKOUT (Individual)
4. RETEST CONFIRMED (Individual)
In the Trigger field (Frequency), select your preferred native option (e.g., "Once Per Bar Close" or "Once per bar").

MESA Adaptive Ehlers Flow | AlphaNattMESA Adaptive Ehlers Flow | AlphaNatt
An advanced adaptive indicator based on John Ehlers' MESA (Maximum Entropy Spectrum Analysis) algorithm that automatically adjusts to market cycles in real-time, providing superior trend identification with minimal lag across all market conditions.
🎯 What Makes This Indicator Revolutionary?
Unlike traditional moving averages with fixed parameters, this indicator uses Hilbert Transform mathematics to detect the dominant market cycle and adapts its responsiveness accordingly:
Automatically detects market cycles using advanced signal processing
MAMA (MESA Adaptive Moving Average) adapts from fast to slow based on cycle phase
FAMA (Following Adaptive Moving Average) provides confirmation signals
Dynamic volatility bands that expand and contract with cycle detection
Zero manual optimization required - the indicator tunes itself
📊 Core Components
1. MESA Adaptive Moving Average (MAMA)
The MAMA is the crown jewel of adaptive indicators. It uses the Hilbert Transform to measure the market's dominant cycle and adjusts its smoothing factor in real-time:
During trending phases: Responds quickly to capture moves
During choppy phases: Smooths heavily to filter noise
Transition is automatic and seamless based on price action
Parameters:
Fast Limit: Maximum responsiveness (default: 0.5) - how fast the indicator can adapt
Slow Limit: Minimum responsiveness (default: 0.05) - maximum smoothing during consolidation
2. Following Adaptive Moving Average (FAMA)
The FAMA is a slower version of MAMA that follows the primary signal. The relationship between MAMA and FAMA provides powerful trend confirmation:
MAMA > FAMA: Bullish trend in progress
MAMA < FAMA: Bearish trend in progress
Crossovers signal potential trend changes
3. Hilbert Transform Cycle Detection
The indicator employs sophisticated DSP (Digital Signal Processing) techniques:
Detects the dominant cycle period (1.5 to 50 bars)
Measures phase relationships in the price data
Calculates adaptive alpha values based on cycle dynamics
Continuously updates as market character changes
⚡ Key Features
Adaptive Alpha Calculation
The indicator's "intelligence" comes from its adaptive alpha:
Alpha dynamically adjusts between Fast Limit and Slow Limit based on the rate of phase change in the market cycle. Rapid phase changes trigger faster adaptation, while stable cycles maintain smoother response.
Dynamic Volatility Bands
Unlike static bands, these adapt to both ATR volatility AND the current cycle state:
Bands widen when the indicator detects fast adaptation (trending)
Bands narrow during slow adaptation (consolidation)
Band Multiplier controls overall width (default: 1.5)
Provides context-aware support and resistance
Intelligent Color Coding
Cyan: Bullish regime (MAMA > FAMA and price > MAMA)
Magenta: Bearish regime (MAMA < FAMA and price < MAMA)
Gray: Neutral/transitional state
📈 Trading Strategies
Trend Following Strategy
The MESA indicator excels at identifying and riding strong trends while automatically reducing sensitivity during choppy periods.
Entry Signals:
Long: MAMA crosses above FAMA with price closing above MAMA
Short: MAMA crosses below FAMA with price closing below MAMA
Exit/Management:
Exit longs when MAMA crosses below FAMA
Exit shorts when MAMA crosses above FAMA
Use dynamic bands as trailing stop references
Mean Reversion Strategy
When price extends beyond the dynamic bands during established trends, look for bounces back toward the MAMA line.
Setup Conditions:
Strong trend confirmed by MAMA/FAMA alignment
Price touches or exceeds outer band
Enter on first sign of reversal toward MAMA
Target: Return to MAMA line or opposite band
Cycle-Based Swing Trading
The indicator's cycle detection makes it ideal for swing trading:
Enter on MAMA/FAMA crossovers
Hold through the detected cycle period
Exit on counter-crossover or band extremes
Works exceptionally well on 4H to Daily timeframes
🔬 Technical Background
The Hilbert Transform
The Hilbert Transform is a mathematical operation used in signal processing to extract instantaneous phase and frequency information from a signal. In trading applications:
Separates trend from cycle components
Identifies the dominant market cycle without curve-fitting
Provides leading indicators of trend changes
MESA Algorithm Components
Smoothing: 4-bar weighted moving average for noise reduction
Detrending: Removes linear price trend to isolate cycles
InPhase & Quadrature: Orthogonal components for phase measurement
Homodyne Discriminator: Calculates instantaneous period
Adaptive Alpha: Converts period to smoothing factor
MAMA/FAMA: Final adaptive moving averages
⚙️ Optimization Guide
Fast Limit (0.1 - 0.9)
Higher values (0.5-0.9): More responsive, better for volatile markets and lower timeframes
Lower values (0.1-0.3): Smoother response, better for stable markets and higher timeframes
Default 0.5: Balanced for most applications
Slow Limit (0.01 - 0.1)
Higher values (0.05-0.1): Less smoothing during consolidation, more signals
Lower values (0.01-0.03): Heavy smoothing during chop, fewer but cleaner signals
Default 0.05: Good noise filtering while maintaining responsiveness
Band Multiplier (0.5 - 3.0)
Adjust based on instrument volatility
Backtest to find optimal value for your specific market
1.5 works well for most forex and equity indices
Consider higher values (2.0-2.5) for cryptocurrencies
🎨 Visual Interpretation
The gradient visualization shows probability zones around the MESA line:
MESA line: The adaptive trend center
Band expansion: Indicates strong cycle detection and trending
Band contraction: Indicates consolidation or ranging market
Color intensity: Shows confidence in trend direction
💡 Best Practices
Let it adapt: Give the indicator 50+ bars to properly calibrate to the market
Combine timeframes: Use higher timeframe MESA for trend bias, lower for entries
Respect the bands: Price rarely stays outside bands for extended periods
Watch for compression: Narrow bands often precede explosive moves
Volume confirmation: Combine with volume for higher probability setups
📊 Optimal Timeframes
15m - 1H: Day trading with Fast Limit 0.6-0.8
4H - Daily: Swing trading with Fast Limit 0.4-0.6 (recommended)
Weekly: Position trading with Fast Limit 0.2-0.4
⚠️ Important Considerations
The indicator needs time to "learn" the market - avoid trading the first 50 bars after applying
Extreme gap events can temporarily disrupt cycle calculations
Works best in markets with detectable cyclical behavior
Less effective during news events or extreme volatility spikes
Consider the detected cycle period for position holding times
🔍 What Makes MESA Superior?
Compared to traditional indicators:
vs. Fixed MAs: Automatically adjusts to market conditions instead of using one-size-fits-all parameters
vs. Other Adaptive MAs: Uses true DSP mathematics rather than simple volatility adjustments
vs. Manual Optimization: Continuously re-optimizes itself in real-time
vs. Lagging Indicators: Hilbert Transform provides earlier trend change detection
🎓 Understanding Adaptation
The magic of MESA is that it solves the eternal dilemma of technical analysis: be fast and get whipsawed in chop, or be smooth and miss the early move. MESA does both by detecting when to be fast and when to be smooth.
Adaptation in Action:
Strong trend starts → MESA quickly detects phase change → Fast Limit kicks in → Early entry
Trend continues → Phase stabilizes → MESA maintains moderate speed → Smooth ride
Consolidation begins → Phase changes slow → Slow Limit engages → Whipsaw avoidance
🚀 Advanced Applications
Multi-timeframe confluence: Use MESA on 3 timeframes for high-probability setups
Divergence detection: Watch for MAMA/price divergences at band extremes
Cycle period analysis: The internal period calculation can guide position duration
Band squeeze trading: Narrow bands + MAMA/FAMA cross = high-probability breakout
Created by AlphaNatt - Based on John Ehlers' MESA research. For educational purposes. Always practice proper risk management. Not financial advice. Always DYOR.

Arnaud Legoux Gaussian Flow | AlphaNattArnaud Legoux Gaussian Flow | AlphaNatt
A sophisticated trend-following and mean-reversion indicator that combines the power of the Arnaud Legoux Moving Average (ALMA) with advanced Gaussian distribution analysis to identify high-probability trading opportunities.
🎯 What Makes This Indicator Unique?
This indicator goes beyond traditional moving averages by incorporating Gaussian mathematics at multiple levels:
ALMA uses Gaussian distribution for superior price smoothing with minimal lag
Dynamic envelopes based on Gaussian probability zones
Multi-layer gradient visualization showing probability density
Adaptive envelope modes that respond to market conditions
📊 Core Components
1. Arnaud Legoux Moving Average (ALMA)
The ALMA is a highly responsive moving average that uses Gaussian distribution to weight price data. Unlike simple moving averages, ALMA can be fine-tuned to balance responsiveness and smoothness through three key parameters:
ALMA Period: Controls the lookback window (default: 21)
Gaussian Offset: Shifts the Gaussian curve to adjust lag vs. responsiveness (default: 0.85)
Gaussian Sigma: Controls the width of the Gaussian distribution (default: 6.0)
2. Gaussian Envelope System
The indicator features three envelope calculation modes:
Fixed Mode: Uses ATR-based fixed width for consistent envelope sizing
Adaptive Mode: Dynamically adjusts based on price acceleration and volatility
Hybrid Mode: Combines ATR and standard deviation for balanced adaptation
The envelopes represent statistical probability zones. Price moving beyond these zones suggests potential mean reversion opportunities.
3. Momentum-Adjusted Envelopes
The envelope width automatically expands during strong trends and contracts during consolidation, providing context-aware support and resistance levels.
⚡ Key Features
Multi-Layer Gradient Visualization
The indicator displays 10 gradient layers between the ALMA and envelope boundaries, creating a visual "heat map" of probability density. This helps traders quickly assess:
Distance from the mean
Potential support/resistance strength
Overbought/oversold conditions in context
Dynamic Color Coding
Cyan gradient: Price below ALMA (bullish zone)
Magenta gradient: Price above ALMA (bearish zone)
The ALMA line itself changes color based on price position
Trend Regime Detection
The indicator automatically identifies market regimes:
Strong Uptrend: Trend strength > 0.5% with price above ALMA
Strong Downtrend: Trend strength < -0.5% with price below ALMA
Weak trends and ranging conditions
📈 Trading Strategies
Mean Reversion Strategy
Look for price entering the extreme Gaussian zones (beyond 95% of envelope width) when trend strength is moderate. These represent statistical extremes where mean reversion is probable.
Signals:
Long: Price in lower Gaussian zone with trend strength > -0.5%
Short: Price in upper Gaussian zone with trend strength < 0.5%
Trend Continuation Strategy
Enter when price crosses the ALMA during confirmed strong trend conditions, riding momentum while using the envelope as a trailing stop reference.
Signals:
Long: Price crosses above ALMA during strong uptrend
Short: Price crosses below ALMA during strong downtrend
🎨 Visualization Guide
The gradient layers create a "probability cloud" around the ALMA:
Darker shades (near ALMA): High probability zone - price tends to stay here
Lighter shades (near envelope edges): Lower probability - potential reversal zones
Price at envelope extremes: Statistical outliers - strongest mean reversion setups
⚙️ Customization Options
ALMA Parameters
Adjust period for different timeframes (lower for day trading, higher for swing trading)
Modify offset to tune responsiveness vs. smoothness
Change sigma to control distribution width
Envelope Configuration
Choose envelope mode based on market characteristics
Adjust multiplier to match instrument volatility
Modify gradient depth for visual preference (5-15 layers)
Signal Enhancement
Momentum Length: Lookback for trend strength calculation
Signal Smoothing: Additional EMA smoothing to reduce noise
🔔 Built-in Alerts
The indicator includes six pre-configured alert conditions:
ALMA Trend Long - Price crosses above ALMA in strong uptrend
ALMA Trend Short - Price crosses below ALMA in strong downtrend
Mean Reversion Long - Price enters lower Gaussian zone
Mean Reversion Short - Price enters upper Gaussian zone
Strong Uptrend Detected - Momentum confirms strong bullish regime
Strong Downtrend Detected - Momentum confirms strong bearish regime
💡 Best Practices
Use on clean, liquid markets with consistent volatility
Combine with volume analysis for confirmation
Adjust envelope multiplier based on backtesting for your specific instrument
Higher timeframes (4H+) generally provide more reliable signals
Use adaptive mode for trending markets, hybrid for mixed conditions
⚠️ Important Notes
This indicator works best in markets with normal price distribution
Extreme news events can invalidate Gaussian assumptions temporarily
Always use proper risk management - no indicator is perfect
Backtest parameters on your specific instrument and timeframe
🔬 Technical Background
The Arnaud Legoux Moving Average was developed to solve the classic dilemma of moving averages: the trade-off between lag and noise. By applying Gaussian distribution weighting, ALMA achieves superior smoothing while maintaining responsiveness to price changes.
The envelope system extends this concept by creating probability zones based on volatility and momentum, effectively mapping where price is "likely" vs "unlikely" to be found based on statistical principles.
Created by AlphaNatt - For educational purposes. Always practice proper risk management. Not financial advice. Always DYOR.

Scalping m15 indicator RovTradingScalping Indicator Combining UT Bot and Linear Regression Candles.
UT Bot uses ATR Trailing Stop to identify entry points.
Linear Regression Candles smooth price action and provide trend signals.
The indicator is suitable for scalping trading on the M15 timeframe.

Bollinger RSI + SuperTrend TrailingBollinger Band RSI buy and sell signals with a super trend trailing stop

ATR-BHEEM-NOCHANGE-CANDLESCandles remain normal — removed barcolor(barCol)
ATR trailing stop line still shows trend direction (green/red)
Optional buy/sell labels added only when trend flips
Clean and ready for intraday 1-min charts

MTRADE ATR SL FINDERAverage True Range Stop Loss Finder (ATR)
This indicator automatically calculates dynamic stop-loss levels based on market volatility using the Average True Range (ATR) formula.
It provides both Long and Short stop levels derived from ATR values and adapts them in real time as volatility changes.
🔍 Features
Adjustable ATR Length (default: 20)
Four smoothing methods: RMA, SMA, EMA, WMA
Configurable Multiplier (default: 1.5× ATR)
Real-time High (Short Stop) and Low (Long Stop) lines on the chart
A clean on-chart table displaying:
ATR value
High stop level (H)
Low stop level (L)
— all shown with 7-decimal precision for accurate readings
⚙️ Use Cases
Volatility-based stop-loss and take-profit placement
Risk management and trailing-stop automation
Intraday and swing trading systems using ATR-driven exits
🧠 Technical Details
Built in Pine Script v5
Supports up to 7 decimal precision (precision=7)
Works as an overlay, displaying ATR bands directly on price action
Fully customizable colors and smoothing logic
by fiyatherseydir

EMA × MOST CrossThe EMA × MOST Cross indicator combines the Exponential Moving Average (EMA) with the Moving Stop (MOST) system to identify early trend reversals and confirm trend continuation phases.
MOST acts as a dynamic trailing stop that adapts to price volatility, while EMA provides directional bias and short-term momentum confirmation.
A BUY signal is generated when EMA crosses above the MOST line, indicating a possible bullish reversal or trend continuation.
A SELL signal is triggered when EMA crosses below the MOST line, suggesting bearish continuation or reversal conditions.
The indicator colors bars according to the EMA–MOST relationship to visually represent trend strength:
🟩 Green tones → bullish bias (EMA and price above MOST)
🟥 Red tones → bearish bias (EMA and price below MOST)
🟦 Aqua → neutral phase or transition zone
How to use:
Works best on trending markets and mid-term timeframes (e.g., 1h, 4h, 1D).
Combine it with volume or structure-based confirmations for higher accuracy.
Use the built-in parameters to fine-tune sensitivity:
MOST MA length: adjusts the responsiveness of the MOST line.
MOST percent: defines the offset distance of the stop bands.
EMA length: defines the crossover sensitivity.
Updated settings:
Default MOST Length: 5
Default MOST Percent: 1.5%
Concept:
This script refines the traditional MOST logic by pairing it with an EMA cross mechanism, aiming to filter false reversals and improve entry timing. It’s designed for traders who prefer clear, visual cross-based trend confirmation while maintaining adjustable flexibility for different instruments.

Trend TraderThe Trend Trader indicator is a trend-following tool based on a triple EMA (Exponential Moving Average) setup designed to help traders identify market direction and potential reversal zones. It plots three customizable EMAs on the chart to highlight bullish and bearish momentum, then generates trade signals when price shows a strong likelihood of continuing in the direction of the prevailing trend.
EMA Alignment: The indicator checks for bullish stacking (fast EMA above medium, medium above slow) and bearish stacking (fast EMA below medium, medium below slow). This alignment defines the prevailing market trend.
Trend Validation: A user-defined lookback period ensures signals are only taken if the market recently displayed a stacked trend, thus filtering false entries during consolidations.
Signal Generation: Buy signals appear when price dips into the zone between the fast and medium EMAs during a bullish trend. Sell signals appear when price rallies into the zone between the fast and medium EMAs during a bearish trend.
Alerts: Built-in alerts notify traders of new trade opportunities without having to constantly watch the chart.
This indicator is suitable for swing trading and intraday strategies across multiple markets, including forex, stocks, indices, and crypto.
Suggested Strategy for Profitability
This tool is best used as part of a structured trend-trading plan. Below is a suggested framework:
Entry Rules
Long (Buy Trade):
Confirm that EMA alignment is bullish (EMA1 > EMA2 > EMA3).
Wait for a Buy Signal (triangle up below price).
Ensure the higher timeframe (e.g., 4H if trading 1H) trend is also bullish to filter trades.
Short (Sell Trade):
Confirm EMA alignment is bearish (EMA1 < EMA2 < EMA3).
Wait for a Sell Signal (triangle down above price).
Higher timeframe should also be bearish to increase probability.
Stop Loss
For long positions, place the stop loss just below EMA3 or the most recent swing low.
For short positions, place the stop loss just above EMA3 or the most recent swing high.
Take Profit
Conservative: Set TP at 1.5x to 2x the stop loss distance.
Aggressive: Trail stop loss below EMA2 (for longs) or above EMA2 (for shorts) to capture larger trends.
Risk Management
Use no more than 1–2% of account risk per trade.
Trade only when the signal aligns with overall market context (higher timeframe, support/resistance, or volume confirmation).
This indicator is very similar to the indicator "Trend Scalper" by the same developer, the difference is this indicator is used to just find the trade and hold the trade or to find the reversal of a trend instead of triggering alerts every time price enters between EMA1 and EMA2.
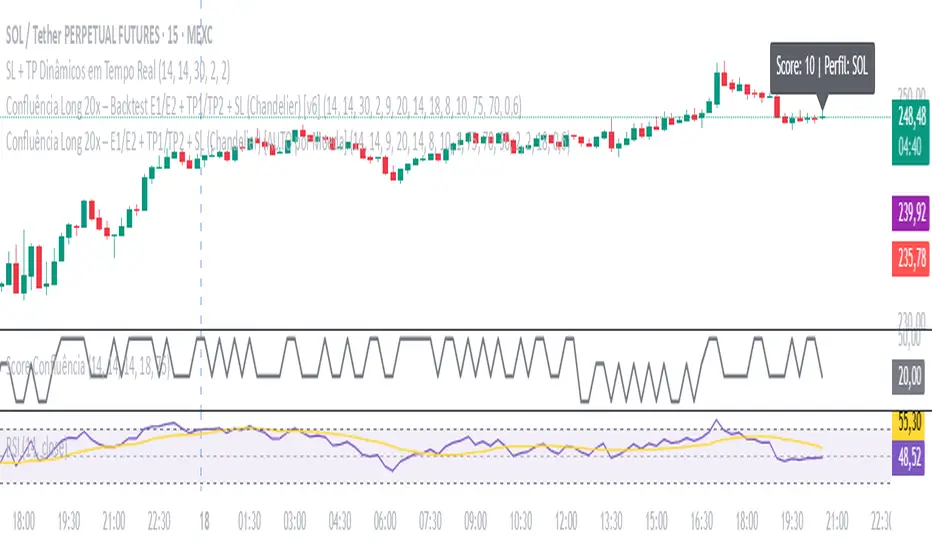
Long 20x - Very powerfull strategy - By M.LolasVery powerful strategy.
Refined strategy that encompasses 20× Long trades with E1/E2 entries, TP1/TP2 targets, and trailing stop-losses, for real-time trade monitoring.
By M. Lolas
QZ Trend (Crypto Edition) v1.1a: Donchian, EMA, ATR, Liquidity/FThe "QZ Trend (Crypto Edition)" is a rules-based trend-following breakout strategy for crypto spot or perpetual contracts, focusing on following trends, prioritizing risk control, seeking small losses and big wins, and trading only when advantageous.
Key mechanisms include:
- Market filters: Screen favorable conditions via ADX (trend strength), dollar volume (liquidity), funding fee windows, session/weekend restrictions, and spot-long-only settings.
- Signals & entries: Based on price position relative to EMA and EMA trends, combined with breaking Donchian channel extremes (with ATR ratio confirmation), plus single-position rules and post-exit cooldowns.
- Position sizing: Calculate positions by fixed risk percentage; initial stop-loss is ATR-based, complying with exchange min/max lot requirements.
- Exits & risk management: Include initial stop-loss, trailing stop (tightens only), break-even rule (stop moves to entry when target floating profit is hit), time-based exit, and post-exit cooldowns.
- Pyramiding: Add positions only when profitable with favorable momentum, requiring ATR-based spacing; add size is a fraction of the base position, with layers sharing stop logic but having unique order IDs.
Charts display EMA, Donchian channels, current stop lines, and highlight low ADX, avoidable funding windows, and low-liquidity periods.
Recommend starting with 4H or 1D timeframes, with typical parameters varying by cycle. Liquidity settings differ by token; perpetuals should enable funding window filters, while spot requires "long-only" and matching fees. The strategy performs well in trends with quick stop-losses but faces whipsaws in ranges (filters mitigate but don’t eliminate noise). Share your symbol and timeframe for tailored parameters.

Supertrend [TradingConToto]Supertrend — ADX/DI + EMA Gap + Breakout (with Mobile UI)
What makes it original
Supertrend combines trend strength (ADX/DI), multi-timeframe bias (EMA63 and EMA 200D equivalent), a structural filter based on the distance between EMA2400 and EMA4800 expressed in ATR units, and a momentum confirmation through a previous high breakout.
This is not a random mashup — it’s a sequence of filters designed to reduce trades in ranging markets and prioritize mature trends:
Direction: +DI > -DI (trend led by buyers).
Strength: ADX > mean(ADX) (avoids weak, choppy phases).
Short-term bias: Close > EMA63.
Long-term bias: Close > EMA4800 ≈ EMA200 daily on H1.
Momentum: Close > High (immediate breakout).
Structure: (EMA2400 − EMA4800) > k·ATR (ensures separation in ATR units, filters out flat phases).
Entries & exits
Entry: when all six conditions are met and no open position exists.
Exit: if +DI < -DI or Close < EMA63.
Visuals: EMA63 is painted green while in position and red otherwise, with a supertrend-style band; “BUY” labels appear below the green band and “SELL” labels above the red band.
UI: includes a compact table (mobile-friendly) showing the state of each condition.
Default parameters used in this publication
Initial capital: 10,000
Position size: 10% of equity (≤10% per trade is considered sustainable).
Commission: 0.01% per side (adjust to your broker/market).
Slippage: 1 tick
Pyramiding: 0 (only one position at a time)
Adjust commission/slippage to match your market. For US equities, commissions are often per share; for spot crypto, 0.10–0.20% total is common. I publish with 0.01% per side as a conservative example to avoid overestimating results.
Recommended backtest dataset
Timeframe: H1
Multi-cycle window (e.g. 2015–today)
Symbols with high liquidity (e.g. NASDAQ-100 large caps, or BTC/ETH spot) to generate 100+ trades. Avoid cherry-picked short windows.
Why each filter matters
+DI > -DI + ADX > mean: reduce counter-trend trades and weak signals.
Close > EMA63 + Close > EMA4800: enforce trend alignment in short and long horizons.
Breakout High : requires immediate momentum, avoids early entries.
EMA gap in ATR units: blocks flat or compressed structures where EMA200D aligns with price.
Limitations
The breakout filter may skip healthy pullbacks; the design prioritizes continuation over perfect entry price.
No fixed trailing stop/TP; exits depend on trend degradation via DI/EMA63.
Results vary with real costs (commissions, slippage, funding). Adjust defaults to your broker.
How to use
Apply it on a clean chart (no other indicators when publishing).
Keep in mind the default parameters above; if you change them, mention it in your notes and use the same values in the Strategy Tester.
Ensure your dataset produces 100+ trades for statistical validity.

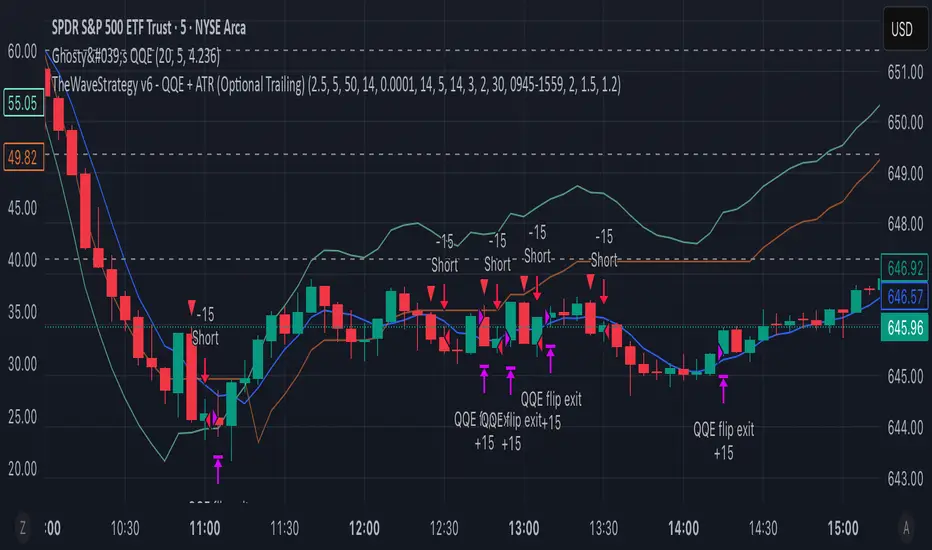
TheWaveStrategy v6 - QQE + ATR (Optional Trailing)New Version Of the wave with QQE and ATR
• Compiles cleanly in Pine v6.
• Optional trailing stop toggle via useTrailingATR.
• Market exit uses strategy.close() properly.
• ATR spike filter uses 5m ATR.
• QQE confluence with 30m timeframe included.
Laguerre-Kalman Adaptive Filter | AlphaNattLaguerre-Kalman Adaptive Filter |AlphaNatt
A sophisticated trend-following indicator that combines Laguerre polynomial filtering with Kalman optimal estimation to create an ultra-smooth, low-lag trend line with exceptional noise reduction capabilities.
"The perfect trend line adapts to market conditions while filtering out noise - this indicator achieves both through advanced mathematical techniques rarely seen in retail trading."
━━━━━━━━━━━━━━━━━━━━━━━━━━━━━━━━━━━━━━━━
🎯 KEY FEATURES
Dual-Filter Architecture: Combines two powerful filtering methods for superior performance
Adaptive Volatility Adjustment: Automatically adapts to market conditions
Minimal Lag: Laguerre polynomials provide faster response than traditional moving averages
Optimal Noise Reduction: Kalman filtering removes market noise while preserving trend
Clean Visual Design: Color-coded trend visualization (cyan/pink)
━━━━━━━━━━━━━━━━━━━━━━━━━━━━━━━━━━━━━━━━
📊 THE MATHEMATICS
1. Laguerre Filter Component
The Laguerre filter uses a cascade of four all-pass filters with a single gamma parameter:
4th order IIR (Infinite Impulse Response) filter
Single parameter (gamma) controls all filter characteristics
Provides smoother output than EMA with similar lag
Based on Laguerre polynomials from quantum mechanics
2. Kalman Filter Component
Implements a simplified Kalman filter for optimal estimation:
Prediction-correction algorithm from aerospace engineering
Dynamically adjusts based on estimation error
Provides mathematically optimal estimate of true price trend
Reduces noise while maintaining responsiveness
3. Adaptive Mechanism
Monitors market volatility in real-time
Adjusts filter parameters based on current conditions
More responsive in trending markets
More stable in ranging markets
━━━━━━━━━━━━━━━━━━━━━━━━━━━━━━━━━━━━━━━━
⚙️ INDICATOR SETTINGS
Laguerre Gamma (0.1-0.99): Controls filter smoothness. Higher = smoother but more lag
Adaptive Period (5-100): Lookback for volatility calculation
Kalman Noise Reduction (0.1-2.0): Higher = more noise filtering
Trend Threshold (0.0001-0.01): Minimum change to register trend shift
Recommended Settings:
Scalping: Gamma: 0.6, Period: 10, Noise: 0.3
Day Trading: Gamma: 0.8, Period: 20, Noise: 0.5 (default)
Swing Trading: Gamma: 0.9, Period: 30, Noise: 0.8
Position Trading: Gamma: 0.95, Period: 50, Noise: 1.2
━━━━━━━━━━━━━━━━━━━━━━━━━━━━━━━━━━━━━━━━
📈 TRADING SIGNALS
Primary Signals:
Cyan Line: Bullish trend - price above filter and filter ascending
Pink Line: Bearish trend - price below filter or filter descending
Color Change: Potential trend reversal point
Entry Strategies:
Trend Continuation: Enter on pullback to filter line in trending market
Trend Reversal: Enter on color change with volume confirmation
Breakout: Enter when price crosses filter with momentum
Exit Strategies:
Exit long when line turns from cyan to pink
Exit short when line turns from pink to cyan
Use filter as trailing stop in strong trends
━━━━━━━━━━━━━━━━━━━━━━━━━━━━━━━━━━━━━━━━
✨ ADVANTAGES OVER TRADITIONAL INDICATORS
Vs. Moving Averages:
Significantly less lag while maintaining smoothness
Adaptive to market conditions
Better noise filtering
Vs. Standard Filters:
Dual-filter approach provides optimal estimation
Mathematical foundation from signal processing
Self-adjusting parameters
Vs. Other Trend Indicators:
Cleaner signals with fewer whipsaws
Works across all timeframes
No repainting or lookahead bias
━━━━━━━━━━━━━━━━━━━━━━━━━━━━━━━━━━━━━━━━
🎓 MATHEMATICAL BACKGROUND
The Laguerre filter was developed by John Ehlers, applying Laguerre polynomials (used in quantum mechanics) to financial markets. These polynomials provide an elegant solution to the lag-smoothness tradeoff that plagues traditional moving averages.
The Kalman filter, developed by Rudolf Kalman in 1960, is used in everything from GPS systems to spacecraft navigation. It provides the mathematically optimal estimate of a system's state given noisy measurements.
By combining these two approaches, this indicator achieves what neither can alone: a smooth, responsive trend line that adapts to market conditions while filtering out noise.
━━━━━━━━━━━━━━━━━━━━━━━━━━━━━━━━━━━━━━━━
💡 TIPS FOR BEST RESULTS
Confirm with Volume: Strong trends should have increasing volume
Multiple Timeframes: Use higher timeframe for trend, lower for entry
Combine with Momentum: RSI or MACD can confirm filter signals
Market Conditions: Adjust noise parameter based on market volatility
Backtesting: Always test settings on your specific instrument
━━━━━━━━━━━━━━━━━━━━━━━━━━━━━━━━━━━━━━━━
⚠️ IMPORTANT NOTES
No indicator is perfect - always use proper risk management
Best suited for trending markets
May produce false signals in choppy/ranging conditions
Not financial advice - for educational purposes only
━━━━━━━━━━━━━━━━━━━━━━━━━━━━━━━━━━━━━━━━
🚀 CONCLUSION
The Laguerre-Kalman Adaptive Filter represents a significant advancement in technical analysis, bringing institutional-grade mathematical techniques to retail traders. Its unique combination of polynomial filtering and optimal estimation provides a clean, reliable trend-following tool that adapts to changing market conditions.
Whether you're scalping on the 1-minute chart or position trading on the daily, this indicator provides clear, actionable signals with minimal false positives.
"In the world of technical analysis, the edge comes from using better mathematics. This indicator delivers that edge."
━━━━━━━━━━━━━━━━━━━━━━━━━━━━━━━━━━━━━━━━
Developed by AlphaNatt | Professional Quantitative Trading Tools
Version: 1.0
Last Updated: 2025
Pine Script: v6
License: Open Source
Not financial advice. Always DYOR

5m Exit AlertsThese can help a lot with Daytrading if you don't have a price target in mind when there's no clear resistance / support nearby, and you don't trust the market enough to hold it as a swing trade.
Keep in mind that its main purpose is to give you a "warning" that it might be good to look at your screen, instead of guaranteeing you "now is the best time to exit". You won't reach high winning stats by blindly following this alert.
"A Exit LONG":
(I'm using letters instead of numbers for all Exit alerts to make sure I don't accidentally confuse Enter and Exit alerts).
There are 4 conditions that might trigger it. The reasons show up in the exit alert message (unfortunately only as a number, since alert messages can't have "dynamic text" in TradingView), and can also be displayed as symbols in the chart (see image above - make sure to enable "Show Signals" in the indicator settings first though).
Here are the conditions sorted from best to worst:
Technical reversal: Bearish Hammer candle with Volume > 2 * avg volume (of last 30 candles), when 5m candle closed. Reversal very likely. This is usually the best time to take your gains for the rest of the day.
EMA 3/8 cross: standard 5m EMA 3/8 cross, indicating a trend reversal, or at least a pullback. Can also be helpful to detect double tops / double bottoms.
Trailing Stop Loss: Crossed below 30m EMA 8, 5m candle closed. This is a "fallback" alert in case EMA 3 was already below EMA 8 before you set up the alert. It's not unlikely that the stock might go further down to VWAP, so depending on the chart and market this might be a good opportunity to save the gains you have left.
"Final" Stop Loss: Crossed below VWAP. Usually not a good sign. If you entered around VWAP your losses shouldn't be big yet, but if you plan on holding the stock the Daily chart and market outlook should better be quite convincing, and you wouldn't have needed to use this alert in the first place.
Keep in mind these work of course best if you picked a "good" stock: clear movement, tidy price action, high volume. Otherwise alerts are more likely to be triggered redundantly.
Always consider how the market and stock looks like, then decide whether to exit or not! Usually it makes sense to wait a bit to see f. e. whether the stock bounces off the 30m EMA 8, and it's just a pullback.
"B Enter SHORT":
Similar, but for shorts...
"C 1m Scalp LONG" + "D 1m Scalp SHORT":
Simple Scalping alert for EMA 3/8 cross on a 1m chart - but without needing to use a 1m chart to set it up!
Unfortunately it's not as accurate as manually setting this alert up on a 1m chart. It might be an advantage though that it sometimes is triggered 1-2 min later, since this means there are less redundant triggerings.
It can be useful esp. on high momentum trades, but I honestly haven't used it in a looong while.
"X Candle Close":
same as in 5m Entry indicator: triggered when 5m candle is confirmed
"Z Trend Change: UP" + "Z Trend Change: DOWN":
This one is meant to be used only on SPY: It alerts you when SPY is changing its trending direction, which might mean entering or closing existing trades.
I have therefore set it up to never end (by setting it to "Once Per Bar Close" in the alert settings).
It's based on DMI positive or negative being > 25. I had it based on VWAP at the beginning, but there were days where it was triggered every 5 minutes...
More infos: www.reddit.com

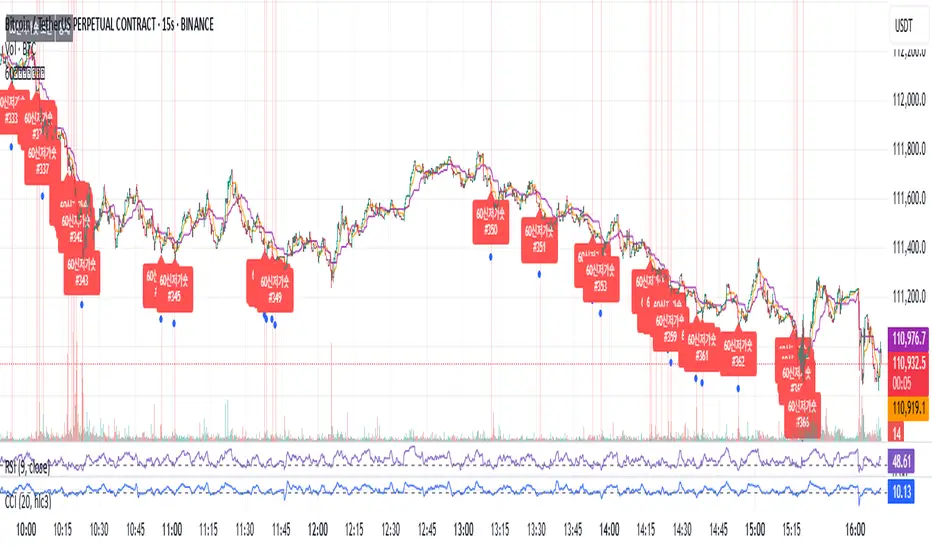
60 신저가 숏_신저가“60-Day New Low Short (New Low)” is a momentum breakdown setup that sells short when price prints a fresh 60-day low, aiming to ride continued weakness after support fails.
Enter on the breakdown close (or next open) with confirmation such as expanding volume, relative weakness vs. a benchmark, and price below the 50/200-day MAs.
Manage risk with a stop above the recent swing high or 20-day high; take profits via ATR-based targets or a trailing stop, and be cautious around earnings/news catalysts.
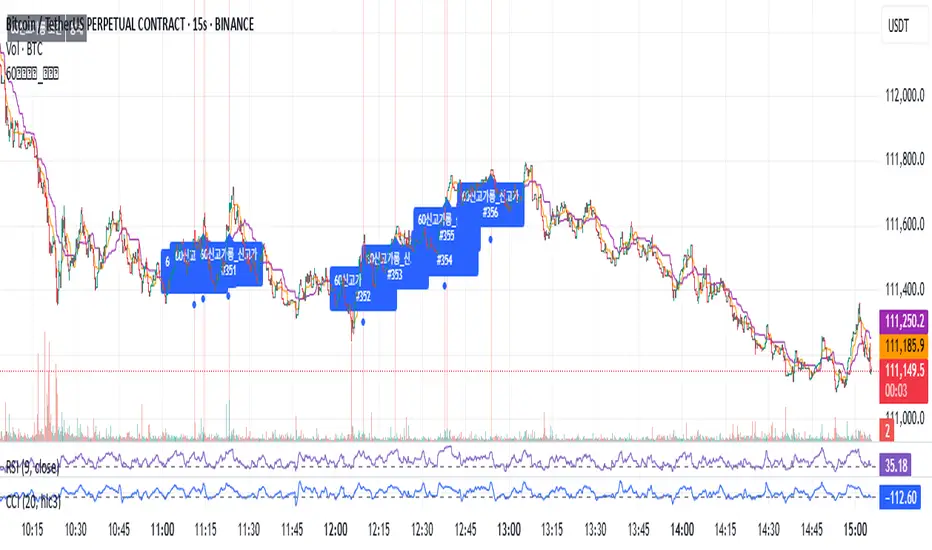
60 신고가 롱_신고가“60-Day New High Long (New High)” is a momentum breakout setup that buys when price prints a fresh 60-day high, expecting continuation once resistance gives way.
Enter on the breakout close (or next open) with confirmation such as expanding volume, relative strength vs. a benchmark, and price above the 50/200-day MAs.
Manage risk with a stop below the recent swing low or 20-day low; take profits via ATR-based targets or a trailing stop, and be cautious around earnings/news catalysts.
60 신저가 숏_신저가“60-Day New Low Short (New Low)” is a momentum breakdown setup that sells short when price prints a fresh 60-day low, aiming to ride continued weakness after support fails.
Enter on the breakdown close (or next open) with confirmation such as expanding volume, relative weakness vs. a benchmark, and price below the 50/200-day MAs.
Manage risk with a stop above the recent swing high or 20-day high; take profits via ATR-based targets or a trailing stop, and be cautious around earnings/news catalysts.
