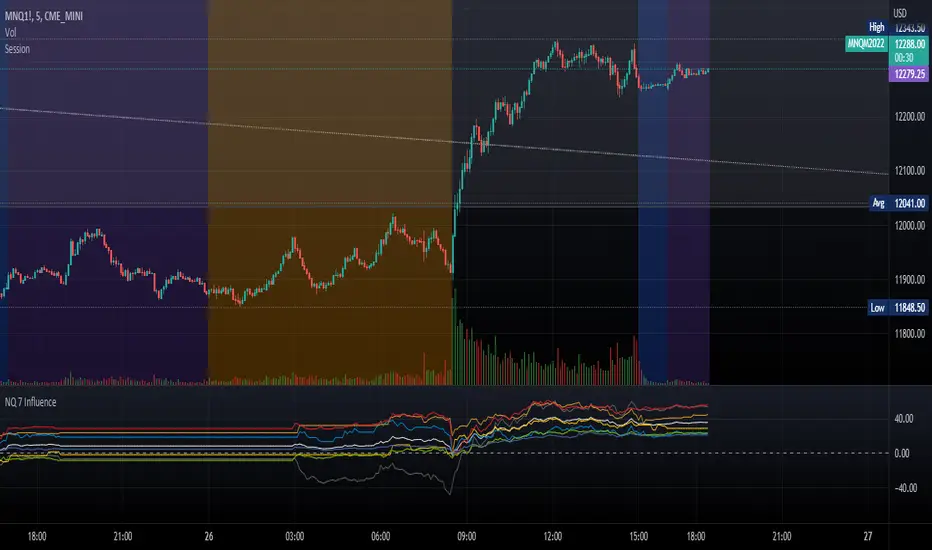
RaenonX - NQ 7 InfluenceShows the top 7 NASDAQ 100 component stock (AAPL, MSFT, GOOG, AMZN, TSLA, NVDA, FB) influence as plot.
ค้นหาในสคริปต์สำหรับ "NQ"
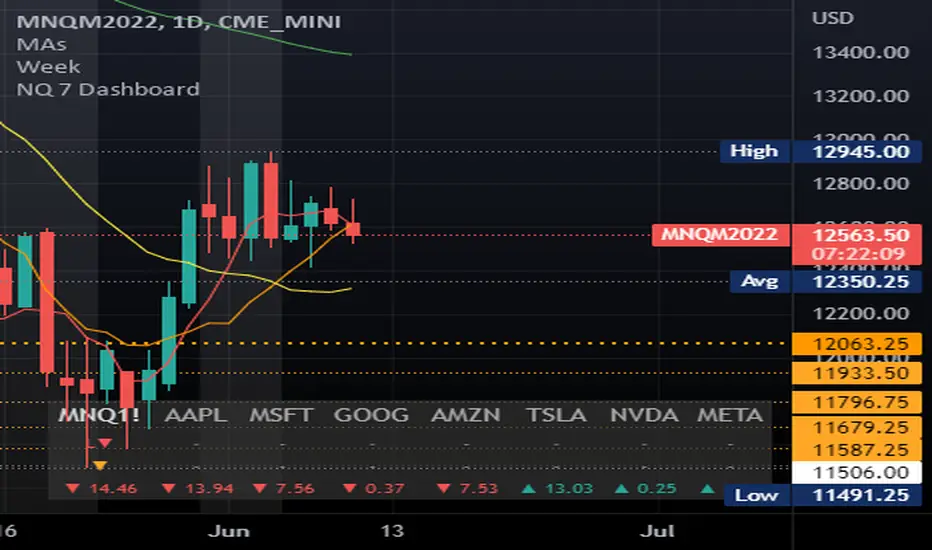
RaenonX - NQ 7 DashboardPlaces a table at the bottom right side showing the top 7 stocks (AAPL, MSFT, GOOG, AMZN, TSLA, NVDA, FB) current position for the given MA and daily position.
The 2nd row shows the current position related to the prior day open/high/low. There are 4 possible values:
H+ : Higher than the prior day high - indicates bullish in daily timeframe.
O+ : Higher than the prior day open - indicates pro-bullish consolidation in daily timeframe.
L+ : Higher than the prior day low - indicates pro-bearish consolidation in daily timeframe.
L- : Lower than the prior day high - indicates bearish in daily timeframe.
The 3rd row shows the current position related to the given SMA parameters. The default period is 22 using 5 minutes timeframe. There are 4 possible values:
B+ : Higher than the SMA upper band - indicates bullish movement.
+ : Higher than the SMA - indicates pro-bullish movement, possibly consolidating.
- : Lower than the SMA - indicates pro-bearish movement, possibly consolidating.
B- : Lower than the SMA lower band - indicates bearish movement.
trading YM based on pair tradingThis is inspired by some online free webinars. Didn't pay for the strategy/ course. I just figured it out myself. So there might be problem with this strategy.
Theory: It is based on something called cointegrated. Cointegration means the difference between 2 securities are stable in long term. When the difference is bigger / smaller than normal, then there is space to make profit. You can use some tests to check if they are cointegration. I don't think YM and NQ are strictly cointegrated. I used other platform to test the cointegration. They are not cointegrated. There are multiple ways to do pair trading. I use "Y = A - B * (A /B)" to do this. The back test on tradingview can only trade one security. This is not pair trading in this backtest. But only do long and short based on the theory of pair trading. The max drawdown is huge. You should be careful before doing anything with this strategy.
Welcome to give some advice on improvement.

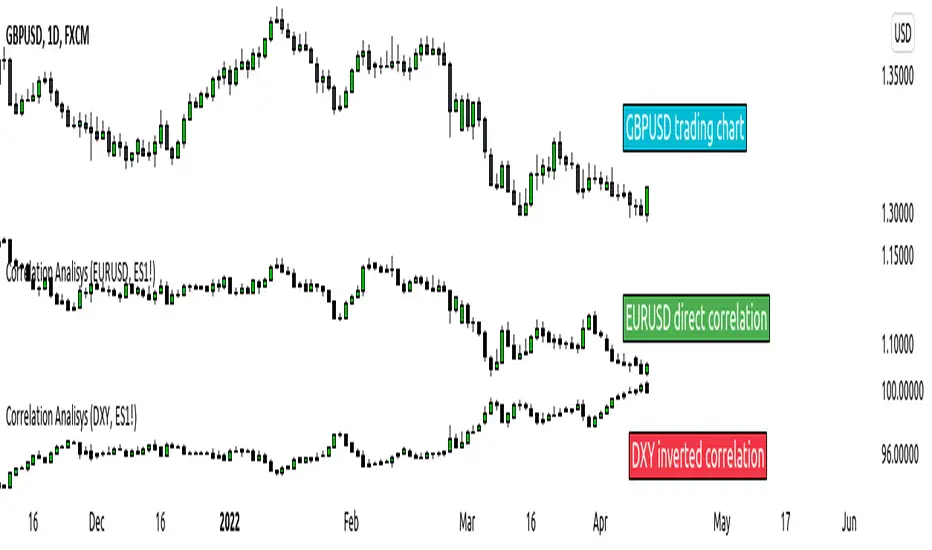
ICT index correlated market indicatorThis is not a real indicator, but is what ICT use as indicator for trading futures indexes.
it can only display SP500, Dow Jon Industrial Average and Nasdaq, if someone want other market can copy the code and change some parameters (is more easy than it can appear)
A good idea is using this other market on backtest to confirm the divergence idea of Linda Raske, than use it to spot quickly in real market.
Another idea published by ICT is the "hidden entry pattern", the entry signal appear in ES or YM but I trade NQ for volatility, so I use the trigger of SP500 or Dow to enter in Nasdaq.
Rember always don't trust anybody, do your own backtest and research!
Up Volume vs Down VolumeCalculating NYSE Up Volume (UPVOL.NY) vs NYSE Down Volume (DNVOL.NY). The triangles appear when the ratio exceeds 90% in either direction.
Also has the option to switch to NQ, US, DJ, AM, or AX tickers.
Credit to @MagicEins for the original script:

Multi Day vWAP (Customizable) with AverageIntroducing the Multi-Day vWAP indicator that is fully customizable with average indicator option.
High level overview (default settings):
Default is 10 plots with each setting 1 day apart (1-10 day look back)
Labels for each plot are turned on by default (labels will default to your value, more below)
Use Style tab in options to change colors, plot style, and turn on/off individual plots
Average is turned off by default (style panel will show it's on-- go to Inputs panel and select "Show vWAP Average" to turn on)
Best use case is go to Visibility Panel in options and turn off for Days, Weeks, and Months
To turn off all labels at once go to Style tab and unselect "Labels" checkbox
If you want plots to be as small as possible in Inputs panel set the Plot Width to 0 (zero)
Detail Overview
This indicator will plot your custom daily vWAP values.
You can change the lookback period. If you change the lookback period the label will match your custom value.
For instance, if you change vWAP 1 value to "5", the label for this plot will be 5.
Average Notes:
The average will average all the vWAP values by the divisor. The default is to average all values by 10.
The average will always start to plot from the shortest lookback period. It is not possible to have the average plot before that point.
Trading Tips (default settings)
The simple way to use the vWAP is to treat them as magnets.
For intance,
Generally if price is trading below all the vWAP plots the chart is in a momentum short enviroment. All vWAP areas can be used for upside resistance/reaction areas.
If price is trading above the chart is in a momentum long enviroment and pullbacks can to vWAP levels can be looked as areas of support/reaction.
For instance:
Price is above the current day vWAP and looking to test the previous day vWAP value.
As it approaches the 2 value you are expecting this area to be a reaction area (good trade entry area) for a continuation short trade. Possibly to check back into the current day vWAP value.
I should share that this is a simple way to trade with the vWAP (true success with vWAP is understanding that price trades in vWAP channels).
Stacking and Strong Momentum
The other pattern you should look for is stacking.
For instance on this CL chart:
This chart is strong momentum long.
All 10 day vWAP plots are stacked on top of each other.
Previous action tested below all vWAPs. Price traded thru and came back and retested. Finally closing above all and above the vWAP avearge (red).
When the day vWAP was broke the next target you look for is the 2 vWAP. This reaction area held up and momentum long continued and continuing to trade above current day vWAP.
7 Day Rolling Example (Larger Timeframe)
Another great way to use this indicator is to customize the values for rolling 7 days (5 days for cash markets).
To do this set values to: 7, 14, 21, 28, 35, 42, 49, 56, 63, 70
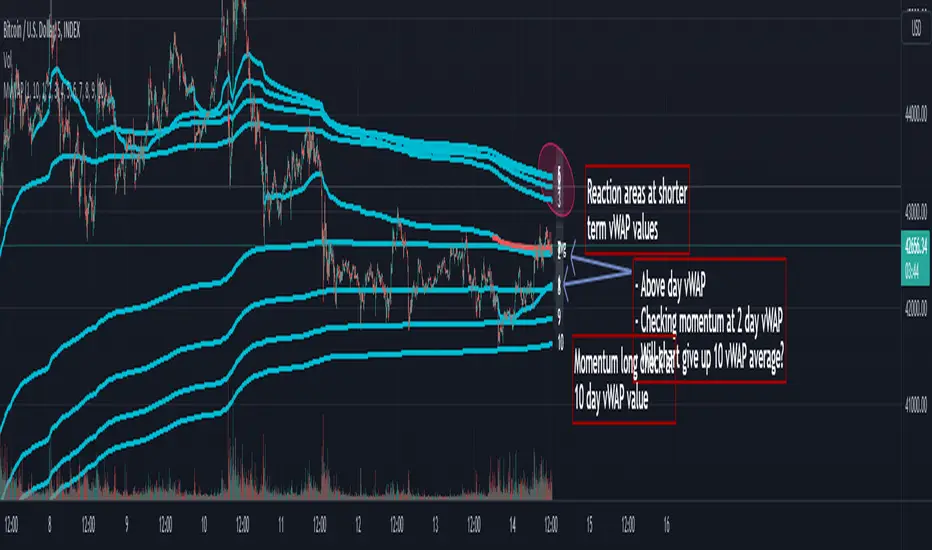
For instance, this BTC chart:
This chart provides a good example of what you'll find when a chart is at a pivot point.
Price is checking in at the average to remain momentum long.
Upside longer term vWAP plots have been tested and had expected reaction.
Price is trading above the shorter term values.
Simple TA here will note if chart continues to trade above and takes out upper vWAPs long momentum is gaining ground.
On the downside if price trades thru the lower vWAP plots you would expect further downside. In this scenario you would be mindful to expect upside tests before (which could be good entry/reaction areas).
NQ example with 7 day values:
Overall chart is momentum short.
7 is above 14, 21
Maybe early sign of bottom.
If price takes out these values and holds above the buyers have quite a few challenges above.
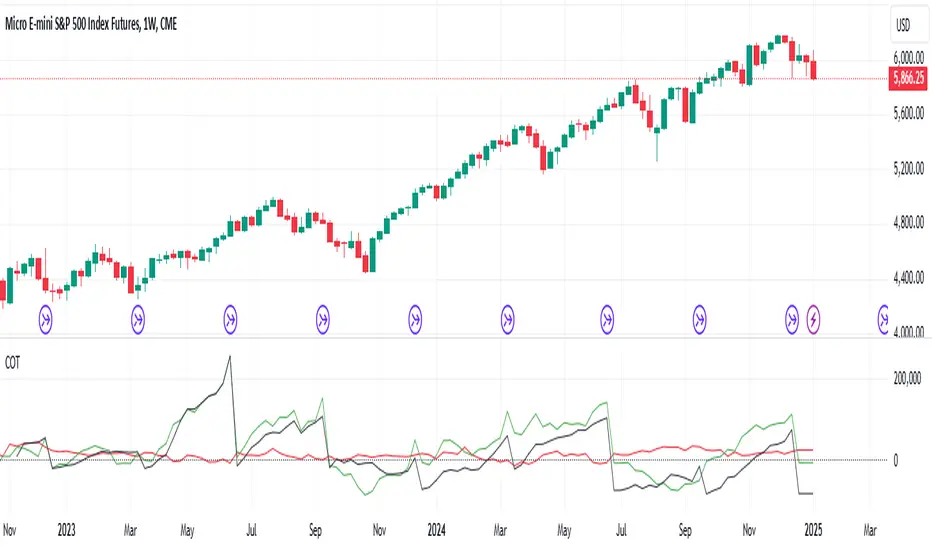
CoT data with OpenInterestDisplays COT data based on the "Disaggregated Commitments of Traders" report for Futures of the CFTC.
It does make accesible the following symbols:
ZB
ZN
ZS
ZM
ZL
ZC
ZW
KE
HE
LE
GC
SI
HG
CL
HO
RB
NG
6A
6B
6C
6E
6J
6S
SB
KC
CC
CT
ES
RTY
YM
NQ
PA
PL
AUP
HRC
EH
BB
ZR
ZO
DC
OJ
LBS
GF
SP
DJIA
6N
6L
VX
6M
6R
6Z
ZT
ZF
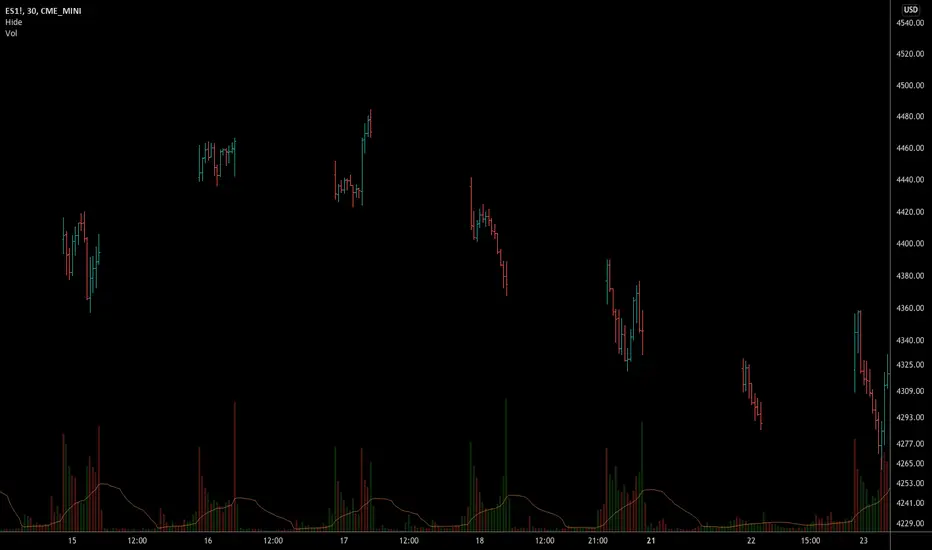
[FN] Strategy - Store Level on ConditionThis is a function that you can use in strategies. Not a strategy in and of itself.
Example thumbnail is showing the function applied to a strategy.
Oftentimes, I am asked a question regarding how to hold a variable at a specific, constant level over a conditional period of time. This question is always asked in a very long convoluted way like "I want the strategy to know what the high of the last pivot was while I'm in a long." or some other variation of wanting a script to remember something from prior bars.
This function is designed to store a price or some numeric level on the bar that your conditional (bool) statements determine that it should be stored. In this construct, you would set conditional statement(s) to flip the 'hold condition' to be true on the next bar, then hold that value until either the "hold condition" is no longer true or the initial conditions trigger again, causing an update to the level that you want to capture.
You still have to come up with the logic for the start condition and hold condition on your own, but I've provided an example that should give you an idea of how to accomplish this and customize/deploy the function for your purposes.
The function will return 'na' when neither the start condition nor hold condition are true. There's multiple ways to implement this and variations on how the level is chosen. I've written extensive notes in the script to guide you through the logic behind the function. My hope is that it will be useful to those trying to build strategies or anyone attempting to get their script to remember a level under given conditions.
In the thumbnail example, the take profit level is defined at the beginning of the trade and held until the take profit order executes. The order execution is a separate matter. However, storing the take-profit level at a static value is key to telling the strategy.exit() function what price to execute a limit exit order at.
Example: strategy.exit("Exit Long", from_entry = "long", qty_percent = 100, limit = stored_value)
Let me know how it works out for you and if I can be of any assistance.
Note: Strategy results are mainly derived from the fact that the strategy is long-only, the NQ only goes up, and there is no stop loss in place. So don't ask for the specific strategy, because unless you're trading a single contract with a $500,000 account, you'll probably get liquidated using this strategy as it is presented.

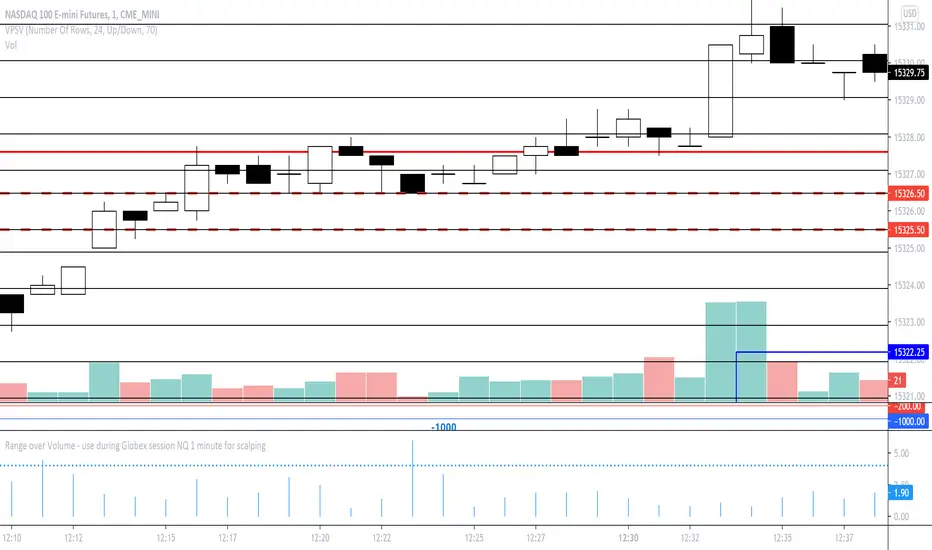
Range over Volume This is a scalping aid for NQ in the 1 minute time range for the Globex session.
Mathematically, the plot is range in ticks divided by 0.1*volume
This returns a histogram plot for RoV (range over volume)
The idea is that candles that ascribe a larger range with minimal volume does because there is unilateral aggression from the buy side, or sell side, and the subsequent behavioural outcome of this will either be an extension of that aggression unilaterally, or commonly, a counter to that aggression!
Wait for a candle to close with the RoV above 4.00. For that candle which formed the RoV above 4.00, plot the highs and lows of that candle and draw a 1.618x and -0.618x Fibonacci extension across it.
Enter short on the -0.618x and take profits at the -1.618x. Use the low of the ROV > 4 candle as a protective stop
Enter long on the 1.618 and take profits at 2.618. Use the high of the ROV > 4 candle as a protective stop
Michigandolf's 30min Opening RangeThis script plots the 30min Opening Range as well as the previous day's high & low.
Description:
Blue Line = Top of the 30min Opening Range for the session
Pink Line = Bottom of the 30min Opening Range for the session
White Line = Mid-Point of the 30min Opening Range for the session
White Transparent Area = The full range of the 30min Opening Range
Green Line = Yesterday's High for the session
Red Line = Yesterday's Low for the session
Use:
The Opening Range will continue to expand until the first 30minutes of trading has passed, at which point the range will lock in place for the remainder of the trading session. Many traders use these important levels to gauge trade entries and exits (e.g. Mark Fisher's ACD strategy).
This script does not work currently work for futures (e.g. ES, NQ, RTY) due to the session start time. Will configure for futures trading in a future update.

Volatility based Standarde Deviation and Fib. Pivot PointsThis indicator plots Standard deviation levels and Fib. Pivot Points. I prefer to use only SD levels but Fib. levels also come handy in providing support and resistance.
How to use this indicator:
You have to manually enter instrument's Closing Price / Settlement Price and VIX closing price to draw each day's levels.
For NQ, I use VXN closign price and for ES or RTY, I use VIX closing price.
This indicator can be used on individual stocks and forex pairs.

Hide Extended Hours/non-intraday American BarsOnly works with American bar style.
Not works with Candles.
--------
This script can hide the extended hours/non-intraday bars and leave the intraday bars only, especially for future users, such as ES/NQ/RTY/YM, etc.,.
Now you can find the intraday support/resistance quite easily!
Example, as a ES investor, you can easily find the intraday support/resistance level ,which is almost equal to SPY / SPX , no longer need to check SPY / SPX separately again, saving your time a lot.
--------
IMPORTANT INSTRUCTION
In order to make the script work, you have to bring it to the most top visual layer.
Please do as the following steps:
Add the script to chart
Hover mouse on the script name, and tap the right-most 'more' button (which appears as 3 dots)
Select "Visual Order", then select "Bring to front".
Done!
Also, in order to have a better view effect and make the bars COMPLETELY "Hidden", you can adjust the hidden bar color in the "setting" menu to the exact color of your chart background.

Hide extended hours/non-intraday barsEspecially for future users, such as ES/NQ/RTY/YM, etc., this script can hide the extended hours/non-intraday bars and leave the intraday bars only.
With this script , you can find the intraday support/resistance quite easily!
Example, if you are a ES investor, you can easily find the intraday support/resistance level ,which is almost equal to SPY, with this script, and no need to check SPY separately again , saving your time a lot.
Note: Please couple this script with American Bars. If you use candle charts, the upper/lower pins of the candle can't be hidden with the bars together, which is restricted by the code editor itself...
Cowabunga System from babypips.comPlease do read the information below as well, especially if you are new to Forex.
The Cowabunga System is a type of Mechanical Trading System that filters trades based on the trend of the 4 hour chart with EMAs and some other familiar indicators (RSI, Stochastics and MACD) while entering trades base on 15 minute chart.
I have coded (quite amateurishly) the basic system onto a 15 minute chart (the 4 hour settings are coded as well). The author says the system is to be traded off the 15 minute chart with the 4 hour chart only as a reference for trend direction.
4 Hour Chart Settings
5 EMA
10 EMA
Stochastics (10,3,3)
RSI (9)
Then we move onto the 15 minute chart, where he gives us the trade entry rules.
15 Minute Chart Settings
5 EMA
10 EMA
Stochastics (10,3,3)
RSI (9)
MACD (12,26,9)
Entry Rules - long entry rules used, obviously reverse these for shorting.
1. EMA must cross above the 10 EMA.
2. RSI must be greater than 50 and not overbought.
3. Stochastic must be headed up and not be in overbought territory.
4. MACD histogram must go from negative to positive OR be negative and start to increase in value.
What I did.
1. Set the RSI and Stochastic levels to avoid entries when they indicate overbought conditions for long and oversold conditions for short (80 and 20 levels).
2. Users can input specific times they want to backtest.
3. User's can configure profit targets, trailing stops and stops. Default is set it to was 100 pips profit target with a 40 pip trailing stop. (Note, when you are changing these values, please note that each pip is worth 10, so 100 pips is entered as 1000.)
The Cowabunga System from babypips.com is another popular and active system. The author, Pip Surfer, continues to post wins and losses with this system. It shows there is a lot of honesty and integrity with this system if the author keeps up to date even 10 years later and is not afraid of sharing the times the system causes losses.
As an example of this, here is post he shared just last week . It's almost like a journal, he gives specific times and reasons why he entered, lets the readers know when he was stopped out, etc. I think that what he does is equally important as his system.
To read more about this system, visit the thread on babypips.com, click here.
