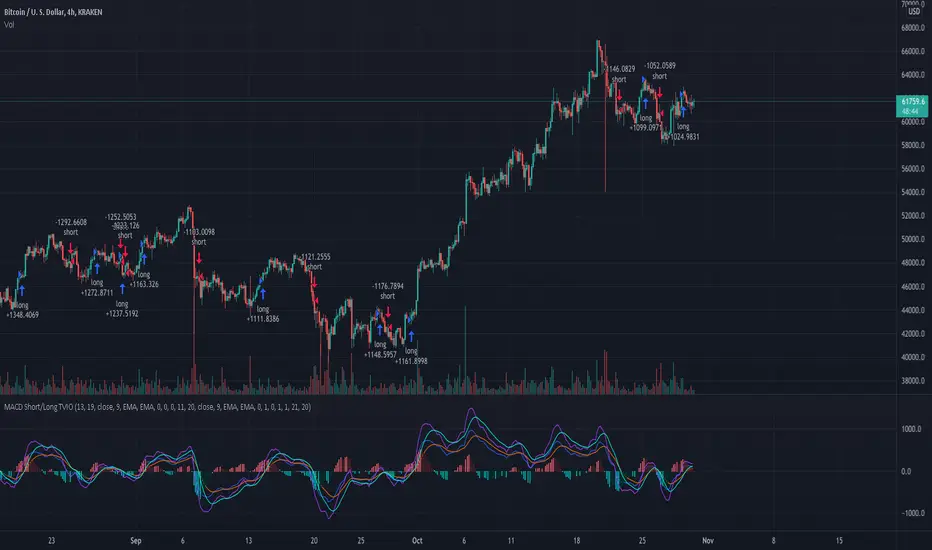
MacD Short and/or Long with Bi-Directional TP and SL This tool allows you to test any variable value for MacD and Signal for going Long or Short with each market direction having customizable values for stop loss and take profit.
For example, sometimes the MacD and Signal values are better with different lengths between Short and Long. You can use this tool to see them overlaid and determine the best settings for going one direction or the other.
This script was preset for use with XBTUSD on the 4 hour time frame. Another example with this in mind, is take profits and stop losses might not work in the Long market direction but going Short does! Without this tool that would be hard to see since typically stop loss and take profit is applied to both directions. I found with this tool that a 20% take profit seems to be a good sweet spot for going short with this strategy.
You can customize which MacD histogram you see by going to the style section and turning off the Short or Long parameters so you can see only 1 histogram at a time if you wish.
If you have any questions, please PM me.
ค้นหาในสคริปต์สำหรับ "MACD"
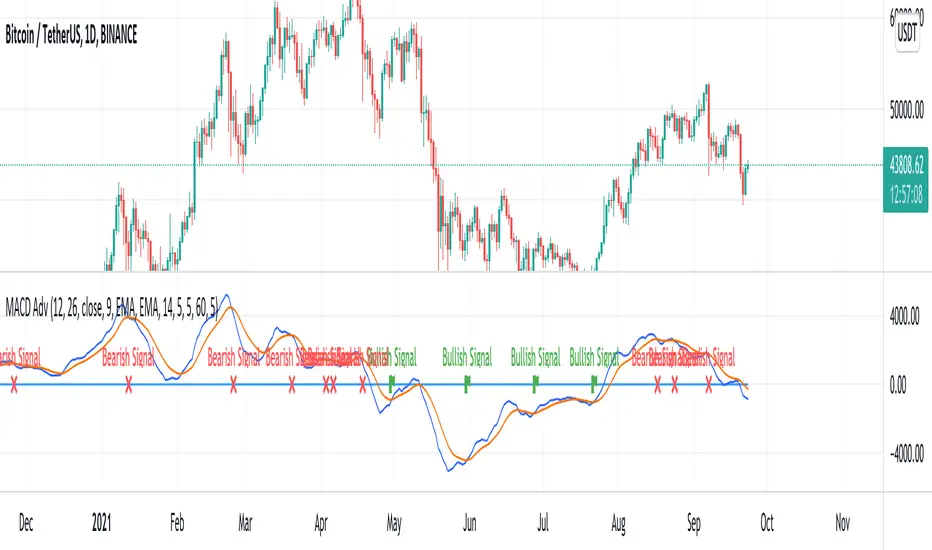
MACD AdvancedHello traders!
As you know, MACD is one of the oldest and the most popular indicators for trading. It seems to be a «Hello world indicator» of most technical analysis beginners. It’s easy to interpret and rather useful for many styles of trading. There are many arguments about its accuracy but in my opinion, this indicator can show very good results. However, you should squeeze every drop of its opportunities and we'll help you with it. We invented this script to make the lives of both professionals and freshmen easier.
Our new indicator uses all the opportunities that MACD gives. It takes into consideration divergencies, crossovers, the MACD, and signal line location. It seems to be rather difficult to take into consideration all MACD signals when you don’t use algorithmic trading, but it’ll be trivial using our script. We have integrated some innovations that’ll make traders’ staff easier. As you know, the crossover is considered to be a false signal in conjunction with hidden divergence which predicts another movement. Thus, we catch all types of divergencies and if it’s hidden of another «value» we skip it. However, if there's a crossover with bullish divergence or cross under with bearish, the signal seems to be strong and accurate. In this case, divergence is playing for us and makes the point of entrance more trustable. Our script takes into consideration this case and the innovative divergence chaser doesn’t give any mistakes. Moreover, if crossover takes place above zero line and crosses under bellow it, these signals are considered to be false too. It’s a trivial task comparing with the previous, thus it’s extremely simple for our script. We called it MACD Advanced cause it uses all the power of MACD with the power of invasive divergence chasers. The usage of it is trivial. Just add it to the chart, tune the parameters like MACD and tune the divergence chaser and get very accurate signals. We decided not to draw the bars to make signals more visible. It seems to be very nice!
I hope guys you'll enjoy it and it'll become a part of your trading staff.
Macd Divergence + MTF EMA MACD Divergence + Multi Time Frame EMA
This Strategy uses 3 indicators: the Macd and two emas in different time frames
The configuration of the strategy is:
Macd standar configuration (12, 26, 9) in 1H resolution
10 periods ema, in 1H resolution
5 periods ema, in 15 minutes resolution
We use the two emas to filter for long and short positions.
If 15 minutes ema is above 1H ema, we look for long positions
If 15 minutes ema is below 1H ema, we look for short positions
We can use an aditional filter using a 100 days ema, so when the 15' and 1H emas are above the daily ema we take long positions
Using this filter improves the strategy
We wait for Macd indicator to form a divergence between histogram and price
If we have a bullish divergence, and 15 minutes ema is above 1H ema, we wait for macd line to cross above signal line and we open a long position
If we have a bearish divergence, and 15 minutes ema is below 1H ema, we wait for macd line to cross below signal line and we open a short position
We close both position after a cross in the oposite direction of macd line and signal line
Also we can configure a Take profit parameter and a trailing stop loss

MACD, RSI, & RVOL Strategy
This strategy combines the use of MACD (12, 26, 9), RSI (14, 30, 70), and RVOL (14) to create Long Buy and Sell signals. This works well with many different time intervals but was developed with 15-minute intervals in mind.
Using MACD as a reference, the strategy identifies when the MACD line crosses over (a factor in a buy signal) and under (a factor in a Sell signal) the Signal line. This shows a shift in positive (cross over) and negative (cross under) of a security.
Using the Relative Strength Index ( RSI ) as an indicator, the strategy notices when the velocity and magnitude of the directional price movements cross over the Oversold signal (30) and crosses under the Overbought signal (70) as a factor in creating a Buy and Sell signal.
Using Relative Volume (RVOL) as an indicator, the strategy calculates when the current volume has crossed over the 2x average volume indicator over a given period and is then used as a factor in creating a Buy signal. RVOL is also used when the change in volume crosses under a set RVOL number (in this strategy, it is set to a RVOL of 5).
RVOL = Current Volume / Average Volume over a certain period
This strategy indicates a Buy signal when 2/3 conditions are met:
- RSI Cross Over the Over Sold signal (default 30)
- MACD Cross Over of Signal ( MACD > Signal)
- RVOL Cross Over of 2 (RVOL > 2)
This strategy indicates a Sell signal when 2/3 conditions are met:
- RSI Cross Under the Over Bought signal (default 70)
- MACD Cross Under of Signal ( MACD < Signal)
- RVOL Cross Under 5 (RVOL < 5)
Enjoy and leave feedback!

MACD Strategy with trailing ATR stopThis is a trend based strategy that uses EMA and SMA intersection for determining the direction of the trend and MACD for the entry signal. At the same time, the strategy uses ATR, which is working as a trailing stop.
The strategy entry will work when the Trend ribbon will turn green and MACD line will crossover the signal line. This strategy also takes into account the pyramiding and allows to enter the second time if the signal will repeat itself.
There are 3 exit points. The first 10% of the position will be closed when the price will increase by 1%. The second portion of 50% will be closed when the price reaches 5% Take profit target. The remaining 40 % of the position will wait for the exit signal which will occur when the price closes below the ATR line.
The strategy is using a fixed amount in dollars, each time the entry occurs the strategy will enter with 100$ in the order.
The strategy can be applied to other crypto assets. However, they will require input changes.
Best of luck with your trading.

MACD Crossover Trend IndicatorThis is a very simple " the trend is your friend " indicator - if you are consistent!
How this indicator works:
This indicator detects MACD Crossovers based on the current trend. It checks wether the current close price is above or below the 200 EMA and therefore decides whether we are in an up- or down trend.
UP-TREND: If the price is above the EMA200, the MACD is below 0 and crosses up the signal line, then this is a BUY signal!
DOWN-TREND: If the price is below the EMA200, MACD is above 0 and crosses down the signal line, then this is a SELL signal!
You can also add an alert, that keeps you informed, once one of these scenario happens for a certain pair!
With this indicator you will never enter against the trend.
Have fun! :)

MACD/EMA Long StrategyThis incredibly simple strategy uses a combination of the 20 EMA and bullish/bearish MACD crosses as a low risk method of getting in and out of markets.
Depending on whether the market is above or below the 200 SMA, the script determines if the market is in bullish or bearish territory. Above the 200 SMA, the script will ignore the 20 EMA as a buy condition and buy solely on the confirmation of a bullish MACD cross upon the close of a candle. In this bullish market, the script will only enable the sell condition if both the MACD is bearish AND a close below the 20 EMA occurs. This is to reduce the chances of the script selling prematurely in the event of a bearish MACD cross, if the market is still in overall bullish territory.
When the market is below the 200 SMA, the confirmation occurs in the opposite direction. The buy condition will only be met if both the MACD is bullish AND a close above the 20 EMA occurs. However, the sell condition ignores the 20 EMA and will sell solely on the confirmation of a bearish MACD cross upon the close of the candle.
This strategy can be used in both bullish and bearish markets. This conservative strategy will slightly underperform in a bull market, with the sell condition occasionally being met and then potentially buying back higher. However, it will successfully get you out of a turning market and automatically switch into a more 'risk-off' mentality during a bear market. This strategy is not recommended for sideways markets, as trading around the 20 EMA coupled with a relatively flat MACD profile can cause the strategy to buy the peaks and sell troughs easily.

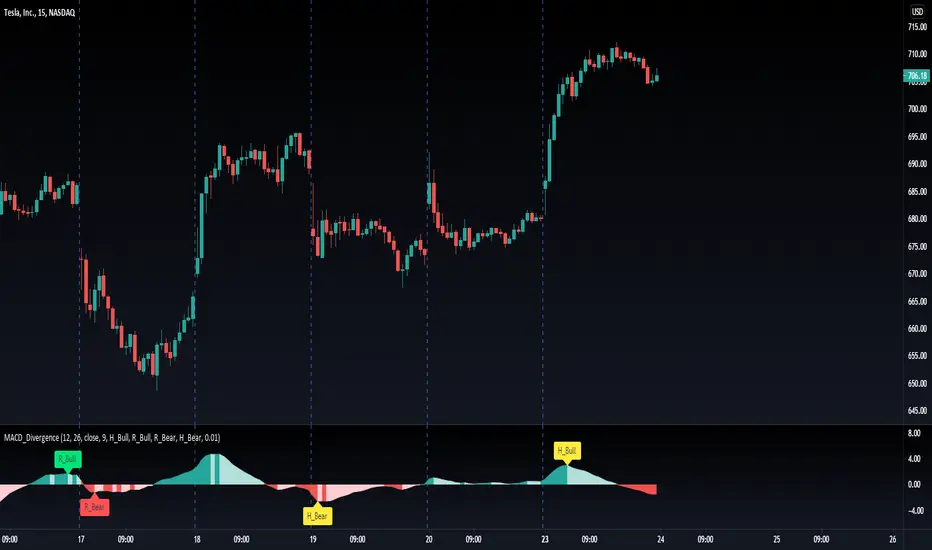
MACD Divergence auto displayed on chart, with alertsMACD Pivot Divergence Detector
This tool identifies MACD histogram divergences based on confirmed pivot highs and lows.
Instead of comparing swing points on the MACD line, this script focuses specifically on the histogram, which measures momentum shifts between MACD and Signal.
How it works
The script detects confirmed pivots using a two-bar swing structure.
When price breaks above a previous pivot high, the script compares the MACD histogram value at that pivot to the current histogram value:
• If price makes a higher high while the histogram makes a lower high, a potential bearish divergence is marked.
The reverse logic is applied for bullish divergence when price breaks below a pivot low.
What makes this script unique
It uses pivot-confirmed histogram values, not lookback-based divergence.
It evaluates divergence only at actual highs/lows, reducing false positives.
It marks divergence directly on the candles for visual clarity.
Alert conditions are included for automated detection.
How to use
Bullish signals may highlight potential momentum loss in downtrends; bearish signals may highlight momentum loss near highs. Divergence does not guarantee reversal and should be combined with broader context, structure, or trend analysis.

MACD + StochasticMACD + Stochastic 14 Scenarios - Complete Signal Analysis
Combines MACD and Stochastic Oscillator to identify 14 different market scenarios based on crossover timing and indicator positioning.
🎯 Signal Strength Classification:
• STRONG (⭐⭐⭐⭐⭐): Both indicators cross together - highest confidence
• MODERATE (⭐⭐⭐⭐): One crosses while other confirms - good confidence
• WEAK (⭐⭐): Conflicting signals - low confidence
📊 Visual Features:
✓ Color-coded shapes on chart (triangles, circles, X marks)
✓ Scenario labels (1-16, excluding 12 & 14)
✓ Real-time info table showing current status
✓ Customizable signal display (show/hide by strength)
✓ Built-in alerts for all signal types
Perfect for swing traders and position traders looking for high-probability entries with dual indicator confirmation. Use on daily
timeframe for best results.
Includes toggleable display options for strong, moderate, and weak signals.

MACD Josh MACD Study — Visual Crossover Tags
Overview:
This script displays MACD signals in a clear, visual way by showing:
Histogram = EMA(Fast) − EMA(Slow)
Signal = EMA(Histogram, Signal Length)
It adds labels and arrows to help you see crossover events between the Histogram and the Signal line more easily.
⚠️ Disclaimer: This tool is for educational and research purposes only. It is not financial advice or an investment recommendation. Past performance does not guarantee future results. Users should make their own decisions and manage risk responsibly.
Features
Central Zero Line with Signal and Histogram plots
Optional labels/arrows to highlight Histogram–Signal crossovers
Alerts for crossover and crossunder events, integrated with TradingView’s alert system
Standard adjustable inputs: Fast EMA, Slow EMA, Signal EMA
How to Interpret (for study only)
When the Histogram crosses above the Signal, a visual label/arrow marks a positive MACD event
When the Histogram crosses below the Signal, a visual label/arrow marks a negative MACD event
The “BUY/SELL” labels are visual study tags only — they do not represent trade instructions or recommendations
Responsible Usage Tips
Test across multiple timeframes and different assets
Combine with higher-timeframe trend, support/resistance, or volume for confirmation
Use alerts with caution, and always test in a demo environment first
Technical Notes
The script does not use future data and does not repaint signals once bars are closed
Results depend on market conditions and may vary across assets and timeframes
License & Credits
Written in Pine Script® v5 for TradingView
The indicator name shown on chart is for labeling purposes only and carries no implication of advice or solicitation

MACD + RSI with Trade SignalsThis indicator by default comes with the MACD shown but can be switched to show the RSI instead. Settings for each indicator can also be customized as well as Buy/Sell signals given based on pull back crossovers that follow the 200 EMA of the price Chart. There's an above/below middle fill option you can use but I tend not to but I know some traders like to see when an oscillator is above/below the middle and use it as a trend diretion. By the way, the fourth setting for the MACD (which is 2 by default) is the size of the histogram.
Buy Signal = Price is above the 200 EMA. Current or previous MACD or RSI line is/was below middle line and now crossed above the signal line.
Sell Signal = Price is below the 200 EMA. Current or previous MACD or RSI line is/was above middle line and now crossed below the signal line.
There are alerts for each signal as well (MACD and RSI, both buy and sell).
Feel free to leave a comment regarding issues or suggestions for this indicator or ideas for the next one I should do :)

MACD S/R signal indicatorI've based the script on my MACDs/r indicator.
I think it works better on higher timeframes, this is just an experiment, please feel free to modify it.
I have been testing it with parabolic SARS to know when to exit the trades.
Exit condition: if I'm in a log position and the price is below the last bearish parabolic SARS dot I exit the trade and the opposite for shorts
DISCLAIMER: Is just an experiment and I haven't test it with real money, be careful
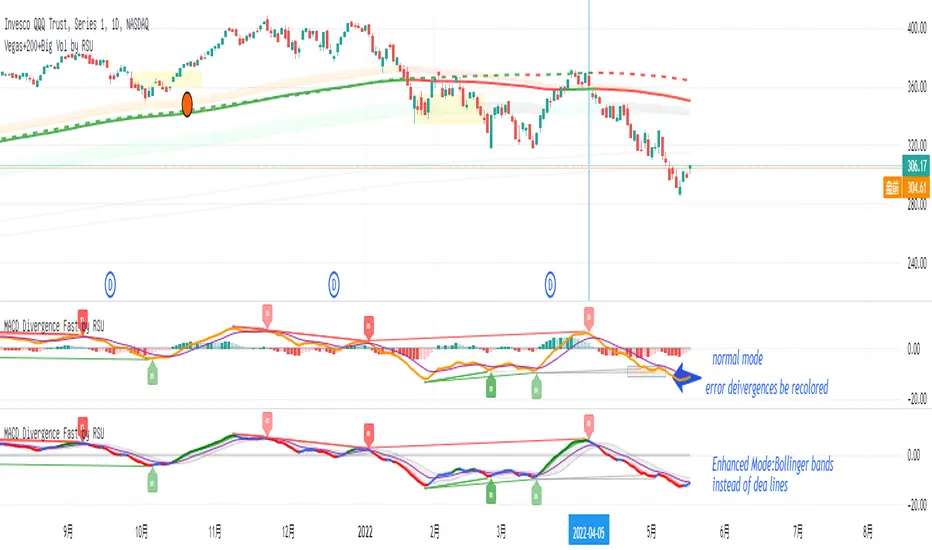
MACD Divergence Fast by RSUAdvantages:
1. When MACD-diff line(orange color) is at a high point, once it falls by 1 k line, it will detect the divergence from the previous high point. This can quickly find the divergence that has taken effect and help you quickly capture the trend before a sharp decline or rise.
2. This indicator detects the previous high and the previous low of 5, 10, 20, 40, 60 lengths at the same time, instead of only detecting a fixed length, so that more divergences can be found.
Notice:
Because it is a quick divergence detection, it is recommended to confirm that the divergence takes effect after the current k is completely closed first. I have identified this state in the indicator as "k not end".
Disadvantages and Risks:
Since it is a quick discovery, there will be error identification. Error divergences will recolor to grey.
Suggestion:
Use “RSI Divergence Fast by RSU” at the same time, because RSI divergence usually occurs before macd, if the position diverges at the same time, the probability of success will increase.
Please do not:
Don't go short in the uptrend, don't go long in the downtrend.
Top divergences that occur because of a strong uptrend are usually only temporary pullbacks. Bottom divergences in persistent declines are also temporary rallies. Do not attempt to trade such low-return trades.
It is recommended to use the divergence indicator when the stock price has made a new high and retraced, and once again made a new high, because this often leads to the end of the trend.
Divergence how to use:
1. After the previous K line was completely closed, a bottom divergence was found.
2. Open an long order at the beginning of the second bar, or as close to the bottom as possible (because the stop loss will be smaller).
3. Break the stop loss price below the previous low where the divergence occurred, which already means that the divergence is wrong.
MACD-RSI With @LuckyNickVAMACD & RSi Confluence. Great for those who are looking for RSI & macd signals. Highlights volatility & structure points for entering & exiting the market. You have to understand market volatility to understand this concept. So please research more on those subjects before using. But The RSI is the relative strength index it helps you understand the increase in interest in price great for trend trading along with the momentum based indicator. Macd Developed by Gerald Appel, the Moving Average Convergence-Divergence, or MACD, is an oscillator that measures price momentum. The indicator also measures the strength, direction and duration of a trend. Forex traders can use the MACD to confirm an entry price or exit point.
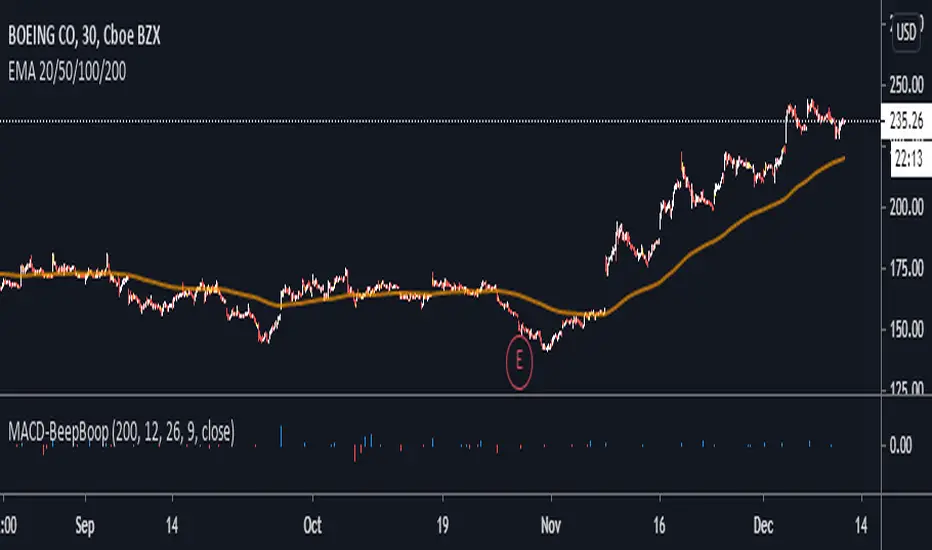
MACD BeepBoop Indicator
The indicator flags long or blue when the macd histogram value > 0 and above the ema and short or red when the macd histogram value < 0 and below the ema
I have added confirmations in the form of eliminating all bars on the histogram unless they meet the long / short entry conditions two bars in a row
You can customize the length of the ema that determines the long/short entry conditions in the settings
I have also added a yellow highlight to the bar in the chart that you would enter on. You would enter at the open of the bar following the signal bar
Stop Loss would be placed at the nearest pivot point or ATR of your choice
Note - republishing this after taking out original links
MACD Histogram BacktestTesting the trades signaled by the daily MACD histogram to see how they would have performed, compared to regular MACD Crosses. I'm going to take the 'List of trades' and analyse it seperately as some of the profit percentages seem a little off in the tradingview calculation, though it could just be my bad math!
Hi CryptoLove :) Hope this helps your investigation RE:
www.youtube.com
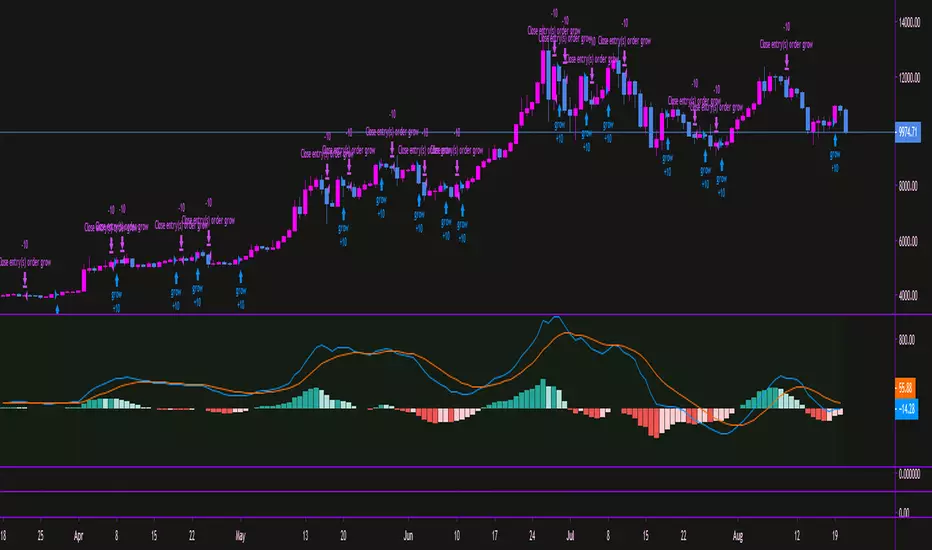
MACD - EURUSD - 1min Long OnlyMACD strategy with a specified level the MACD and signal line must be under. Once the two lines cross under the specified level, a long entry is executed. When the MACD line crosses over the historian, the close entry will be executed. This strategy is designed around the high probability of a reversal in an under-bought trend.

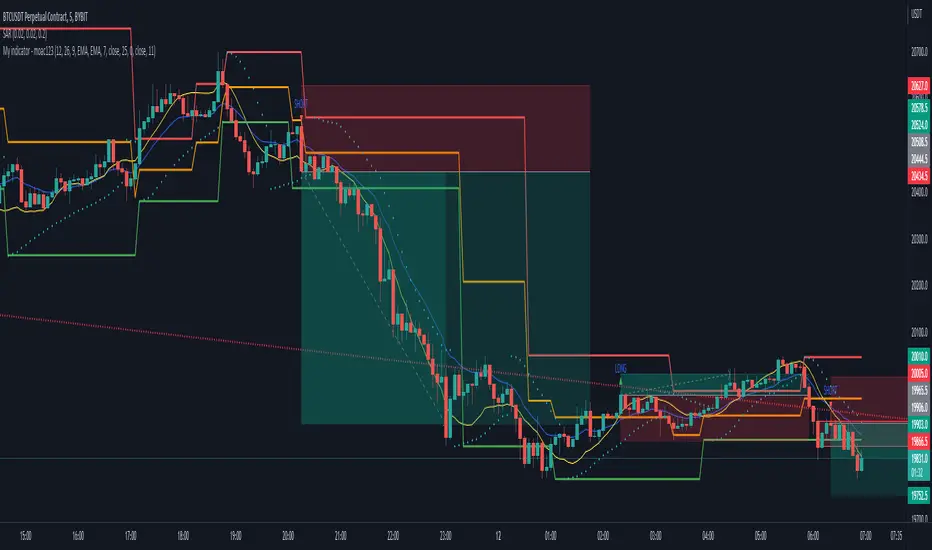
MACD Momentum Structure & Volume Profile Sniper [MTF]**Description and Methodology**
This script offers a unique approach to Market Structure by moving away from traditional fractal-based highs and lows (which can be noisy). Instead, it utilizes **MACD Momentum Swings** to identify significant structural points, combined with an automated Fixed Range Volume Profile to pinpoint high-probability entry zones.
**1. Why MACD Structure? (The Core Concept)**
Traditional "ZigZag" or Fractal indicators rely solely on price action, often leading to fake-outs during low-volume consolidation.
* This script defines a "Swing High" only when the MACD Histogram crosses below zero (Momentum shifts Bearish).
* This script defines a "Swing Low" only when MACD crosses above zero (Momentum shifts Bullish).
By linking structure to momentum, we filter out weak price movements and focus on the true "heartbeat" of the trend.
**2. The "Mashup" Synergy: Structure + Volume + Logic**
This is not a random combination of indicators. Each component serves a specific step in the trading execution sequence:
* **Step 1 (Structure):** The script identifies a Change of Character (CHoCH) based on the MACD peaks described above.
* **Step 2 (Liquidity/Value):** When a CHoCH occurs, the script *automatically* draws a **Fixed Range Volume Profile (FRVP)** specifically covering the impulse leg that caused the break. This reveals the "Point of Control" (POC)—the hidden price level where the most volume occurred during the move.
* **Step 3 (The Sniper Entry):** The script creates a "Zone" around that POC. It then waits for Price to retrace into this zone.
* **Step 4 (Confirmation):** Once the zone is touched, the script monitors a lower timeframe (User selectable, default M1) for a fresh MACD crossover to trigger the final entry signal.
**Features**
* **Multi-Timeframe Dashboard:** Monitor the MACD Trend direction across 4 different timeframes simultaneously.
* **Dynamic Trendlines:** Automatically connects confirmed MACD peaks to visualize trend integrity.
* **Fibo Time Zones:** Projects potential future pivot points based on the duration of the previous swing.
* **Alert System:** Integrated alerts for Zone Touches and "Sniper" entries (Zone Touch + LTF Momentum Confirmation).
**How to Use**
1. **Identify Trend:** Look for the CHoCH labels. Green indicates a shift to Bullish, Red to Bearish.
2. **Wait for Pullback:** Do not chase the break. Wait for price to return to the Yellow POC Zone generated by the Volume Profile.
3. **Entry Trigger:** Watch for the "BUY" or "SELL" marks. These appear only when price hits the zone AND the lower-timeframe momentum aligns with the trade direction.
**Settings & Inputs**
* **Global MACD:** Adjust the sensitivity of the swing detection (Default 12, 26, 9).
* **Sniper Entry:** Select the timeframe used for the final confirmation (e.g., use M1 confirmation for an H1 chart structure).
* **VP Settings:** Customize how the Volume Profile looks on the chart.
*Disclaimer: This script is intended for educational purposes and market analysis. It does not provide financial advice.*

MACD-V Volatility Normalized MomentumFull Credit to Alex Spiroglou, DipTA(ATAA), CFTe, and author of the MACD-V.
papers.ssrn.com
Alex recently received the CMT Dow Award for his work to improve on the classic MACD indicator. The MACD-V tackles some obvious challenges with the classic MACD indicator, which is normally an unbounded indicator and inconsistent between different symbols and markets.
"Our goal is to improve an existing tool (MACD), so that - by eliminating its shortcomings - we will be creating a unique type of hybrid 'boundless oscillator', that opens the doors for several pattern recognition opportunities which would not be definable using the classic MACD."
When the oversold/overbought range of 150 and -150 was determined, Alex tested where 95% of the data fell within the bands using the S&P price history as reference. Users are encouraged to find ranges relevant to the securities/instruments they are analyzing.
Enjoy!

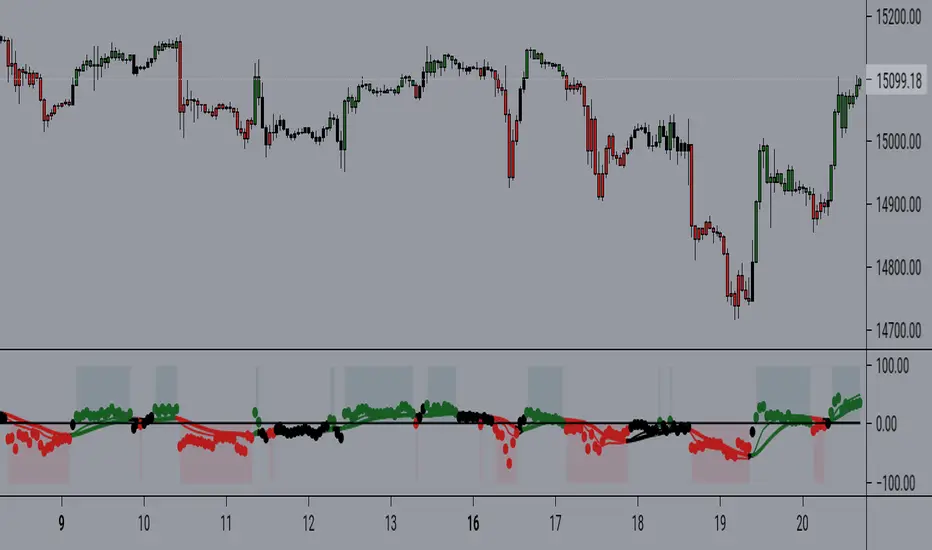
MACD of Aggregated Buy/Sell Pressure - InFinitoModified & Updated script from MARKET VOLUME by Ricardo M Arjona @XeL_Arjona that Includes Aggregated Volume
Aggregation code originally from Crypt0rus
***The indicator can be used for any coin/symbol to aggregate volume , but it has to be set up manually***
***The indicator can be used with specific symbol data only by disabling the aggregation option, which allows for it to be used on any symbol***
- Calculated based on Aggregated Volume instead of by symbol volume . Using aggregated data makes it more accurate and allows to compare volume flow between different kinds of markets (Spot, Futures , Perpetuals, Futures+Perpetuals and All Volume ).
- As well, in order to make the data as accurate as possible, the data from each exchange aggregated is normalized to report always in terms of 1 BTC . In case this indicator is used for another symbol, the calculations can be adjusted manually to make it always report data in terms of 1 contract/coin.
Buy to Sell Convergence / Divergence by @XeL_Arjona:
"It's a simple adaptation of the popular "Price Percentage Oscillator" or MACD but taking Buying Pressure against Selling Pressure Averages, so given a Positive oscillator reading (>0) represents Bullish dominant Trend and a Negative reading (<0) a Bearish dominant Trend. Histogram is the diff between RAW Volume Pressures Convergence/Divergence minus Normalized ones (Signal) which helps as a confirmatory."
Things to look for:
- Divergences: This indicator can very useful to spot tops and bottoms through divergences

MACD Divergence H/RHere's a fun script we been working on, let us know what you add!
Short-Forms Used
histogram(hist)--> value of macd Histogram
Low-Price--------> Candle's Low Price
High-Price-------> Candle's High Price
---------------------------------------------------------------------------------------------------------------------------------------------------------------------------------
-Regular_bulls =====> Lowest(red hist) in Previous red hists is > Lowest(red hist) in Current red hists
and Lowest(Low-price) in Previous red hists is < Lowest(Low-price) in Current red hists
and Lowest(red hist) in Previous red hists is < -Histograms Minimum Value Required
and Lowest(red hist) in Current red hists is < -Histograms Minimum Value Required
---------------------------------------------------------------------------------------------------------------------------------------------------------------------------------
-Hidden_bulls =====> Lowest(red hist) in Previous red hists is < Lowest(red hist) in Current red hists
and Lowest(Low-price) in Previous red hists is > Lowest(Low-price) in Current red hists
and Lowest(red hist) in Previous red hists is < -Histograms Minimum Value Required
and Lowest(red hist) in Current red hists is < -Histograms Minimum Value Required
-------------------------------------------------------------------------------------------------------------------------------------------------------------------------------
-Regular_Bears =====> Highest(Green hist) in Previous Green hists is < Highest(Green hist) in Current Green hists
and Highest(High-price) in Previous Green hists is > Highest(High-price) in Current Green hists
and Highest(Green hist) in Previous Green hists is > Histograms Minimum Value Required
and Highest(Green hist) in Current Green hists is > Histograms Minimum Value Required
--------------------------------------------------------------------------------------------------------------------------------------------------------------------------------
-Hidden_Bears =====> Highest(Green hist) in Previous Green hists is > Highest(Green hist) in Current Green hists
and Highest(High-price) in Previous Green hists is < Highest(High-price) in Current Green hists
and Highest(Green hist) in Previous Green hists is > Histograms Minimum Value Required
and Highest(Green hist) in Current Green hists is > Histograms Minimum Value Required
Please drop a like and comment :)
-Angel Algo
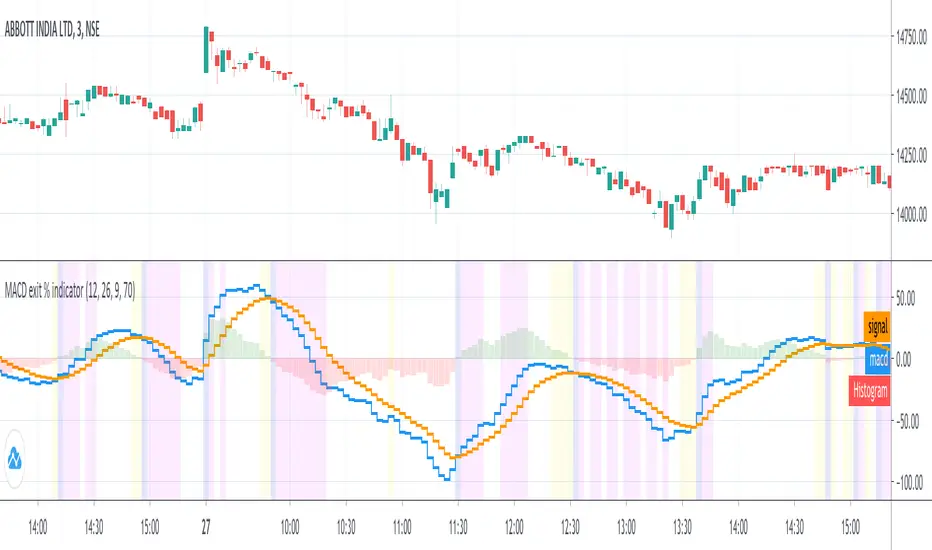
MACD exit % indicatorIntroduction
An exit indicator for MACD, good for triggering order exit via MACD.
It works by considering and the .
Then, it just exits when the % change in these values surpasses a threshold.
Indicators
blue line - MACD
orange line - Signal
green/red columns - Histogram
aqua background - Last Histogram Flip
fuchsia background - Max abs(Histogram) value after last flip
orange Background - Exit region
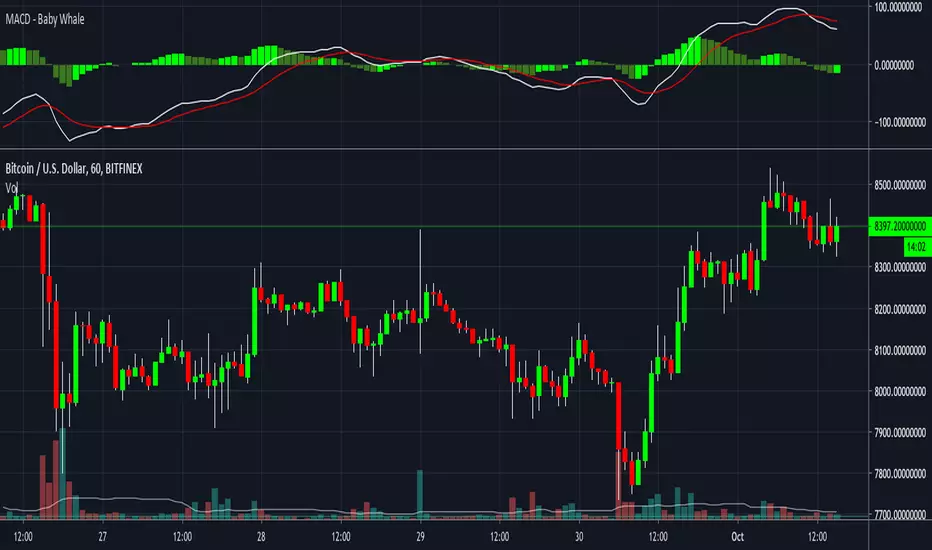
MACD - Baby WhaleI spiced the standard MACD indicator up a bit to make it more visible.
When using the MACD:
1. Never go short when the MACD lines are in the negative.
2. Never go long when the MACD lines are in the positive.
3. Always wait for an uptick / downtick on the histogram before you start your trade.
The MACD Histogram can also show you Divergence.
When the price goes up but the Histogram can't make new highs, it might be a good time to think about shorting.
If you want access, just send a message please.
Much love from Baby Whale!!
🙏❤️🐳