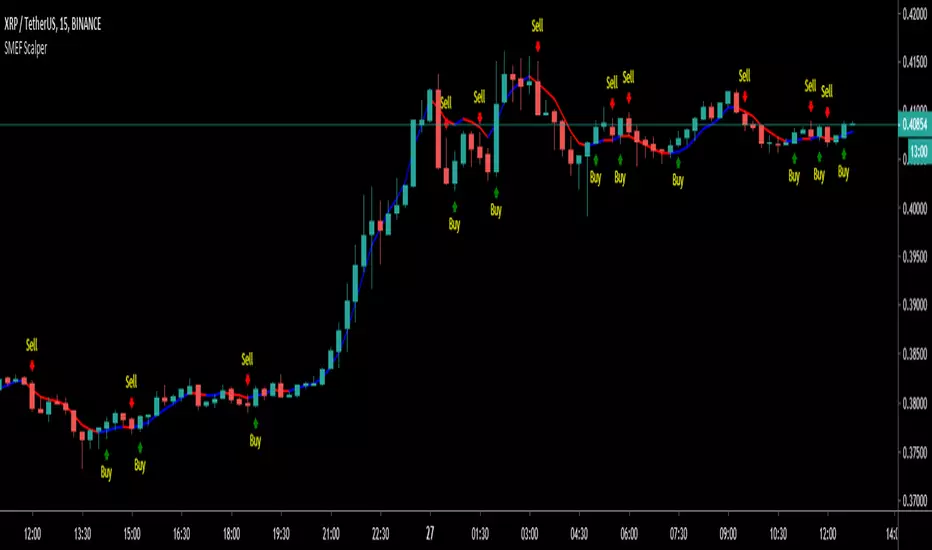
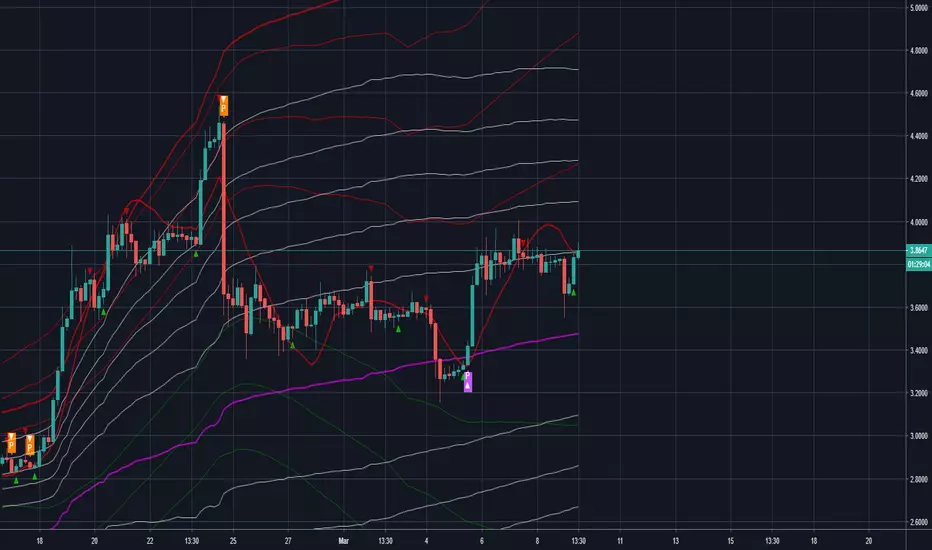
SMEF Scalper
SMEF Scalper by shaslund.
Trying to mix some humour into technical trading.
Kudos to Douglas Adams for his great books. Please take some time to read them.
I believe all traders have been SMEF'd now and then...
For the uninitiated: SMEF = 'Spontaneous Massive Existence Failure'.
Methology:
I am combining a TEMA and a volume-weighted average to predict the trend changes (buy/sell).
Features:
Some funny, some useful.
Thanks to ChrisMoody, LazyBear and Hpotter for invaluable scripting ideas :-)
Now, go ahead and board the 'Heart of Gold' and enjoy the ride :-)
PS: If you want the script, please PM me (shaslund).
ค้นหาในสคริปต์สำหรับ "LazyBear"


Relative Volume IndicatorGrato ao LazyBear, pela base do indicador, que modifiquei para facilitar o entendimento dos movimentos.
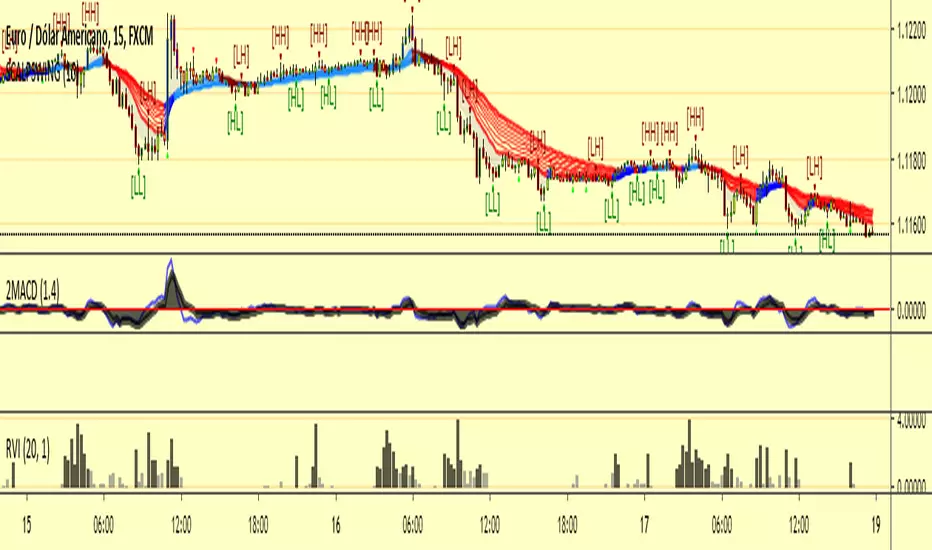
2 MACDGrato ao LazyBear, pela base do indicador, que modifiquei para facilitar o entendimento dos movimentos.


DMISE ResonanceAn attempt to make a timeframe-resonating version of DMI Stochastic Extreme () using @alexgrovers Peak/Valley Estimation script () with Lazybear's MFI/RSI enclosed bollinger bands ()

RSI Bands %BThis is again a lazy bear script that has been lost due to the removal of the "make it mine feature".
please credit
If you see any of his great scripts that are no longer accessible message me and I will see what I can do.

Fib Divergence SystemCombo of many useful indicators which includes fib lines, time and money channels and divergence buy sell signals
Credits for source code:
Scarf, Lazybear, 100kiwi

Minimal Godmode 1.0// Acknowledgements:
// Original Godmode Authors:
// @Legion, @LazyBear, @Ni6HTH4wK, @xSilas
// Drop a line if you use or modify this code.
// Godmode 3.1.4: @SNOW_CITY
// Godmode 3.2: @sco77m4r7in and @oh92
// Godmode3.2+LSMA: @scilentor
// Godmode 4.0.0-4.0.1: @chrysopoetics
// Jurik Moving Average: @everget
// Minimal Godmode v1.0:
// Removed BITSTAMP:BTCUSD, added presets for 9-26-13 and 17-6-4, added more exchanges + USDT and USDC pairs to multi-exchange option
// JMA smoothing - more responsive + less lag than SMA at equivalent length settings
// Minor cosmetic changes to account for pinescript 3 transparency and z-order

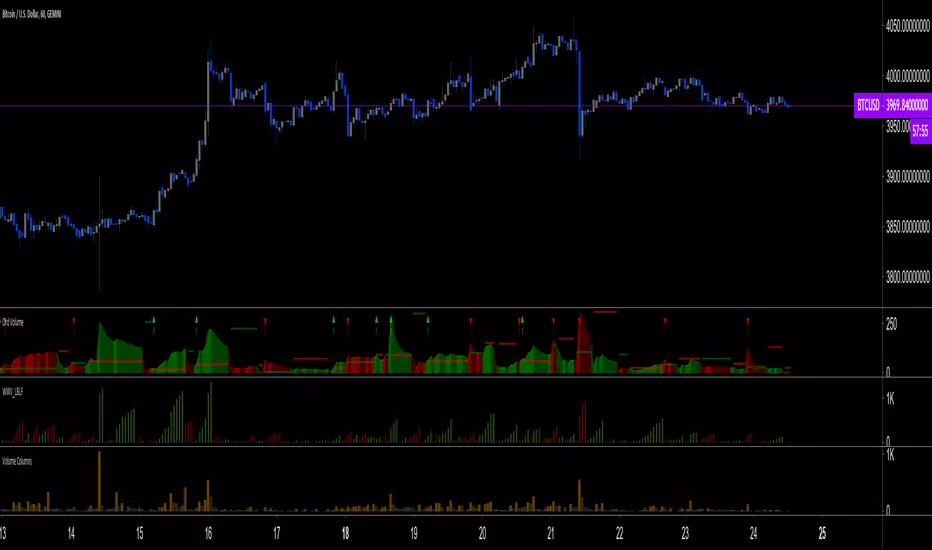
Ord Volume [LucF]Tim Ord came up with the Ord Volume concept. The idea is similar to Weis Wave , except that where Weis Wave keeps a cumulative tab of each wave’s successive volume columns, Ord Volume tracks the wave's average volume .
Features
You can choose to distinguish the area’s colors when the average is rising/falling (default).
You can show an EMA of the wave averages, which is different than an EMA on raw volume.
You can show (default) the last wave’s ending average over the current wave, to help in comparing relative levels.
You can change the length of the trend that needs to be broken for a new wave to start, as well as the price used in trend detection.
Use Cases
As with Weis Wave, what I look at first are three characteristics of the waves: their length, height and slope. I then compare those to the corresponding price movements, looking for discrepancies. For example, consecutive bearish waves of equal strength associated with lesser and lesser price movements are often a good indication of an impeding reversal.
Because Ord Volume uses average rather than cumulative volume, I find it is often easier to distinguish what is going on during waves, especially exhaustion at the end of waves.
Tim Ord has a method for entries and exits where he uses Ord Volume in conjunction with tests of support and resistance levels. Here are two articles published in 2004 where Ord explains his technique:
pr.b5z.net
n.b5z.net
Note
Being dependent on volume information as it is currently available in Pine, which does not include a practical way to retrieve delta volume information, the indicator suffers the same lack of precision as most other Pine-built volume indicators. For those not aware of the issue, the problem is that there is no way to distinguish the buying and selling volume (delta volume) in a bar, other than by looping through inside intervals using the security() function, which for me makes performance unsustainable in day to day use, while only providing an approximation of delta volume.

Trading System(Light)Combo of many useful indicators modified to suit dark theme, contains
1)Regular and Hidden Divergence Buy and Sell signals by scarf
2)Time and Money channels by Lazybear
3)Fibonacci Bollinger Bands by Rashad
4) Linear Regression Curve by ucsgears
Thanks for all the creators for the source codes!

Trading System(Dark)Combo of many useful indicators modified to suit dark theme, contains
1)Regular and Hidden Divergence Buy and Sell signals by scarf
2)Time and Money channels by Lazybear
3)Fibonacci Bollinger Bands by Rashad
4)Linear Regression Curve by ucsgears
Thanks for all the creators for the source codes!

Trading System(Dark)Combo of many useful indicators, contains
1)Regular and Hidden Divergence Buy and Sell signals by scarf
2)Time and Money channels by Lazybear
3)Fibonacci Bollinger Bands by Rashad
4)Linear Regression Curve by ucsgears
Thanks for all the creators for the source codes!
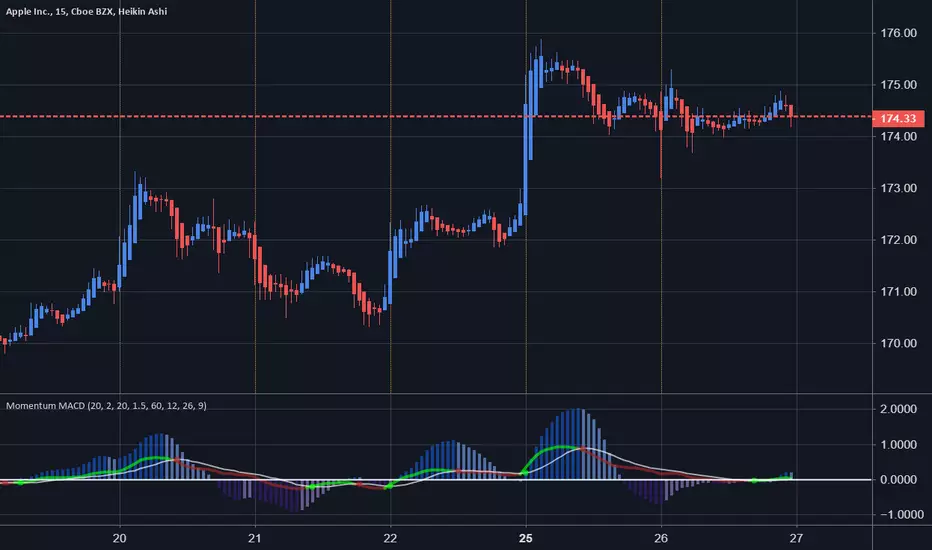
Price Momentum MACD Signal Multiple Timeframes Momentum Indicator with MACD Signal & Base Line
MACD Histogram Indicator is good , but what if you can use momentum as improving it ?
Well Using Price Momentum and the MaCD we can achieve a better action price strategy.
Based upon @LazyBear and @ChrisMoody indcators respectively.
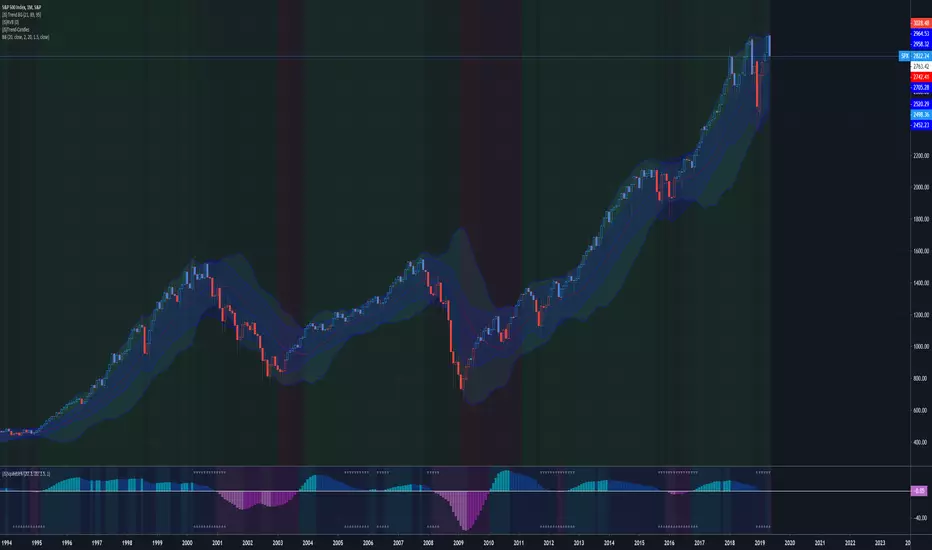
(JS) TTM Squeeze PercentageSo this is a slightly modified version of the fan favorite "Squeeze" indicator.
I did this because I wanted to compare historic movements, but the standard version calculates in whole numbers so a reading with SPX at 2800 is naturally larger than one at 1000.
What I did was I took the Lazybear script and converted it to a percentage reading rather than a reading of whole numbers.
This way - you can compare historical movements, among other things.
Whenever there's a "squeeze" that's when the icons appear on the indicator (top or bottom depending on the value).
I am also trying something new by adding preset color schemes - this is my first crack at it so I'll likely update it and improve it as time progresses (I plan to add the options on my other indicators as well).
Hope you like it!
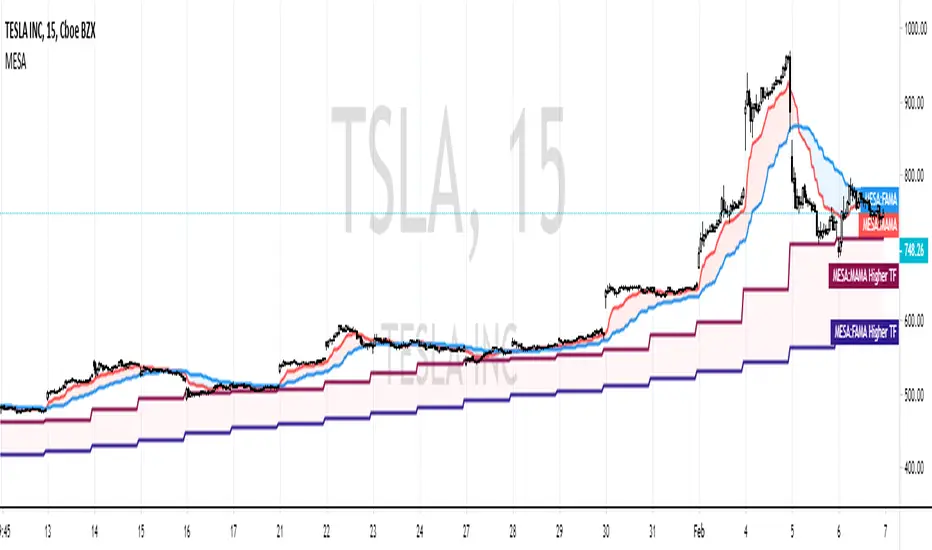
MESA Adaptive Moving AverageIntro
One of Ehlers most well-known indicators! I've seen many variations of this on TradingView, however, none seem to be true to the original released by Ehlers himself.
I've taken it upon myself to simply translate the MAMA into Pinescript, instead of re-writing like some others have done.
You can use it as a very effective & adaptive moving average with other signals or
as a standalone signal.
In the case that you're going to use it for signals and not simple technical trading (non-quantitative),
I've also added a threshold parameter to filter out weak signals.
My MAMA indicator is different from others in very simple ways - I don't use the nz() command, which sets all "Not a Number" values to 0. In others' scripts, you immediately load the indicator with several 0 values,
causing a slight lag in future calculations since this code is recursive (refers to previous values it generated).
In my version, I simply wait until the script has access to all the bar data it needs, instead of instantly performing calculations and
setting erroneous values to 0. In this case, we start with the correct values (or closer to correct).
If you want to compare this indicator the current most popular MAMA by LazyBear, you'll notice it often gives buy and sell crosses one bar earlier than theirs.
Setting Parameters
Source - the data series to perform calculations on. (Initially, Ehlers himself favored hl/2, but conceded that there isn't empirical benefit over close.)
Fast Limit - controls how quickly the MAMA will "ratchet up" fast price action. (Higher values are faster)
Slow Limit - controls how closely the FAMA will follow the MAMA. (Again, higher is faster. You typically want the FAMA to be slower though.)
Crossover Threshold - simple error thresholding to limit the number of weak trade signals. (Lower means lower tolerance)
Show Crosses? - show/hide the arrows at moving average crosses
ATR Pips with Stop LossThis indicator shares ATR pips and a calculated 1.5 x stop loss calculation.
1st number is ATR.
2nd number is ATR x 1.5 (a typical SL when trading daily time frame).
The plot lines are really not that important- it's the actual numbers.
What I do is uncheck the plot line checkboxes (ATR & SL) so it doesn't show up, that way I can reduce the indicator window.
This script is a modified script by ATR Pips . Kept the BB section for now as it might be useful, but doubt it.
Future updates:
- editable the multiple for SL
- static daily numbers (right now this shows the timeframe you are viewing, I'd keep that but add a static daily ATR so you have both)

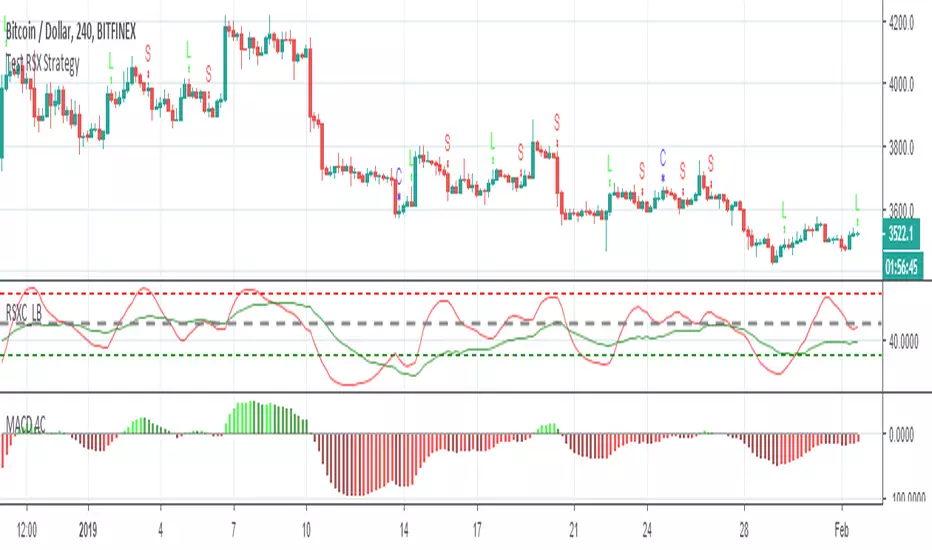
Test RSX StrategyI m test this strategy based on lazybear rsx.
L - Long
S - Short
C - Close positions
Don't recommend to use close bars!
Swing Trader @PuppyTherapy Instead of pushing a lot of scripts I have turned my focus on the actual trading. From this moment on forward, I will publish very little scripts but I will focus solely on quality and actually usability as a trading strategy.
This script combines the following script:
- Wavetrend from Lazybear is probably one of the best single scripts up there the only issue it had is a lot of times the signal comes too soon
- Percentage Rank Spread between Two Moving Averages to focus only on important areas
- RSI and Stochastic to pinpoint entry points
I will not give nor show you the code. Otherwise, the indicator is FREE to use just add it to the chart.
Best timeframes to use on: ( Finetuned for BTCUSD and ETHUSD )
- 1h
- 30m
- 15m
- It works in most markets but avoids going again strong trending markets !
- I recommend you to have an SL use a 2x - 3x multiple ATR
- use Conservative settings Aggressive is only for Advanced users

MAMA by EHLERSMESA Adaptive Moving Average aka: Mother of Adaptive Moving Averages:
The MESA Adaptive Moving Average ( MAMA ) adapts to price movement in an
entirely new and unique way. The adapation is based on the rate change of phase as
measured by the Hilbert Transform Discriminator I have previously described.1
The advantage of this method of adaptation is that it features a fast attack average and a
slow decay average so that composite average rapidly ratchets behind price changes
and holds the average value until the next ratchet occurs. The action of MAMA is
shown in Figure 1. Since the average fallback is slow I can build trading systems that
are virtually free of whipsaw trades.
For detailed information of MAMA: (creators' PDF document)
www.mesasoftware.com
Long condition: when MAMA Crosses over FAMA (Following Adaptive Moving Average )
Short condition: when FAMA Crosses over MAMA
(Personally modified LazyBear's version which was originally calculated in degrees instead of radian by applying explanations in the MESA pdf document.http://www.mesasoftware.com/papers/MAMA.pdf)
Creator: John EHLERS

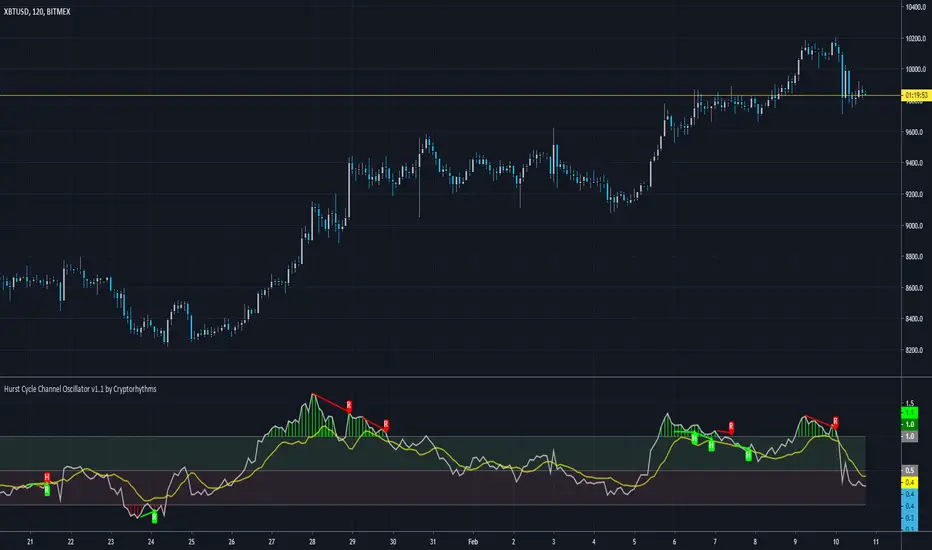
♒Hurst Cycle Channel Oscillator v1.0 by Cryptorhythms♒Hurst Cycle Channel Oscillator v1.0 by Cryptorhythms
👀 This one was not in the public library yet. Thanks to lazybear for the original Hurst Cycle Channel code, which was used to create this.
📜 Description
In the late 60's a NASA aerospace engineer J.M. Hurst published ‘The Profit Magic of Stock Transaction Timing’. Ironically, his book, by some considered the best book ever written about stock market cycles and swing trading, became available during the deepest and most extended Bear Market since the Great Depression. From 1972 on brokers couldn't give blue chip stock away in a Wall Street lunchroom. There was no market for a book by a stock market timer, and the book became a hidden treasure.
The Oscillator version of channel cycle was not on tradingview yet, so here you go, hope you all enjoy! The Hurst Channels and the Hurst Oscillator, be it combined or separate, can be implemented to uncover turning points in all time frames. Note that the Hurst Oscillator is basically just another presentation of the position of price in the Hurst Channel.
You can use it similar to an RSI looking for divergences. Also similar to a ema fast/short cross strategy when you use the signal line as entry/exit. You can also of course use the overbought/oversold zones as well.
Here is a screenshot with the example of bar coloration:
👍 Enjoying this indicator or find it useful? Please give me a like and follow! I post crypto analysis, price action strategies and free indicators regularly.
💬 Questions? Comments? Want to get access to an entire suite of proven trading indicators? Come visit us on telegram and chat, or just soak up some knowledge. We make timely posts about the market, news, and strategy everyday. Our community isn't open only to subscribers - everyone is welcome to join. t.me