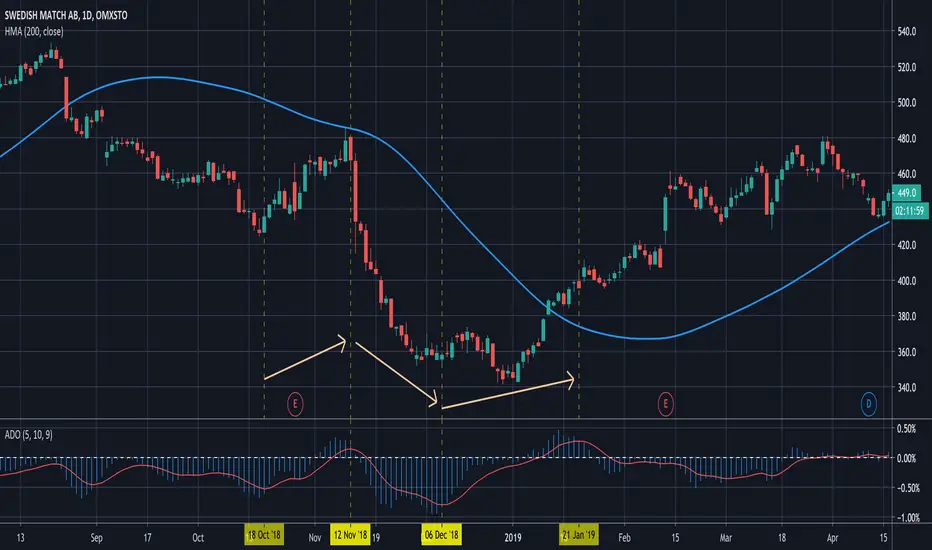
Volume Accumulation Percentage Indicator (0-100)This indicator is the same as LazyBear's indicator with the same title. I simplified it and changed the range to 0-100 so that it can be stacked with RSI indicator. 50 cross is the equivalent of zero cross in the original indicator.
PS: Drag and drop the indicator on RSI for stacking. Go to the settings and scale it to right.
More explanation on the original indicator:
ค้นหาในสคริปต์สำหรับ "LazyBear"
Stochastic On Balance Volume(not sure why the text in the image above is messed up; it looked good before publishing. The oscillators above are (from top to bottom) StochOBV, OBVOSC (LazyBear), OBV)
Applies the Stochastic Oscillator to OBV the same way StochRSI applies the Stochastic Oscillator to RSI.
Features:
- Bounded between 0 and 100, so it may be used for overbought/oversold alerts;
- Uses two lines for crossing signals similar to Stoch and StochRSI;
- Only considers recent OBV action, similar to how StochRSI only considers recent RSI action;
It can be used for simple signals, divergence, trend lines, and any other method you'd use StochRSI for.
The OBV calculation is from LazyBear's OBVOSC script here , so thank you for your script.

Godmode - checkm8's RevampHello and welcome to my revamp of the famous Godmode 3.1 oscillator (originally created by LazyBear, xSilas, and Ni6HTH4wK).
I wanted to create a version that improved on some of the flaws of the initial code, mainly being the use of multi-exchanges, as well as the code from the original oscillator as shown below:
godmode(src) => avg(tci(src),csi(src),mf(src),willy(src))
tradition(src) => avg(tci(src),mf(src),rsi(src, n3))
wt1 = multi?avg(godmode(src0),godmode(src1),godmode(src2),godmode(src3),godmode(src4)):tradition(src0)
wt2 = sma(wt1,6)
As you can see, the original versions of Godmode did not actually utilize the Godmode function within their scripts if you were not running the multi-exchange function. I have fixed that. This version is fully dynamic and not restricted to any particular asset or exchange pairing.
In addition, I have added the following features in the "Input" settings:
- An option to switch between the "Godmode" (avg(tci(src),csi(src),mf(src),willy(src))) calculation and "Tradition" (avg(tci(src),mf(src),rsi(src, n3))), as explained above
- The ability to switch from the original (High + Low + Close)/3 source to (High + Low)/2, (High + Open + Close + Low)/4, and just Close
- Pre-made lengths to use for the Godmode oscillator, with the option to customize and set your own
- Selection of the type of MA used for the lagging Godmode line, with options of EMA, SMA, WMA, and RMA, as well as the length used in the calculation
- The ability to enable smoothing of the leading Godmode line, with options of EMA, SMA, WMA, and RMA, as well as the length used in the calculation <-- This is awesome
- New overextensions, with different colors being displayed at 25 & 75, 20 & 80, 15 & 85, and 10 & 90 (similar to overextensions on RSI)
- The ability to display the overextensions as background color, as well as dots along the oscillator (as per original copy). There are also pre-made color schemes for the overextensions, to save you some time.
Please make yourselves comfortable with the customization settings, as they were designed to make your life easier!
_______________________________________________________________________________________
The original Godmode 3.1 can be found at the page linked below:
_______________________________________________________________________________________
If you have any questions or suggestion, feel free to reach out!
All the best and happy trading! :D
_______________________________________________________________________________________
Special thanks to:
- Original authors: LazyBear, xSilas, and Ni6HTH4wK
- Suggestions: ETCBTC, WillowGoLightly, and mobitz
- Moral support: ETCBTC

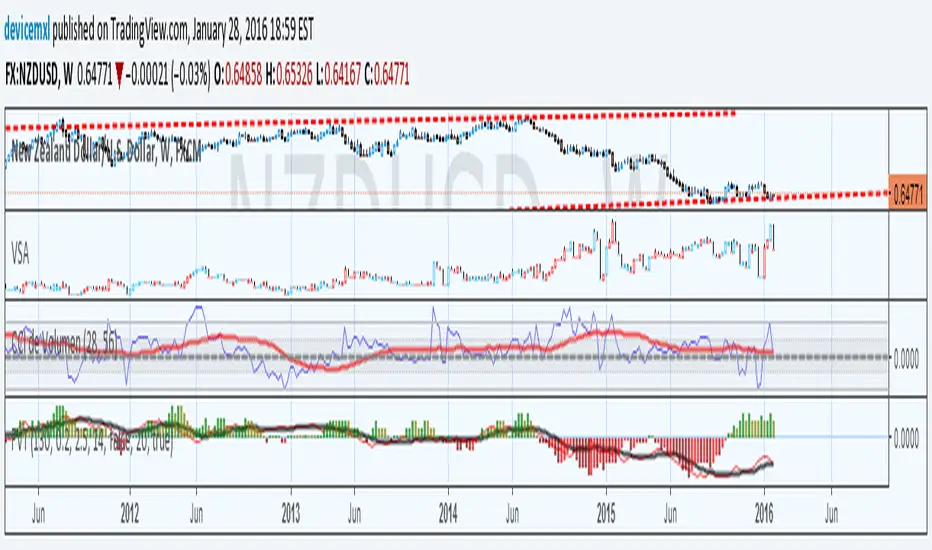
Propagation Volumes and TrendsWith this, i calculate RSI of the HL2 of the volume and use like an oscillator, this will use to measure the strength of the trend and the "Volume Flow" to follow the trend.
I use like foundation the LazyBear "Volume Flow Indicator" "honor a quien honor merece"
Background:
I think the volume as the price could be represented by candles or other graphic to use indicators and strengthen their analysis, due to lack of registration of this it is first necessary to calculate a volume graph, if the candle traditionally negative price brand then the total volume is taken as negative for the period. An example of this is in the On Balance Volume indicator, the problem is that there is no way to analyze the volume using other methods. An approximate volume of the spread could be the use of the price spread to make a synthetic behavior
As traditionally is observed if Open> Close then the candle and the volume will be negative and vice versa; the next step, is estimate the amounts of the candle necessary to calculate the ratio to use for the volume and thus idealize their spread within the candle:
VLOW = Volume x Low
vHigh = x High Volume
VOpen = vClose
vClose = Volume x Close
This graph can show a stable synthetic form of fluctuations in the volume trend affected by price.
ideas, comments and suggestions (or corrections).They are always welcome
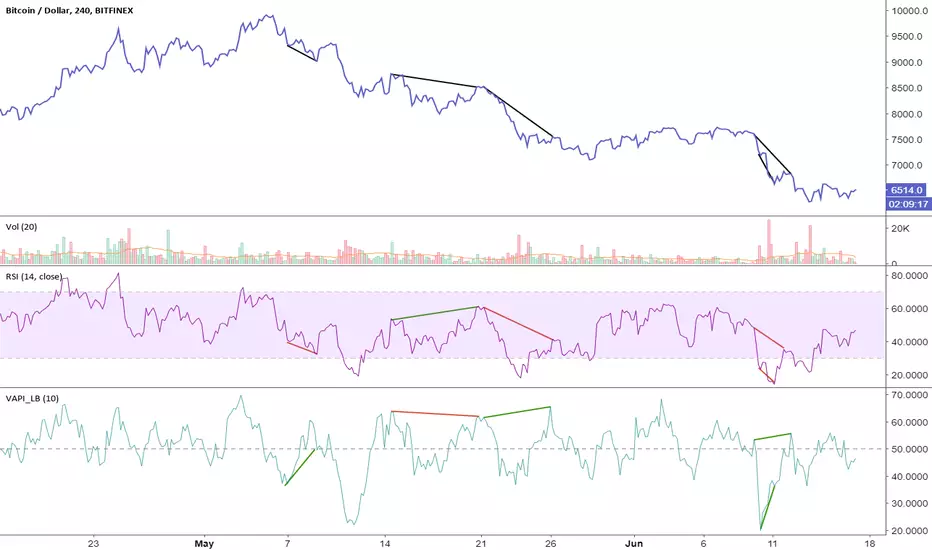
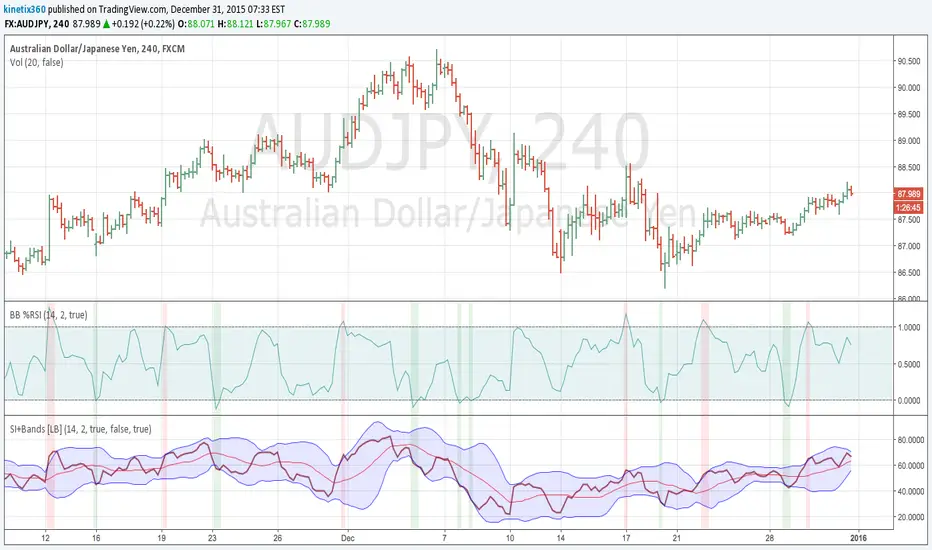
Bollinger Bands %RSIHi All,
I am not a programmer, but I tried to buid BB% of RSI , base of John Bollinger' book. I cut and paste the function from LazyBear MFI/RSI BB indicator and original BB% scripts. Now, I need help for 2 things :
1. I already check by side with LazyBear indicator for the OB/OS, and all are good. One thing I don't understand is why we build the Basis for bb using "sma" ? any one can help me to understand with this?
2. I am happy with this, but I need to make the Source Price become customisable (close, hl/2, hlc/3, etc). and I don't know how to set it up. please help me with this.
Thank you.
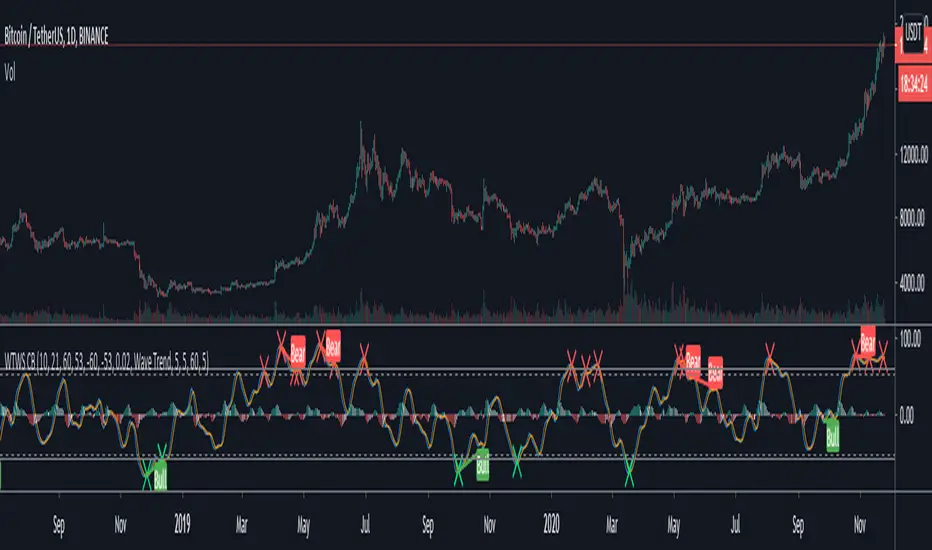
Weis Wave Volume MTF 🎯 Indicator Name
Weis Wave Volume (Multi‑Timeframe) — adapted from the original “Weis Wave Volume by LazyBear.”
This version adds multi‑timeframe (MTF) readings, configurable colors, font size, and screen position for clear dashboard‑style display.
🧠 Concept Background — What is Weis Wave Volume (WWV)?
The Weis Wave Volume indicator originates from Wyckoff and David Weis’ techniques.
Its purpose is to link price movement “waves” with the amount of traded volume to reveal how strong or weak each wave is.
Instead of showing bars one by one, WWV accumulates the total volume while price keeps moving in the same direction.
When price direction changes (up → down or down → up), it:
Finishes the previous wave volume total.
Starts a new wave and begins accumulating again.
Those wave volumes help traders see:
Effort vs Result: Big volume with small price move ⇒ absorption; low volume with big move ⇒ weak participation.
Trend confirmation or exhaustion: High volume waves in trend direction strengthen it, while low‑volume waves hint exhaustion.
⚙️ How this Script Works
Trend & Wave Detection
Compares close with the previous bar to determine up or down movement (mov).
Detects trend reversals (when mov direction changes).
Builds “waves,” each representing a continuous run of bars in one direction.
Volume Accumulation
While price keeps the same direction, the script adds each bar’s volume to the running total (vol).
When direction flips, it resets that total and starts a new wave.
Multi‑Timeframe Computation
Calculates these wave volumes on three timeframes at once, chosen dynamically:
Active Chart Timeframe Displays WWV for:
1 min 1 min
5 min 5 min
15 min 15 min
Any other Chart TF
It uses request.security() to pull each timeframe’s latest WWV value and current wave direction.
Visual Output
Instead of plotting histogram bars, it shows a table with three numeric values:
WWV (1): 25.3 M | (15): 312 M | (240): 2.46 B
Each value is color‑coded:
user‑selected Uptrend Color when price wave = up
user‑selected Downtrend Color when wave = down
You can position this small table in any corner/center (top / bottom × left / center / right).
Font size is user‑adjustable (Tiny → Huge).
📈 How Traders Use It
Quickly gauge buying vs selling effort across multiple horizons.
Compare short‑term wave volume to higher‑timeframe waves to spot:
Alignment → all up and big volumes = strong trend
Divergence → small or opposite‑colored higher‑TF wave = potential reversal or pause
Combine with Wyckoff, VSA, or standard trend analysis to judge if a breakout or pullback has real participation.
🧩 Key Features of This Version
Feature Description
Multi‑Timeframe Panel Displays WWV values for 3 selected TFs at once
Dynamic TF Mapping Auto‑adjusts which TFs to use based on chart
Up/Down Color Coding Customizable colors for wave direction
Adjustable Font and Placement Set font size (Tiny→Huge) and screen corner/center
No Histograms Keeps chart clean; acts as a compact WWV dashboard

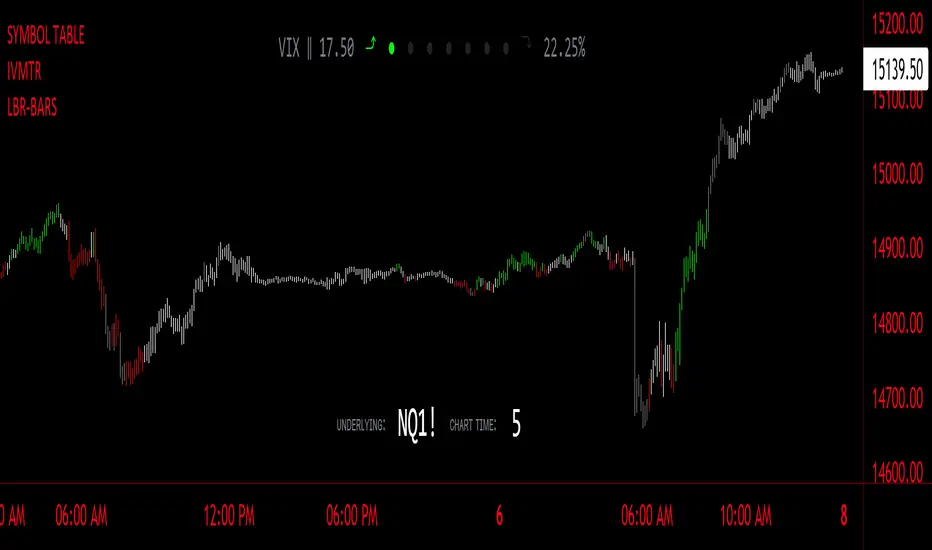
LBR-Volatility Breakout BarsThe originator of this script is Linda Raschke of LBR Group.
This Pine Script code is the version 5 of LBR Paintbars for TradingView, called "LBR-Bars." It was originally coded for TradingView in version 3 by LazyBear. It is a complex indicator that combines various features such as coloring bars based on different conditions, displaying Keltner channels, and showing volatility lines.
Let me break down the key components and explain how it works:
1. Inputs Section: This section defines various input parameters that users can adjust when adding the indicator to their charts. These parameters allow users to customize the behavior and appearance of the indicator. Here are some of the key input parameters:
- Users can control whether to color bars under different conditions. For example,
they can choose to color LBR bars, color bars above/below Kelts, or color non-LBR
bars.
- Users can choose whether to show volatility lines or shade Keltner channels' area
with the Mid being the moving average on the chart.
- In the calculation of Keltner channels, users can set the length of the moving
average that the Keltner channels use as the mid and then set the Keltner multiplier.
If users want to use "True Range" to determine calculations, they can turn it on or
off; it defaults to off.
- Users can change the calculation of volatility lines and set the length for finding the
lowest and highest prices. The user sets the ATR length and multiplier for the ATR.
2. Calculation Section: This section defines the calculation of the upper and lower standard deviation bands based on the input parameters. It uses Exponential Moving Averages (EMAs) and optionally True Range to calculate these bands if turned on. These bands are used in the Keltner channel calculation.
3. Keltner Channel Section: This section calculates the upper, middle, and lower lines of the Keltner channels. It also plots these lines on the chart. The colors and visibility of these lines are controlled by user inputs.
4. Volatility Lines Section: This section calculates the upper and lower volatility lines based on the lowest and highest prices over a specified period and the ATR. It also checks whether the current close price is above or below these lines accordingly. The colors and visibility of these lines are controlled by user inputs.
5. Bar Colors Section: This section determines the color of the bars on the chart based on various conditions. It checks whether the current bar meets conditions like being an LBR bar, being above or below volatility lines, or being in "No Man's Land." The color of the bars is set accordingly based on user inputs.
This Pine Script creates an indicator that provides visual cues on the chart based on Keltner channels, volatility lines, and other customizable conditions. Users can adjust the input parameters to tailor the indicator's behavior and appearance to their trading preferences.
MA ClustersBackground :
This study allows to define ranges for contraction and expansion of a defined set of MA to analyse the the momentum at those specific situations.
In general all functions used are very basic but allows the user to set alerts when a cluster of MA enters a defined range within or outside the MAX and MIN of a selected MA cluster. The predefined length of the EMAs were put together by HurstHorns within a trading learning discord group and are designed for 1M timeframe to read the momentum for scalping entries - Thanks again for sharing.
Functions :
currently the following MA are available:
- ema
- sma
- smma
- wma
- vwma
- vma
the variable moving average is based on the calculation from lazybear.
- RSI Stoch Filter
- Wavetrend OB/OS filter
Currently only alerts for contraction are enabled to not overload the study but in case expansion would be from interest this can be added quickly.
Outlook:
Additional filters were added to see if they can add value in. the decision making or by simply filtering out noise. This is still quite experimental. Please share any useful observation I should add as additional filter option to find good setups. in relation to contractions or expansions.
Next version will get Bollinger bands for 1 selectable MA from the list for additional study options.
In case you are interested in more options such as more MA types or vwap.. just let me know. for VMA I need to do more research to add useful function for laddering or things like that.
In general The script itself can be easily extended by additional functions. As this is one of my first scripts the code itself might not be optimal or there are more elegant ways to come to the same goal. However please use for study purposes only and report bugs or enhancement requests.
good luck and happy trading!

Elder Impulse System + ATR BandsDisregard the above chart, I am not sure why it isn't showing the one I want, which is linked below:
This is as far as I can tell the closest representation to Dr. Alexander Elder's updated "Elder Impulse System" that has added ATR-volatility bands up to 3x deviations from price. I got the idea from watching this recent video (www.youtube.com) of Dr. Elder reviewing some recent trades and noticed he had updated his system from his original books. The Impulse System colour coding was inspired by AstralLoverFlow and LazyBear. ATR Bands are pre-programmed Keltner Channels with some modifications such as filing in the ATR Zones with user-selected colour bands and modifying the ATR value to better suit the volatility of the market being traded.
The script has several components, which I will detail below:
Exponential Moving Averages:
1) A 13-period EMA that is used as a staple in all of Dr. Elder's technical analysis. He uses this EMA as the basis for all of his indicators and why it is included here.
2) A 26-period EMA which can be used as a base-line of sorts to filter when to go long or when to go short. For instance, price over the 26-EMA, price is strong and the rally upwards is likely to continue, underneath it, price is weak and likely to continue downwards for a time.
Volatility Bands:
By definition these are nothing more than 3 separate Keltner Channels of a 13-period EMA each set to one additional multiplier from the moving average. This gives us a 1x, 2x, and 3x multiplier of average volatility from the 13-period EMA based on a 14-period Average True Range (ATR) reading. The ATR was chosen as it accommodates price gaps and also is the standard formula calculation in TradingView. The values of the bands cannot be adjusted but the colour coding of them can be.
Elder Impulse System:
These colour-coded bars show you the strength and direction of the current chart resolution, calculated by the slope of a 13-period EMA and the slope of a MACD histogram. These are used not as a buying or selling recommendation alone but as trend filters, as per Dr. Elder's own description of them.
Green Bars = The 13-period EMA is sloping positively and the MACD histogram is rising compared to previous bars. The trader should only consider buying/long opportunities when a green bar is most recent.
Red Bars = The 13-period EMA is sloping negatively and the MACD histogram is falling compared to previous bars. The trader should only consider selling/short opportunities when a red bar is most recent.
Blue Bars = The 13-period EMA and the MACD histogram are not aligned. One of the indicators is sloping opposite to the other indicator. These are known as indecision bars and are typically seen near the end of a previously established trend. The trader can choose to wait for either a green or red bar to shape their trading bias if they are more risk-averse while a counter-trend trader may decide to try opening a position against the currently-established trend.
How To Trade the System:
This system is unique in that it is so versatile and will fit the styles of many traders, be it trend following traders (generally the original Elder Impulse System design) or mean-reversion/counter-trend trading (the original Keltner Channel design). None of the examples below or in the chart above are financial advice and are just there for demonstration purposes only.
1) The most basic signal given would be the moving average cross up or down. A cross of the 13-EMA over the 26-EMA signals upward trend strength and the trader could look for buying opportunities. Conversely, the 13-EMA under the 26-EMA shows downward trend strength and the trader could look for selling opportunities.
2) Following the Elder Impulse system in conjunction with the EMAs. Look for long opportunities when a green bar is printed and price is over both of the 13- and 26-period EMAs. Look for short opportunities when a red bar is printed and price is below both of the 13- and 26-period EMAs. Keep in mind this does not necessarily need a moving average cross to be viable, a green or red bar over both EMAs is a valid signal in this system, usually. Examine price more closely for better entry signals when a blue bar is printed and price is either above or below both EMAs if you are a trend trader. This is how Dr. Elder originally intended the system to be used in conjunction with his famous Triple Screen Trading System. I am not going into detail here as it is a deep subject but I would suggest an interested trader to examine this Triple Screen System further as it is widely accepted as a strong strategy.
3) Mean Reversion and Counter-Trend Trading. Dr. Elder mentions that the zone between the two EMAs is called the Value Zone. A mean reversion trader could look for buying opportunities if price has generally been in an uptrend and falls back to value, conversely, they could look for shorting opportunities if price has generally been in a downtrend and rises back to value. These are your very basic pull backs found in trends that create your higher lows in an uptrend or your lower highs in a downtrend. A mean reversion/scalper trader may also look to use the upper and lower most ATR bands as an indication of price being overbought or oversold and could look to enter a counter-trend trade here once a blue indecision bar is printed and to ride that move back down to the Value Zone.
Taking Profits and Risk Management
This system again is very versatile and will fit a wide range of trading styles. It has built in take profit levels and risk management depending on your style of trading.
1a) In original Triple Screen Trading (and the original Elder Impulse system), a trader was to place a buy order one tick above a newly printed green bar with a stop loss one tick below the most recent 2-day low, and vice-versa for red bars on short selling. as long as other criteria were met, that I will not go into. It is all over YouTube and in his books and on Investopedia if you want more information. The general idea is to continue the trend in the direction if price is strong and you are bought into that move with a close stop, or if price falls back a little bit, you can get in at a better price. This would be a system typically better suited to a scalper.
1b) The updated risk management according to the above video is to place a stop loss at least 2ATR away from price. These bands already have calculated these values so a trader can place a stop one tick below the 2 or even 3ATR zones depending on their risk appetite. This is assuming you have already received a strong buy signal based on the system you follow. This would be a system typically better suited to a trend-trader.
2a) Taking profits if you are a trend trader has several possibilities. The first, as Dr. Elder suggests, is to place a price target 2ATR values away from your entry giving you approximately a 1:1 risk-reward ratio.
2b) The second possibility if the trade is successful is to ride the trend upwards until a blue bar is printed, suggesting indecision in the market. A modified version of this that could let a winning trade run longer is to wait for the price to close under the 13-EMA in fast markets, or close under the 26-EMA in slightly slower markets to maximize potential winnings.
2c) A scalper trader may wish to have a target at either the value zone if they are playing an extended buy/short back to the mean, or if they are being at the mean, to sell or cover when price extends back out to the 2x or 3x zone.
3) Trend traders can additionally use the ATR zones as a sort of safety guidelines for entering a trade. Anything within the 1ATR zone is typically a safer entry as the market is less volatile at this time. Entering when price has gone into the 2ATR zone is signaled as a strong momentum move and can signal a stronger move in the direction of the current closing bar. While not always the case, it is suggested by Dr. Elder to not enter trend trades at the 3ATR zone as this is where you will be likely looking for a counter-trend retracement back to value and a trader entering here in the direction of the trade has a higher chance of being stopped out or not getting in at the best possible price.

On-chart Wavetrend Divergence with PivotsThis is an OnChart WaveTrend Divergence Indicator with Pivots and Alerts
LazyBears WaveTrend Indicator or also known as "Market Cipher" is an Indicator that is based on Moving Averages, therefore its an "lagging indicator". Lagging indicators are best used in combination with leading indicators. In this script the "leading indicator" component are Daily, Weekly or Monthly Pivots. These Pivots can be used as dynamic Support and Resistance, Stoploss, Take Profit etc.
This indicator combination is best used in larger timeframes. For lower timeframes you might need to change settings to your liking.
What are those circles?
-These are the WaveTrend Divergences. Red for Regular-Bearish. Orange for Hidden-Bearish. Green for Regular-Bullish. Aqua for Hidden-Bullish.
Please keep in mind that this indicator is a tool and not a strategy, do not blindly trade signals, do your own research first! Use this indicator in conjunction with other indicators to get multiple confirmations.

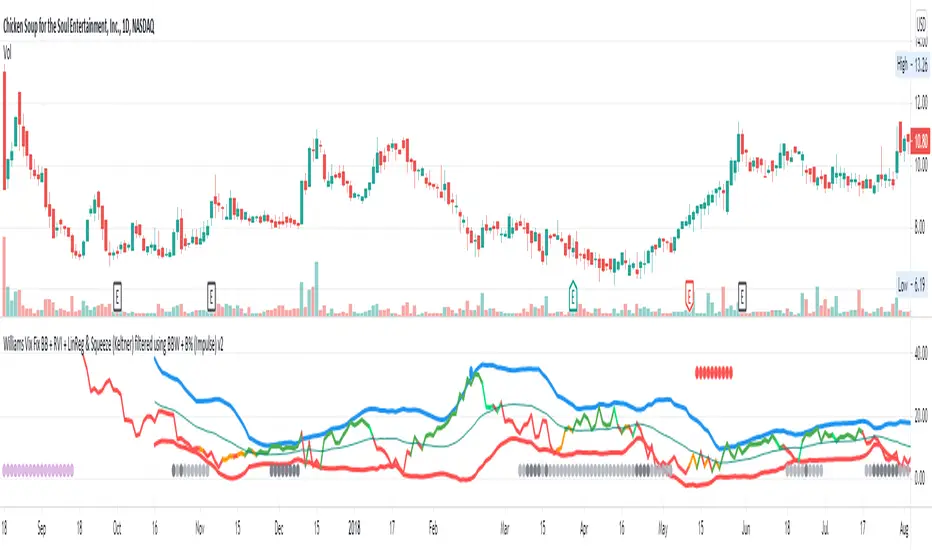
Williams Vix Fix BB + RVI + LinReg & Squeeze (Keltner) BBW + %BLegend:
Entery signal: When line color turns to lime (lighter green) after a blue dot appears
Exit signal: When line color turns to red (darker red) after a red dot appears
Note: it is more affective as an entry signal (Bottom is stronger)
- When line touches or crosses red band it is Top signal (Williams Vix Fix)
- When line touches or crosses blue band it is Bottom signal (Williams Vix Fix)
- Red dot at the top of indicator is a Top signal (Relative Volatility Index)
- Blue dot at the top of indicator is a Bottom signal (Relative Volatility Index)
- Gray dot at the bottom of indicator is a Keltner Squeeze signal (filtered by either BBW or %B)
- Silver dot at the bottom of indicator is a weaker Keltner Squeeze signal (Doesn't meet either BBW or %B filter)
- Purple is a 'Half Squeeze' only 1 Bollinger Band crossed the Keltner Channel
This is an attempt to make use of the main features of all 6 of these Volatility tools:
- Williams Vix Fix + Bollinger Bands
- Relative Volatility Index (RVI)
- Linear Regression (detects Vix Fix starts to rise or fall to a certain degree in order to help validate bottom/top)
Note : There is also added precision on Linear Regression entry by dividing WVF by square roots of basis.
- The crossing of Keltner Channel by the Bollinger Bands (Squeeze)
Conditions to Help Filter Keltner Squeeze:
- When the Bollinger Bands Width (BBW) value is lower than the lowest value within a period plus a margin of error (percentage)
- When the %B value goes up or down by the impulse value (threshold value in setting) detailed in LazyBears indicator. (www.tradingview.com)
If it meets one of these 2 filters and there is a Keltner Channel Squeeze than gray color or else if the squeeze doesn’t meet one of the 2 filters than silver color (weaker Squeeze).
The goal is to find the best tool to find bottoms and top relative to volatility and filter squeeze.
Note: You can also change the threshold for RVI top and bottom.
And this work builds on my last indicators:
- Williams Vix Fix + BB & RVI (Top/Bottom) & Squeeze ()
- Williams Vix Fix BB + RVI & Squeeze (Keltner) filtered BBW + %B ()
If you have ideas on this work or have ideas on potential combinations please message me, I always want to learn or get perspective on how it can be improved.
Sharing is how we get better (Parameter tuning, ideas, discussion)
I don’t reinvent the wheel, just trying to make the wheel better.
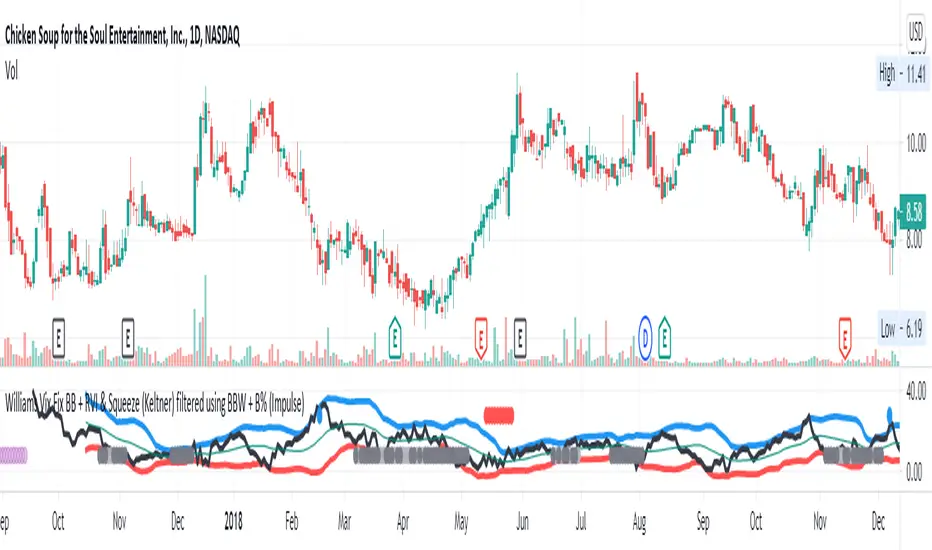
Williams Vix Fix BB + RVI & Squeeze (Keltner) filtered BBW + %BLegend:
- When line touches or crosses red band it is Top signal (Williams Vix Fix)
- When line touches or crosses blue band it is Bottom signal (Williams Vix Fix)
- Red dot at the top of indicator is a Top signal (Relative Volatility Index)
- Blue dot at the top of indicator is a Bottom signal (Relative Volatility Index)
- Gray dot at the bottom of indicator is a Keltner Squeeze signal (filtered by either BBW or %B)
- Silver dot at the bottom of indicator is a weaker Keltner Squeeze signal (Doesn't meet either BBW or %B filter)
- Purple is a 'Half Squeeze' only 1 Bollinger Band crossed the Keltner Channel
This is an attempt to make use of the main features of all 6 of these Volatility tools :
- Williams Vix Fix + Bollinger Bands
- Relative Volatility Index (RVI)
- The crossing of Keltner Channel by the Bollinger Bands (Squeeze)
Conditions to Help Filter Keltner Squeeze:
- When the Bollinger Bands Width (BBW) value is lower than the lowest value within a period plus a margin of error (percentage)
- When the %B value reaches the alert level detailed in LazyBears indicator. ()
If it meets one of these 2 filters and there is a Keltner Channel Squeeze than gray color or else if the squeeze doesn’t meet one of the 2 filters than silver color (weaker Squeeze).
The goal is to find the best tool to find bottoms and top relative to volatility and filter the squeeze.
The idea is that both Williams Vix Fix + Bollinger Bands and Relative Volatility Index both already give the main volatility bottom and top so combining them to compare and validate the signals makes sense. (Note: Bottom signal is more accurate than top). In addition, I added the squeeze to show the potential breakout pressure and to compliment bottom and top signals.
For ideas on how to continue this work :
I encourage ideas to combine the Williams Vix Fix and Relative Volatility Index for volatility top and bottom (with probability would be awesome)
And I encourage ideas to filter Keltner Channel Volatility Squeeze using both the BBW or %B or other volatility squeeze indicators or a combination of all of them.
Also, I encourage people to post their top parameters for the BBW and %B to filter the Keltner Squeeze in the comments or to send me them by chat relative to this indicator.
Half the battle is making the indicator, while the other half is tuning the parameters.
The current parameters are one of the least aggressive, and act as a mild filter.
Note: You can also change the threshold for RVI top and bottom.
And this work builds on my last indicator:
If you have ideas on this work or have ideas on potential combinations please message me, I always want to learn or get perspective on how it can be improved.
Sharing is how we get better (Parameter tuning, ideas, discussion)
I don’t reinvent the wheel, just trying to make the wheel better.
[Unxi]McClellan Summation Index for DAX 30 (GER30) [modified]About McClellan Summation Index
The McClellan Summation Index is a market breadth indicator which was developed by Sherman and Marian McClellan. It is based on the McClellan Oscillator and add its values together, effectively running a total. The index goes up when the McClellan Oscillator is positive and goes down when it is negative. Signals can be derived from the index crossing the middle line (bullish when it's crossing up and bearish when it's crossing down). Other potential signals include divergences and overbought and oversold conditions. The indicator is best used in combination with other analysis techniques.
About this implementation
This version here is a modification of the McClellan Summation Index.
It runs the simple version of the McClellan Oscillator and uses the simple method to calculate the Summation Index. No ratios are used in this implementation.
Further information:
- It can only be used on the DAX index ( DAX 30 or GER 30)
- It only considers the DAX 30 stocks
- The data window will provide a summary about rising and declining stocks
- The data window will output the last change for each of the 30 stocks
- The script is pretty slow because it has to calculate the change for each bar individually (instead of receiving a complete calculation from the stock exchange).
DISCLAIMER
This script was mainly written for educational purposes (training myself how to write custom indicatotors).
As you can see, the code is really messy.
FOR YOUR INFORMATION: This script will work on any time period. It is recommended to use it with timeperiod = 1d, though. Just use whatever timeperiod you are comfortable with, the indicator will automatically adjust accordingly.
Credits
Based on the simple version of aftabmk and of code from lazybear.

Jetto's Indicator This indicator allows me to provide a free version of my custom indicator which utilities LazyBears WaveTrend indicator.

Comprehensive BandsComprehensive Bands is an unabashed mashup combining Bollinger Bands, STARC Bands, and Keltner Channels. STARC Bands are modified Keltner Channels whichdo a better job than the Bollinger Bands when it comes to showing where the top and bottom ranges of natural volatility exist. The pale white exterior cloud is your STARC Band fill. The white line is the STARC basis line. Next closest to the center we have the Bollinger Bands in yellow without a basis line (because BB basis lines aren't that great). Bollinger Bands will help to highlight when volatility breakouts are about to happen. Keltner Channels are based on an exponential moving average represented by the purple basis line in the center usually accompanied by a pair of channel lines above and below, in this case represented as a blue fill.
Every component of this indicator can represent support and resistance on the go. You can use this as a trading system. The method in this case would be similar to the Bollinger Band trading method. The Bollinger Band method involves waiting for price to hit a support or resistance line where it then prints a reversal candle, and to trade in the direction of that reversal. This indicator can improve the Bollinger Band trading method by providing a better idea of when a trend has reached a reversal point through the use of superior maximum/minimum representations and superior basis lines. All this while configured in a visual representation that's light on noise. I'd suggest using this indicator in conjunction with an oscillator you feel comfortable with such as the MacD or RSI. Happy hunting.
Shoutout to LazyBear.
Note: I'm aware that this does not contain Donchian channels and have no regrets.

cloe V X.0 triple wave trend with trend This script is based on the lazybears wavetrend script
with a extra useful ema
the third ema is based on the last 200 periods and show how the trend is going in the time
- When the original wave cross the third ema it's means that we can continue long or short
- When the third ema stretchs below or up the 0 line it means that the current pair is oversell or overbought but in a large period of time so we can decide if we continue long or short

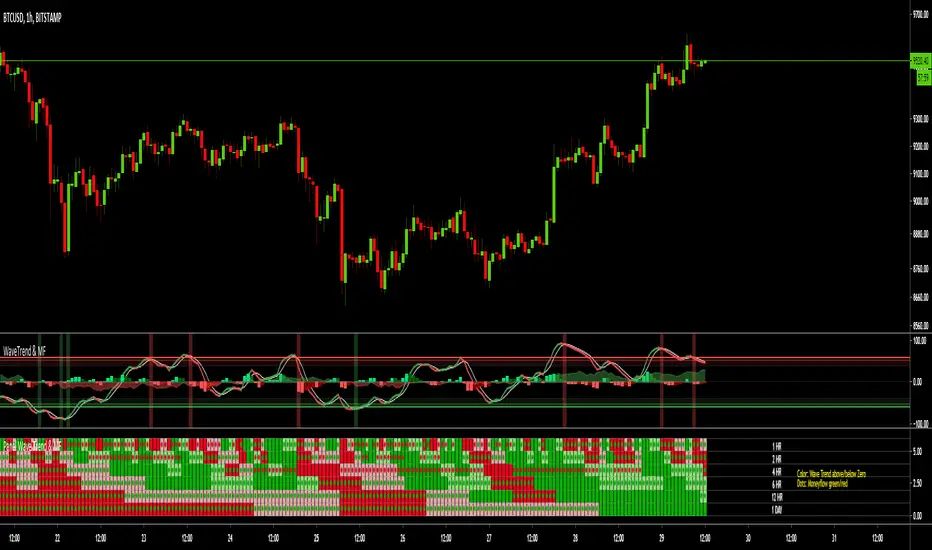
MTF Wave Trend & Money Flow - Monitoring PanelAnother indicator based on the famous "Wave Trend Oscillator" by LazyBear.
Monitoring panel showing the Wave Trend as color for 6 different timeframes. Additionaly the Money Flow (positive or negative) is indicated as green or red dots.
I find it helpful that with one glance the current Wave Trend and Money Flow on many timeframes is visible.
(Timeframes can be changed, but the description labels are currently hardcoded - if you want to change it, just copy the script and change them)
Meanings of the Colors:
WT above Zero and rising : Dark Green
WT above Zero and declining : Light Green
WT below Zero and declining : Dark Red
WT below Zero and rising : Light Red
Money flow positive : Green dot
Monet flow negative : Red dot
(Currently there are two additional timeframes commented in the code - if you want to use them, just copy the script and uncomment them)
Have fun and as always I am open for constructive feedback.
Cheers!
MTF Wave Trend CrossThis indicator is based on the famous "Wave Trend Oscillator" by LazyBear.
I have noticed that the Wave Trend Crosses (not the waves themselves) give a pretty good indication on the current status of the market (above Zero = bullish / below Zero = bearish ).
This new indicator is a Multi TF Version of this where it is possible to define 4 fixed Higher Time Frames and 4 fixed Lower Time Frames.
The results are then plotted above (higher TF) and below (lower TF) of the result of the current TF. (Offset can be flexibly changed in the settings)
This allows to judge the trend based on the various TFs.
Basically the greener it looks, the more bullish the situation is at the moment. More red color indicates a more bearish situation.
Enjoy.

TDI Traders Dynamic Index Alerts v1 - BonavestTo add this indicator to your charts:
Click the 'Add to Favorite Scripts' button down below this description.
This indicator places BUY and SELL tags on the chart using the Trader's Dynamic Index Indicator created by Dan Malone. This indicator is RSI based and is best used with ranging markets and will tend to create a trail of false signals (colored tags) when price is at it's extremes for a long period of time. Utlizing some other indicator such as a volume based one will assist in optimizing signals.
I have used this indicator with success for a few years, however I do not plan to support users of this indicator. It is offered as-is.
I use this indicator for:
Counter Trend Trading (colored tags)
Detecting Best Entries to Follow Trend (gray tags)
Trading Extreme Overbought/Oversold Price Areas (bright colored tags)
Detecting RSI Divergences (circles)
SETTINGS
Custom Timeframe - Default current chart timeframe. Custom selection only works when selecting a smaller timeframe than what is on the chart.
Lengthrsi - RSI Period
Lengthband - TDI Band Length
Lengthrsipl - TDI Price Line Length
Lengthtradesl - TDI Signal Line Length
There are 5 Built-In Notifications already created for you and are available by simply right clicking in the indicator area and selecting:
Condition: TDI Alerts v1
Then 1 of the 5 Alerts:
BUY Signal - All Green colored tags
SELL Signal - All Red colored tags
Gray BUY signal - All Gray BUY tags
Gray SELL signal - All Gray SELL tags
All Signals - All colored and gray tags
This adaptation was based off of the original code from the talented LazyBear.

Acc/Dist OscillatorThis is basically the code from the Volume Oscillator by LazyBear.
I just added 'accdist' as input source, made it a histogram and added a signal line.
Crypto McClellan OscillatorMcClellan Oscillator for cryptocurrency, taking into account only the top 40 cryptos.
Original code was by LazyBear.

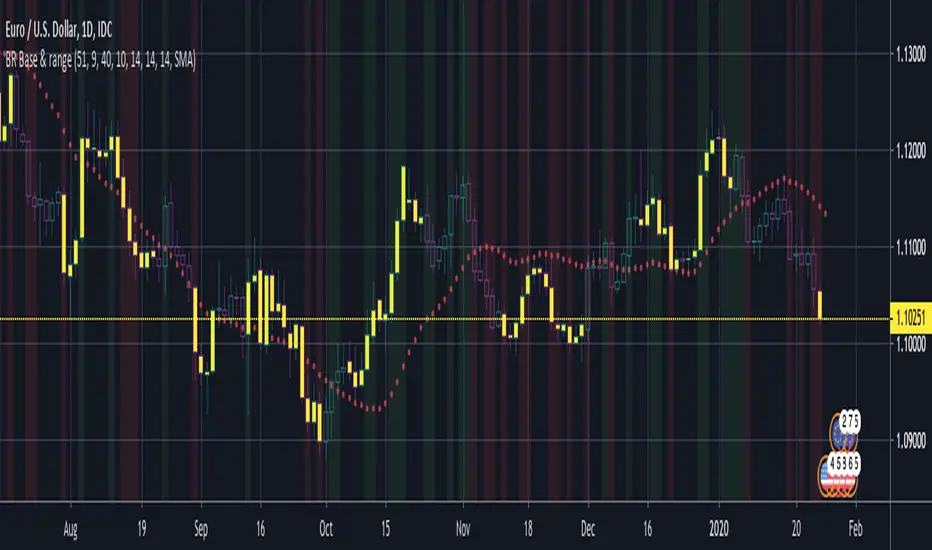
BERLIN Renegade - Baseline & RangeThis is the baseline and range candles part of a larger algorithm called the "BERLIN Renegade". It is based on the NNFX way of trading, with some modifications.
The baseline is used for price crossover signals, and consists of the LSMA. When price is below the baseline, the background turns red, and when it is above the baseline, the background turns green.
It also includes a modified version of the Range Identifier by LazyBear. This version calculates the same, but draws differently. It remove the baseline signal color if the Range Identifier signals there is a possible trading range forming.
The main way of identifying ranges is using the BERLIN Range Index. A panel version of this indicator is included in another part of the algorithm, but the bar color version is included here, to make the ranges even more visible and easier to avoid.
Wave Trend With Signals [ChuckBanger]A wave trend script based on LazyBears script but with added signals and a histogram...