SVA - Simple Volume Analyzer, by BlueJayBird [bjb] ENGLISH & SPANISH
------------------------------------- ENSLIGH
The idea was initially inspired in the concepts shared by @LazyBear on his indicator "Better Volume Indicator" (). But I found it somewhat complicated and dull. So I came up with this.
Concept:
It changes the color of volume bars based on surrounding volume changes.
Volume changes are plotted as volume MAs lines in the volume pane.
Whenever the volume is higher than these MAs, the bar changes color.
For this reason, the bar color change is RELATIVE TO the surroundings, because the color change depends on how far the MA has been extended due to sudden (or not) changes in the volume.
BAR COLORS:
Weak Green and Red: Low volume. The calm before or after the storm.
Normal Green and Red: Mid volume. Still low volume, you may get bored.
Yellow: High volume. Players are playing hard and harder.
White: Ultra-High Volume. The elephants stepped in.
NOTES:
SVA works better at lower timeframes. Though as far as I can tell, it works pretty well as far as 1D timeframe.
------------------------------------- SPANISH
La idea estuvo inicialmente inspirada en los conceptos expuestos por @LazyBear en su indicador "Better Volume Indicator" (). Pero lo encontré un poco complicado y falto de claridad. Así que me inventé este.
Conceptp:
Cambia el color de las barras basándose en los últimos cambios de volumen.
Los cambios de volumen son ploteados como lineas de medias móviles (MAs, es decir "Moving Averages") en la sección del volumen (chart pane).
En cualquier momento que el volumen es mayor que estos MAs, el color de las barras cambia.
Por esta razon, el cambio de color de las barras es RELATIVO a lo que está sucediendo alrededor, ya que el cambio de color depende de qué tan lejos el MA se haya extendido por causa de los últimos cambios (o no) de volumen.
BAR COLORS:
Verde y rojo apagados: Volumen bajo (Low Volume). La calma antes de la tormenta.
Verde y rojo normales: Volumen medio (Mid volume). Volumen todavía bajo. Es posible que te aburras.
Amarillo: Volumen alto (High Volume). Los jugadores están jugando duro.
Blanco: Volumen ultra-alto (Ultra-High Volume). Los elefantes entran a la cancha.
NOTAS:
SVA funciona mejor en temporalidades menores. Pero por lo que he visto, funciona bien hasta la temporalidad de 1D.
ค้นหาในสคริปต์สำหรับ "LazyBear"

TDI - Traders Dynamic Index + RSI Divergences + Buy/Sell SignalsTraders Dynamic Index + RSI Divergences + Buy/Sell Signals
Credits to LazyBear (original code author) and JustUncleL (modifications)..
I added some new features:
1- RSI Divergences (Original code from 'Divergence Indicator')
2- Buy/Sell Signals with alerts (Green label 'Buy' - Red label 'Sell')
3- Background colouring when RSI (Green line) crosses above MBL (yellow line)
- Buy and Sell Signals are generated using Dean Malone's method (The Author of the TDI indicator) as mentioned in his PDF: (( www.forexfactory.com )), according to:
** Buy (Green Label) = RSI > 50, Red line, & Yellow line
** Sell (Red Label) = RSI < 50, Red line, & Yellow line
- I found that the best quality long trades generated when RSI crosses above red line, yellow line and they are all above 50, and vice versa for sell trades.
-I figured out another way to generate Buy/Sell Signals when RSI crosses above the yellow line, and you can stay with the trade till RSI crosses under the yellow line (I made a background colouring for that to be easily detected)
Hope you all wonderful trades..
مؤلف المؤشر هو (Dean Malone)
وكتب LazyBear كوده في tradingview
وأضاف JustUncleL بعض التعديلات عليه
أضفت إليه بعض المزايا الأخرى المتمثلة في:
1- رصد انحرافات مؤشر القوة النسبية
2- إشارات بيع وشراء بناء على طريقة مؤلف المؤشر
3- تظليل بالأخضر للمنطقة التي يعبر فيها مؤشر القوة النسبية الخط الأوسط (الخط الأصفر)
إشارات البيع والشراء تكون كالتالي:
** الشراء عندما يكون مؤشر القوة النسبية فوق الخط الأحمر وفوق خط الـ 50 وفوق الخط الأصفر
** البيع عندما يكون مؤشر القوة النسبية تحت الخط الأحمر وتحت خط الـ 50 وتحت الخط الأصفر
** أفضل إشارات الشراء حينما يعبر مؤشر القوة النسبية فوق الخط الأحمر والأصفر، ويكونوا جميعا فوق خط الـ 50، والعكس بالنسبة لإشارات البيع
يمكن استخدام المؤشر في دخول صفقات متوسط المدى، وذلك عندما يعبر مؤشر القوة النسبية فوق الخط الأصفر (قمت بتظليل المنطقة بالأخضر لسهولة رصدها) والخروج من الصفقة إذا نزل مؤشر القوة النسبية عن الخط الأصفر،
يرجى التنبه إلى أن الدخول والخروج يكون بأسباب فنية مدروسة، والمؤشر يدعم قراراتك فقط، ولا يمكن الاعتماد عليه منفردا في تحديد نقاط الدخول أوالخروج.
تجارة موفقة لكم جميعا :)

SQUEEZE SR oscHi guys!
I want to share my most precision on my opinion indicator.
The purpose of the script is to find tops and bottoms.
It does not repaint after a bar close and has only 1 bar lag.
It is similar to LazyBear's Squeeze Momentum Indicator but has very important modifications:
1) indicator oversold and overbought values are defined, so we have more precise tops and bottoms identification and exact time when there is the reversal.
2) Green columns on the oscillator mean bullish volume inflow and vice versa. Oscillator showings are sharper, they are not smoothed by moving average. Overall speed is greater so it gives more clear divergencies.
3) The script takes in count only bars with filtered price change and compares the blend of moving, price, and volume. It does not use linear regression or Bollinger bands as LazyBear's script does.
4) As script results are easier to interpret its tops and bottoms can be automatically plotted as support and resistance. And the chart stays not littered.
5) The script also calculates the median of formed by last top and bottom range - grey line by default.
6) The script also calculates the pullback target price - orange line by default.
Use strategies are on your taste.
For example, it can be used for scanning markets for reversals or base brokes.
Or for dummy trading: long the bottom with targeting to TP and EQ and fully exit on reversal and so on.
I wish you good trading!
PS. The oscillator has 31 lines of code and the overlay version - 43 lines of code.
See more examples below.

LB Squeeze Momentum DivergencesThis study tries to highlight LazyBear Squeeze Momentum divergences
as they are defined by
TradingLatino TradingView user
Squeeze momentum green peaks are connected by a line
Associated prices to these green peaks are also connected
If both lines have a different slope orientation
then there is a divergence.
It only shows two last divergence lines and angles.
The original chart screenshot shows some divergence lines
on the top or main chart
these were drawn manually
because you cannot write to two different charts
from the same pine script study (Well, not in August 2020 anyways)
It's aimed at BTCUSDT pair and 4h timeframe.
HOW IT WORKS
Simple geometric mathematics are used
to calculate the two lines degrees
Then both degrees are compared
to show if both lines agree ( // or \\ )
or if they disagree ( /\ or \/ )
SETTINGS
(SQZDiver) Show degrees : Show degrees of each Squeeze Momentum Divergence
lines to the x-axis.
(SQZDiver) Show desviation labels : Whether to show
or not desviation labels for the Squeeze Momentum Divergences.
(SQZDiver) Show desviation lines : Whether to show
or not desviation lines for the Squeeze Momentum Divergences.
(ADX) Smoothing
(ADX) DI Length
(ADX) key level
(ADX) Print : Whether to show
or not scaled ADX line
(SQZMOM) BB Length
(SQZMOM) BB MultFactor
(SQZMOM) KC Length
(SQZMOM) KC MultFactor
(SQZMOM) Use TrueRange (KC)
(SQZMOM) Print : Whether to show
or not Squeeze Momentum indicator.
WARNING
Some securities and timeframes might output degrees
too next to zero.
The code might need to be tweaked to meet your needs.
USAGE
One strategy is to sell when you are in a long entry
when you find out that the price slope is upwards ( / )
while the lb smilb slope is downwards: ( \ )
E.g. You will see:
/
\
on the indicator.
Why?
Because it might signal you that the price is
going to correct downwards soon.
FEEDBACK 1
Please let me know if there is any
other strategy based on the red side of
LB Squeeze Momentum
so that I might add support for it in the future.
FEEDBACK 2
Calculating degrees in a chart
with a different x-axis scale
is a nightmare
that's why I did not a range settings
so that values next to zero are
converted into zero
and thus showing an horizontal line.
Feedback is welcome on this matter.
EXTRA 1
If you turn off showing the divergence lines
and if you turn off showing the divergence labels
you almost get what TradingLatino user uses
as its default momentum indicator.
EXTRA 2
Optionally this indicator can show you
a rescaled ADX (it only works properly on 2020 Bitcoin charts)
ABOUT COLOURS
TradingLatino user has both dark green and light green
inverted compared to this LB SQZMOM chart.
CREDITS
I have reused and adapted some code from
'Squeeze Momentum Indicator' study
which it's from TradingView LazyBear user.
I have reused and adapted some code from
'Directional Movement Index + ADX & Keylevel Support' study
which it's from TradingView console user.

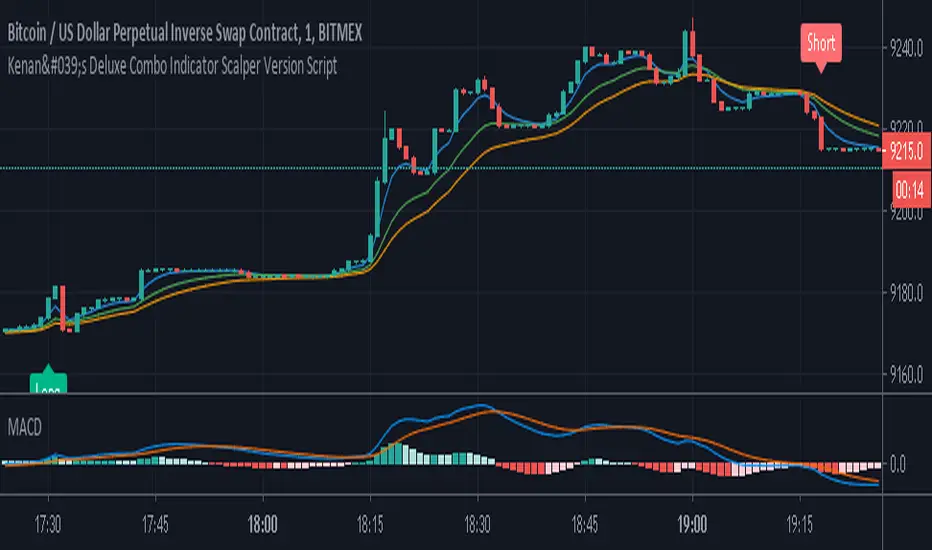
Kenan's Deluxe Combo Indicator Scalper Version ScriptThis is a combo strategy of sorts. I've been able to come up with this strategy after a lot of research.
Under Normal circumstances, when people look at dozens of indicators and they all signal, they open positions. So I decided to save people the trouble and put the major indicators together in a strategy.
All of the classic cross strategies usually give a lot of signal. Some of these signals are unnecessary and incorrect signals. Combining leading indicators. I tried to avoid the faulty signals.
Indicators and oscillators included in this strategy are:
1. Ema 5/13/21
2. Macd
3. Macd Dema
4. Ichimoku
5. Dmi
6. Stochastic
7. Aroon
8. Bollinger Band
9. Rsi
10. Chande Momentum Oscillator
11. Exponential Ease of Movement ( Eom )
12. Klinger Oscillator
13. Stochastic RSI
14. Ultimate Oscillator
15. Woodies CCI
16. Rate Of Change Lenght( Roc ) oscillator
17. WaveTrend Oscillator . It was created by @fskrypt.
18. Ehlers Adaptive CG Indicator . It was created by @LazyBear
19. Insync Index. It was created by @LazyBear
This script works by listening to the indicators and oscillators above. Opens new position after receiving signal verification signal from all
So how does this strategy close your position (optional).
1. You can close the position with the trailing stop option.
2. You can close the position according to the Rsi limits. To give an example. After a long position is opened, you can close the position after the rsi has risen above 70.
3. You can close the position according to the Bollinger Band . After a position is opened, you can close the position after the price moves out of the bollinger Band .
You can also change the values of indicators as desired. If you get better results. I would appreciate it if you could contact me via comment or private message.
I set the commission rate at 0.075 percent. If you want, you can change the settings yourself and make backtest.I changed the default settings for some indicators.
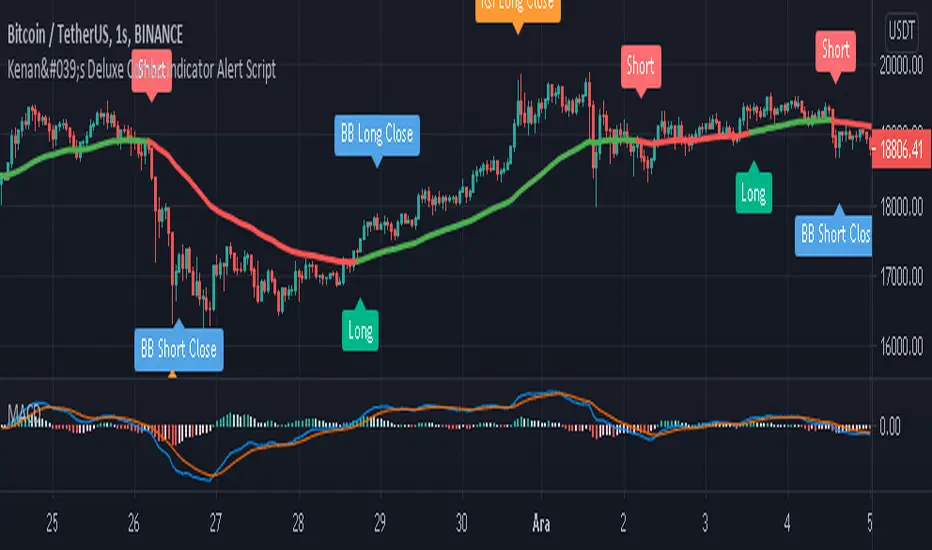
Kenan's Deluxe Combo Indicator Alert ScriptThis is a combo strategy of sorts. I've been able to come up with this strategy after a lot of research.
Under Normal circumstances, when people look at dozens of indicators and they all signal, they open positions. So I decided to save people the trouble and put the major indicators together in a strategy.
All of the classic cross strategies usually give a lot of signal. Some of these signals are unnecessary and incorrect signals. Combining leading indicators. I tried to avoid the faulty signals.
Indicators and oscillators included in this strategy are:
1. Ema 5/13/21
2. Macd
3. Macd Dema
4. Ichimoku
5. Dmi
6. Stochastic
7. Aroon
8. Bollinger Band
9. Rsi
10. Chande Momentum Oscillator
11. Exponential Ease of Movement ( Eom )
12. Klinger Oscillator
13. Stochastic RSI
14. Ultimate Oscillator
15. Woodies CCI
16. Rate Of Change Lenght( Roc ) oscillator
17. WaveTrend Oscillator . It was created by @fskrypt.
18. Ehlers Adaptive CG Indicator . It was created by @LazyBear
19. Insync Index. It was created by @LazyBear
This script works by listening to the indicators and oscillators above. Opens new position after receiving signal verification signal from all
So how does this strategy close your position (optional).
1. You can close the position with the trailing stop option.
2. You can close the position according to the Rsi limits. To give an example. After a long position is opened, you can close the position after the rsi has risen above 70.
3. You can close the position according to the Bollinger Band . After a position is opened, you can close the position after the price moves out of the bollinger Band .
You can also change the values of indicators as desired. If you get better results. I would appreciate it if you could contact me via comment or private message.
I set the commission rate at 0.075 percent. If you want, you can change the settings yourself and make backtest.I changed the default settings for some indicators.
Range identifier by angleThis study tries to highlight ranges
as they are defined by
TradingLatino TradingView user.
A range according to its definition would consist of
periods when the price does not move a lot.
It's aimed at BTCUSDT pair and 4h timeframe.
HOW IT WORKS
Price source is the middle between open and close values.
For each of the bars a '5' periods regression line is calculated
The regression line has an angle with the 0-axis line
which might be between 0 and 90.
0 angle would mean price is always the same
90 angle would mean price going to infinity
When '2' of those periods in a row
have their angles between a maximum angle
and a minimum angle then you have the range
SETTINGS
Price range bar periods : How many previous periods are used to calculate the bar regression line
Price range range periods : How many periods in a row should be used to say that there is a range
Price range maximum angle ( < 90.0 !!! ): Maximum angle for range detection
Price range minimum angle ( > -90.0 !!! ): Mininum angle for range detection
Angles should be set from -89.99 for the minimum angle to +89.99 for the maximum angle
WARNING
Despite the name indicator does not identify the entire range.
It identifies when you realise you are inside a range.
E.g. If a range length is 8 periods length this range indicator
will highlight only the last 6 periods of the range.
USAGE
If your strategy signals you an upwards trend
then you might use this range detector
to know when to exit your long position
Why?
Because most of the times
the price is found to be
in a range it goes down
FEEDBACK 1
I'm quite sure this range approach by comparing angles is a novel one.
I have checked Range Identifier script from TradingView LazyBear user
and it uses another approach.
I'm interested on different approaches on how to detect ranges.
FEEDBACK 2
I have only used this identifier in BTCUSDT 4h timeframe.
I'm interested to know if applying it more traditional
stocks the degrees need to be adjusted to something
more smaller.
PINE SCRIPT TRICK
This script simulates looping an string char by char
in pine script.
CREDITS
I have reused and adapted some code from
'TF Segmented Linear Regression' script
which it's from TradingView alexgrover user.

Buy/Sell IndicatorBased on logic from many top contributors here, the script utilizes LazyBear's WaveTrend Oscillator Indicator along with custom code to plot a few key components for daily trading;
Boundaries for entry and exit points which are based on a 6-day trend in OPEN/HIGH and OPEN/LOW prices.
Daily HIGH and LOW points to establish a good view of stock's movements
Entry and exit points with confidence levels. These can be treated as entry points for short to medium term investments
Entry points come in the colours of White and Lime, where white is slightly confident and lime is extremely confident
Exit points come in the colours of Maroon, and Red, where maroon is slightly confident and red is extremely confident
Each Entry and Exit point also comes without text, or with a M or H above it, where M indicates medium confidence on the point and an O indicates overconfidence.
Use Case:
The best possible use case is to enter a trade on a LIME point with O text, this means that is an overconfident entry point.
The trade should be exited on a RED point with O text, this means that is an overconfident exit point.
But you can do with the indicators as you please.
In addition to LazyBear's code, the following existing models and indicators are taken into account:
RSI of closing price over a period of 25
EMA of RSI

Rsx Divergence Candle OverlayRSX Divergences on candles instead of in an oscillator to save space.
Divergences do not repaint and have instant confirmation.
RSX source used: Lazybear's

MATRIX Cash Flow IndicatorFull Credit goes to LazyBear for publishing Original Code.
I added:
Threshold lines that changes the color of Histogram based on if it exceeds Threshold lines. Ability to turn off and on.
Ability to Turn Histogram Off/On
Ability to turn Twiggs Money Flow Line Off/On
O crédito total vai para a LazyBear pela publicação do código original.
Eu adicionei:
Linhas de limite que alteram a cor do histograma com base em... se excederem as linhas de limite.
Capacidade de desligar e ligar.
Capacidade de ativar / desativar o histograma
Capacidade de ativar / desativar a linha de fluxo de dinheiro.

Weiss Wave Open Interest BarsFirstly :
LazyBear ' s "Weiss Wave " codes are used for open interests.
Original Weiss Wave Volume :
Let's start :
Open Interest vs. Volume: An Overview
Volume and open interest are two key measurements that describe the liquidity and activity of contracts In the options and futures markets. However, their meanings and applications are different. Volume refers to the number of contracts traded in a given period, while open interest denotes the number of active contracts.
Volume
Trading volume measures the number of options or futures contracts being exchanged between buyers and sellers, identifying the level of activity for that particular contract. For every buyer, there is a seller, and the transaction itself counts toward the daily volume.
Open Interest
Open interest indicates the number of options or futures contracts that are held by traders and investors in active positions. These positions have not been closed out, expired, or exercised. Open interest decreases when holders and writers of options (or buyers and sellers of futures) close out their positions. To close out positions, they must take offsetting positions or exercise their options. Open interest increases once again when investors and traders open new long positions or writers/sellers take on new short positions. Open interest also increases when new options or futures contracts are created.
Options or futures contract trading volume can only increase while open interest can either increase or decrease. While trading volume indicates the number of contracts that have been bought or sold, open interest identifies the number of contracts that are currently held.
Reference : www.investopedia.com
*** Worked to define all futures . You can look them in codes (between line : 13 to line 94 )
** CAUTION 1 : Since each instrument in the list has its own unique contract data, you must first enter its name to display it. I recommend you to select OANDA from the markets. Finally, when the COT reports are issued, it may repaints. However, this repaint is usually close to closing or after close .(When COT reports are so sharp ) So use this script only 1W ( 1 week ) or 1 M ( 1 month ) timeframe.
** CAUTION 2 : This data is taken to Tradingview with the help of Quandl. This is a tremendous possibility, but the system will not work if there is a malfunction.
Best regards.

Squeeze PRO Arrows [Makit0]SQUEEZE PRO INDICATOR v0.5Beta
Script based in:
original John Carter's ideas (SQUEEZE & SQUEEZE PRO)
LazyBear's script (Squeeze Momentum Indicator)
USE IT IN CONJUNCTION WITH THE SQUEEZE PRO INDICATOR
This system is based in the volatility reversion to the mean: volatility contraction leads to volatility expansion and the other way on
The arrows signal is a warning of volatility compression, more often than not this leads to a expansion of volatility and a move in the action price usually bigger than the expected move
Be aware of the trend direction don't take the arrows direction as certanty, use instead the momentum histogram in the Squeeze PRO Indicator to see the slope direction
By default the arrows are setted at 5 dots, they fire in the sixth dot after 5 dots of the same color. Try differents values to get more or less signals
here are 3 levels of compression:
Level 1: ORANGE, the lesser compresion level
Level 2: RED, the normal level marked by the original squeeze indicator
Level 3: YELLOW, the max compression level
The more the compression the bigger the after move
Simple and Exponential Moving Averages
There are 2 groups of Moving Averages within the indicator, the 8 & 21 EMAs and the 50, 100 & 200 SMAs
They are disabled by default, turn it on at your peace
Please check the John Carter's book (Mastering the Trade) and attend his webinars for more insight about the squeeze & squeeze pro systems
I'm starting at trading and learning every day, I attended one of his webinars about the Squeeze Pro, and with help of the LazyBear's Squeeze Momentum Indicator code up the Squeeze PRO.
Please be aware, I'm not an expert trader, only a developer with an idea: learn to pull out money from the market in a consistent way.
This is a Beta version, please feel free to comment and give feedback, anything you consider iteresting, the more you elaborate the better :D
Thanks you all!!!

Squeeze PRO Indicator [Makit0]SQUEEZE PRO INDICATOR v0.5Beta
Script based in:
original John Carter's ideas (SQUEEZE & SQUEEZE PRO) at simplertrading dot com
LazyBear's script (Squeeze Momentum Indicator) here at tradingview dot com
USE IT IN CONJUNCTION WITH THE SQUEEZE PRO ARROWS INDICATOR
This system is based in the volatility reversion to the mean: volatility contraction leads to volatility expansion and the other way on
The dot signal is a warning of volatility compression, more often than not this leads to a expansion of volatility and a move in the action price usually bigger than the expected move
Be aware of the trend direction, use the momentum histogram to see the slope direction
There are 3 levels of compression:
Level 1: ORANGE, the lesser compresion level
Level 2: RED, the normal level marked by the original squeeze indicator
Level 3: YELLOW, the max compression level
The more the compression the bigger the after move
The GREEN dots signal the volatility expansion out of the squeeze ranges
Please check the John Carter's book (Mastering the Trade) and attend his webinars for more insight about the squeeze & squeeze pro systems
I'm starting at trading and learning every day, I attended one of his webinars about the Squeeze Pro, and with help of the LazyBear's Squeeze Momentum Indicator code up the Squeeze PRO.
Please be aware, I'm not an expert trader, only a developer with an idea: learn to pull out money from the market in a consistent way.
This is a Beta version, please feel free to comment and give feedback, anything you consider iteresting, the more you elaborate the better :D
Thanks you all!!!
cbci cu//@version=3
// Constance Brown Composite Index
// Re-implementation of CBCI based upon LazyBear's version + source text
// References:
//
// original author: @LazyBear
// "Technical Analysis for Trading Professionals" by Constance Brown, pg. 369

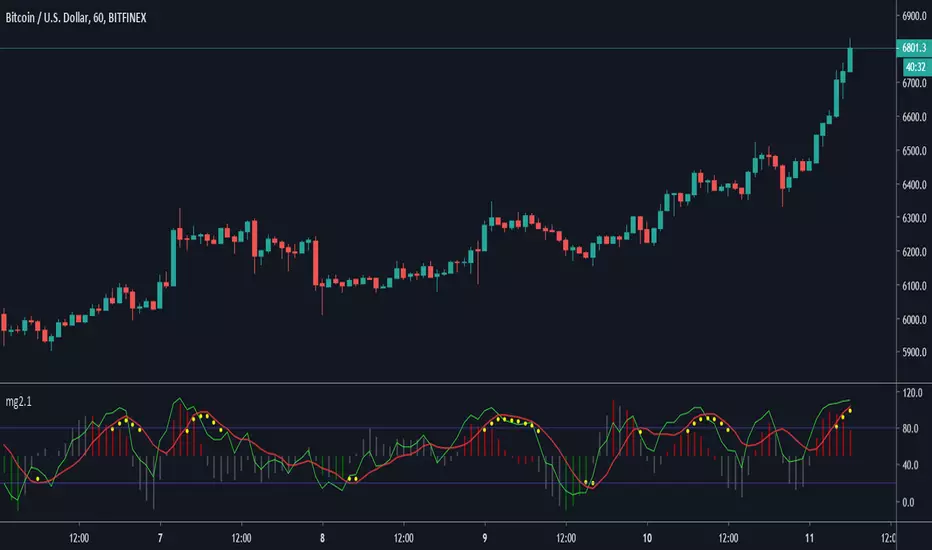
Minimal Godmode 2.1// Acknowledgments:
// Original Godmode Authors:
// @Legion, @LazyBear, @Ni6HTH4wK, @xSilas
// Drop a line if you use or modify this code.
// Godmode 3.1.4: @SNOW_CITY
// Godmode 3.2: @sco77m4r7in and @oh92
// Godmode3.2+LSMA: @scilentor
// Godmode 4.0.0-4.0.1: @chrysopoetics
// Jurik Moving Average: @everget
// Constance Brown Composite Index RSI: @LazyBear
// Wavetrend Oscillator: @fskrypt
// TTM Squeeze: @Greeny
// True TSI/RSI: @cI8DH and @chrysopoetics
// Laguerre RSI (Self-Adjusting Alpha with Fractals Energy): @everget
// RSI Shaded: @mortdiggiddy
// Minimal Godmode v2.0:
// 6 BTC pairs/exchanges (instead of 11) to reduce loading time from the pinescript security() function
// Volume Composite for engine calculation
// TTM Squeeze on Wavetrend Signal
// Constance Brown Composite Index RSI (CBCI)
// TrueTSI (Godmode 4.0.0 implementation)
// Laguerre RSI (LRSI)
// Minimal Godmode v2.1:
// Removed TTM Squeeze and Volume Composite
// EMA for Wavetrend Signal
// Multi-exchange for BTC no longer the default
// mg engine toggle for CBCI, Laguerre RSI, and TTSI
// Wavetrend Histogram component toggle
John Ehlers Universal Oscillator [mwlang]This version of John Ehlers Universal Oscillator fixes a degrees to radians bug in LazyBear's version published here:
Waddah Attar Explosion and WaveTrend Oscillator combinedWaddah Attar Explosion by LazyBear and WaveTrend Oscillator by Krypt.
All credits goes to LazyBear and Krypt, i have only done some combining with the two indicators, barcolors and BG colors to clarify entrys and exits.
Combine with CM_Williams Vix_Fix, Super Guppy R1.0 by JustUncleL and you have a powerful tool.
Barcolors to look for
Aggressive Buy 1 = Lime
Agressive Buy 2 = Aqua
Buy = Green
Sell 1 = Orange
Sell 2 = Red
This is my first try, so be nice to me :-)

Godmode 4.0.1 [Correlator]First off, a huge thank you to the following people:
@LEGION:
@LazyBear: www.tradingview.com
@xSilas: www.tradingview.com
@Ni6HTH4awK: www.tradingview.com
@sco77m4r7and:
@SNOW_CITY: www.tradingview.com
@oh92: www.tradingview.com
@alexgrover: www.tradingview.com
@cI8DH: www.tradingview.com
@DonovanWall: www.tradingview.com
This is my second iteration of Godmode. This time I allowed the possibility to correlate two benchmarks against one another, thereby giving you twice the signals (once there's a strong correlation between the two, inverse or otherwise). That aside, there are no changes to this indicator that the first iteration doesn't have:
There are still more iterations planned, but if you guys have any ideas or wishes regarding what direction I go, then please let me know.
Want to Learn?
If you'd like the opportunity to learn Pine but you have difficulty finding resources to guide you, take a look at this rudimentary list: docs.google.com
The list will be updated in the future as more people share the resources that have helped, or continue to help, them. Follow me on Twitter to keep up-to-date with the growing list of resources as well as any other scripts I publish.
Suggestions or Questions?
Don't even kinda hesitate to forward them to me. My (metaphorical) door is always open.

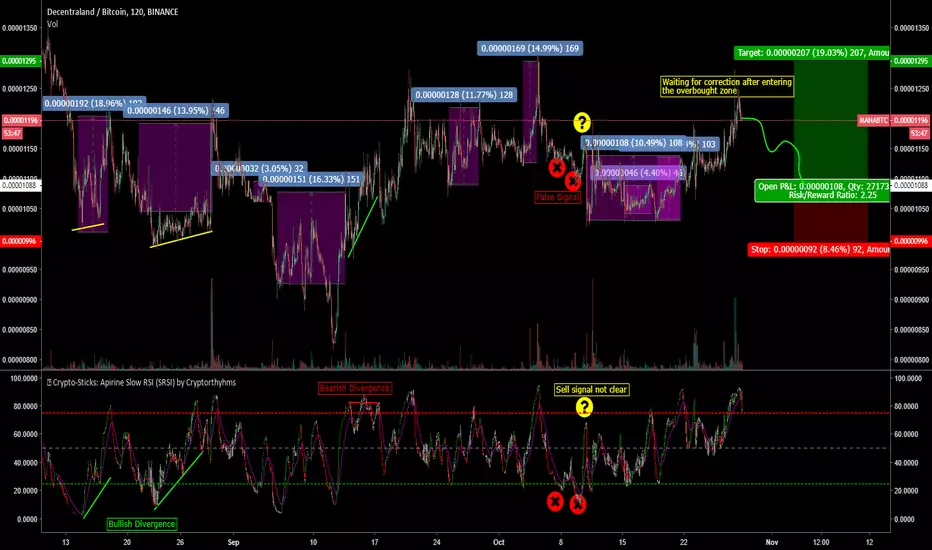
🥢 Crypto-Sticks: Apirine Slow RSI (SRSI) by Cryptorthyhms🥢 Crypto-Sticks™ Apirine Slow RSI (SRSI)
A new series of indicators brought to you by Cryptorthyhms...giving you an alternate look at your trusted favorites! Follow me, there are still 2 dozen Crypto-Sticks indicators planned - all will be released in public library.
🚀 Indicator Specific Info
🐻Thanks to Lazybear for posting the original Apirine RSI code I updated to create this indicator! (give that man a follow/thumbsup, hes a legend!)
New Crypto-Sticks option is an EMA of the average signal line output. Eventually I will go back and update the previous indicators with this feature as well!
⛔Please remember that you may have to adjust the overbought and oversold levels to suit the volatility of the instrument you are working with. In the future I will implement a feature that does this automatically, but for now its manual.
Heiken Ashi candles (default) adds some more clear trend changing points which can be executed at the second candle going in either direction. Other coins/charts will require their own strategy - you could potentially have to tweak that parameter. In this example you would enter on 2nd green, exit on 2nd red. HA Example:
Volume weighting the HA candles adds a different dimension to the indicator which I have to explore more fully.. In my opinion VW does not provide any benefit as is for this indicator. I left the option in for you though as YMMV. An example of VW+HA:
💭Please leave me any ideas or feedback you have!
🚫If you use volume weighting you should be on heiken candles.
🚀 Crypto-Sticks General Info
🚧This series isnt polished 100%, and I have some more options I will add in the future. But for now, I want to just release them, as I am not sure when I will have the time to put more work into them (many other big projects I am working on).
📊Its basically reinterpretations of all your favorite indicators. I calculate the values a little bit differently than normal, but the end result is creating a candlestick chart (for the indicator!). Then I added the option to plot them as Heiken Ashi candles to smooth out noise and make signaling easier. I recommend using the indicator on this setting.
🔊Lastly I implemented a Volume Weighting system for them all which simply integrates volume into the formulas for these indicators. For the most part this feature is experimental and doesn't provide huge utility (yet - I have other ways I want to try it as well - just no time). Though on some of the indicators it already shows great promise.
👍Enjoying this indicator or find it useful? Please give me a like and follow! There are many more indicators to be released in this series, not to mention I post crypto analysis and other free indicators regularly.
💬Questions? Comments? Want to get access to an entire suite of proven trading indicators? Come visit us on telegram and chat, or just soak up some knowledge. We make timely posts about the market, news, and strategy everyday. Our community isnt open only to subscribers - everyone is welcome to join.
Earnings Support and Resistance Levels [NeoButane]Inspired by @LazyBear's/@timwest's script:
Usage: support and resistance levels based on averaging price around earnings and quarterly opens.
What it is plotting:
1. A horizontal level whenever earnings occur. If actual earnings is higher than estimated, the line turns green, else red.
2. A horizontal level every quarterly open, colored black.
3. An average between the two mentioned above, colored orange.
4. 5% moves away from 3M open and earnings
5. Misc: 5% move away from that 5% move away, then 10% move away from the 2nd 5% move away.
By default, 4 and 5 are off to reduce visual noise.
Idea: Traders panic around certain dates that always happen, and traders always panic in the wrong direction. The market is composed of traders trading in the wrong direction at the same time, all the time. That means price will bounce back and forth as the gambling dens colloquially known as 'forex brokerages' or 'stock exchanges' take your money in the form of fees, time, and liquidations. So I put two lines on the chart and put one right in between, because it always goes back. I hope you can find it useful!
Note: This was a part of the old fundamental data indicators and is not officially for use, so while it should work on most U.S. stocks and a couple of other exchanges, it is not perfect.

Chaikin MF% (CMFP) w. Alerts, Bells & Whistles [LucF]This is Chaikin’s Money Flow indicator on a 0-100 scale with buy/sell signals, alerts and other bells & whistles.
It includes:
- a fast EMA (16 periods by default),
- a slow MA (64 periods by default),
- histograms,
- 3 different sorts of crosses,
- big swings identification,
- buy/sell signals on CMFP crossing back from outside user-defined levels,
- buy/sell signals on the slow MA pivots above/below user-defined levels,
- alerts on big swings and buy/sells.
This indicator started with @LazyBear code (VAPI) at:
@cI8DH then changed the scale to 0-100, which I find very useful:
I then added the rest.
The chart above shows both clean and busy versions of the indicator.
Note that the default length is 10 rather than the commonly used 20. I use CMFP in conjunction with VFI and like the fact that it is faster than VFI. The default inputs show the way I normally use this indicator, with the slow MA shown in histogram mode. I find it gives good context to the signal line. Crosses between the two are often useful.
The buy/sell signals aren’t the main attraction of this indicator, and nothing to write home about. Like the big swing markers, I think it’s more realistic to view them as pointers to potentially interesting areas on charts. Their nature makes them more suited to identifying reversals. They certainly aren’t reliable enough to turn this study into a strategy and I normally don’t use them. The levels pre-defined for the buy/sell signals on CMFP are most useful on short intervals. The buy/sell signals on the slow MA pivots work on a more complete range of intervals. Optimization for your specific instruments and intervals will improve their reliability.
As usual when defining alerts, be sure you already have defined proper inputs and that you are on the intended interval, as they will be used when triggering alerts.

Squeeze Impulse IndicatorCorrected version of "Squeeze Momentum Indicator LazyBear" based on the volatility indicator "TTM Squeeze".
The indicator allows you to find good entry points, and also shows the probability of squeeze in advance.
Black crosses show an accumulation (decrease in volatility) that the market is preparing for a sharp squeeze (up or down).
Gray crosses, after black, mean the early start of a price spurt - squeeze.
A change in color indicates a change in direction (Up or Down).
Light green - Bull market (Price goes up)
Dark Green - Moving to a bear market (Beginning of price reduction)
Light red - Bear market (Price goes down)
Dark Red - Moving to a bear market (Start rising prices)
-=-=-=-=-=-=-=-=-
Исправленная версия "Squeeze Momentum Indicator LazyBear" на основе индикатора волатильности "TTM Squeeze".
Индикатор позволяет находить хорошие точки входа, а так же заранее показывает вероятность сквиза.
Черные крестики показывают накопление (снижение волатильности), что рынок готовиться в резкому сквизу (вверх или вниз).
Серые крестики, после черных, означают скорое начало рывка цены - сквиза.
Изменение цвета говорит об изменении направления (Вверх или вниз).
Светло-зеленый - Бычий рынок (Цена идет вверх)
Темно-зеленый - Переход в медвежий рынок (Начало снижения цены)
Светло-красный - Медвежий рынок (Цена идет вниз)
Темно-красный - Переход в медвежий рынок (Начало рост цены)

Twiggs Money Flow Fisher Transform// Credits to @LazyBear
// This is an experimental indicator (Originaly coded by Lazybear) modified by @haidinurhasfi by applying the Fisher Transform to Twiggs Money Flow.
// Tune the length according to your trading style and instrument