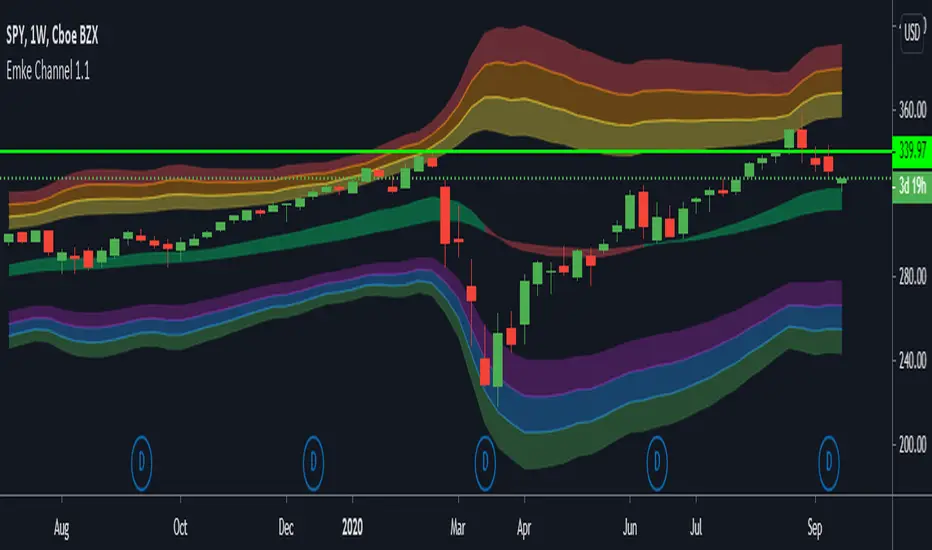
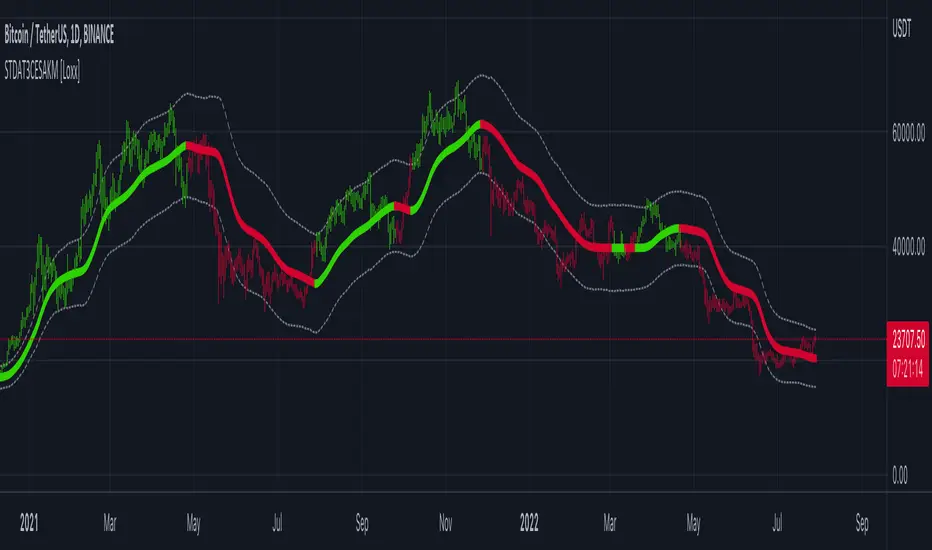
EMA Keltner Channel 1D100/200 EMAs, along with Keltner Bands based off them. Colors correspond to actions you should be ready to take in the area. Use to set macro mindset.
Uses the security function to display only the 1D values.
Red= Bad
Orange = Not as Bad, but still Bad.
Yellow = Warning, might also be Bad.
Purple = Dip a toe in.
Blue = Give it a shot but have a little caution.
Green = It's second mortgage time.
ค้นหาในสคริปต์สำหรับ "KELTNER"
Zero Lag Keltner ChannelsThis is Keltner Channelz (KC) with Zero Lag Moving Average (ZLMA as base). It is smoother and has less lag than the original (EMA/SMA) variant.
It also can be used as a trend indicator and trend confirmation indicator. The upper and lower bands are green if it is an up trend, and red if a down trend. If both have the same color it is a stronger trend.
Bollinger Bands and Keltner Channel (BB and KC)Script that combines 2 Bollinger Bands (Std Dev = 1 and Std Dev = 2) with Keltner Channel (Std Dev = 1.5)
Keltner Channel Strategy by Kevin DaveyKeltner Channel Strategy Description
The Keltner Channel Strategy is a volatility-based trading approach that uses the Keltner Channel, a technical indicator derived from the Exponential Moving Average (EMA) and Average True Range (ATR). The strategy helps identify potential breakout or mean-reversion opportunities in the market by plotting upper and lower bands around a central EMA, with the channel width determined by a multiplier of the ATR.
Components:
1. Exponential Moving Average (EMA):
The EMA smooths price data by placing greater weight on recent prices, allowing traders to track the market’s underlying trend more effectively than a simple moving average (SMA). In this strategy, a 20-period EMA is used as the midline of the Keltner Channel.
2. Average True Range (ATR):
The ATR measures market volatility over a 14-period lookback. By calculating the average of the true ranges (the greatest of the current high minus the current low, the absolute value of the current high minus the previous close, or the absolute value of the current low minus the previous close), the ATR captures how much an asset typically moves over a given period.
3. Keltner Channel:
The upper and lower boundaries are set by adding or subtracting 1.5 times the ATR from the EMA. These boundaries create a dynamic range that adjusts with market volatility.
Trading Logic:
• Long Entry Condition: The strategy enters a long position when the closing price falls below the lower Keltner Channel, indicating a potential buying opportunity at a support level.
• Short Entry Condition: The strategy enters a short position when the closing price exceeds the upper Keltner Channel, signaling a potential selling opportunity at a resistance level.
The strategy plots the upper and lower Keltner Channels and the EMA on the chart, providing a visual representation of support and resistance levels based on market volatility.
Scientific Support for Volatility-Based Strategies:
The use of volatility-based indicators like the Keltner Channel is supported by numerous studies on price momentum and volatility trading. Research has shown that breakout strategies, particularly those leveraging volatility bands such as the Keltner Channel or Bollinger Bands, can be effective in capturing trends and reversals in both trending and mean-reverting markets  .
Who is Kevin Davey?
Kevin Davey is a highly respected algorithmic trader, author, and educator, known for his systematic approach to building and optimizing trading strategies. With over 25 years of experience in the markets, Davey has earned a reputation as an expert in quantitative and rule-based trading. He is particularly well-known for winning several World Cup Trading Championships, where he consistently demonstrated high returns with low risk.

Keltner Channel - APEXKeltner Channels are volatility-based bands built above and below an exponential moving average. This indicator is similar to Bollinger Bands but instead of Standart deviation of using the standard deviation uses the Average True Range (ATR) to set channel distance. The Keltner Channels it present for only allow EMA addition and EMA smoothing. Therefore I have taken the liberty to add those as default.
You can use the channels in its form to help you get into more volatile moves and thus getting out faster. I wanted to show an approach of screening area below a moving average by adding min max ATR. In Apex you will have to use 2 Keltner Channels with 2 Signals to build this up.
This feature will be available first in v1 APEX.

Keltner Channels MTFKeltner Channels MTF | Adapted 🌌
Navigate the market’s wild waves with these Keltner Channels, a sleek spin on AlchimistOfCrypto’s Bollinger Bands! This Pine Script v6 indicator tracks price action like a radar, highlighting trends with scientific precision. 🧪
Key Features:
Customizable Channels: Adjust period and multiplier to map market volatility, signaling potential reversals when prices hit the upper or lower bands. 📈
MA Options: Switch between Exponential or Simple Moving Average for trend clarity. ⚙️
Band Styles: Select Average True Range, True Range, or Range to define volatility edges. 📏
Glow Effect: Illuminate bands with 8 vibrant themes (Neon, Grayscale, etc.) for visual pop. ✨
Trend Signals: Spot bullish/bearish shifts with glowing circles, flagging momentum changes. 💡
Alerts: Catch price breakouts or trend reversals at band edges, warning of potential market U-turns. 🚨
Perfect for traders decoding market trends with a touch of cosmic style! 🌠


Keltner Channel + RSIKeltner Channel and RSI use together. They tell us when the trend will turn.
Fave fun!!
Scalping Trading System bot Crypto and StocksThis is a trend trading strategy scalping bot that can work with any type of market. However I concluded my tests so far with Crypto, Stocks and Forex, and with optimizations always could be found some profitable settings.
Indicators
SImple Moving Average
Exponential Moving Average
Keltner Channels
MACD Histogram
Stochastics
Rules for entry
long= Close of the candle bigger than both moving averages and close of the candle is between the top and bot levels from Keltner. At the same time the macd histogram is negative and stochastic is below 50.
short= Close of the candle smaller than both moving averages and close of the candle is between the top and bot levels from Keltner. At the same time the macd histogram is positive and stochastic is above 50.
Rules for exit
We exit when we meet an opposite reverse order.
This strategy has no risk management inside, so use it with caution !

STD-Adaptive T3 Channel w/ Ehlers Swiss Army Knife Mod. [Loxx]STD-Adaptive T3 Channel w/ Ehlers Swiss Army Knife Mod. is an adaptive T3 indicator using standard deviation adaptivity and Ehlers Swiss Army Knife indicator to adjust the alpha value of the T3 calculation. This helps identify trends and reduce noise. In addition. I've included a Keltner Channel to show reversal/exhaustion zones.
What is the Swiss Army Knife Indicator?
John Ehlers explains the calculation here: www.mesasoftware.com
What is the T3 moving average?
Better Moving Averages Tim Tillson
November 1, 1998
Tim Tillson is a software project manager at Hewlett-Packard, with degrees in Mathematics and Computer Science. He has privately traded options and equities for 15 years.
Introduction
"Digital filtering includes the process of smoothing, predicting, differentiating, integrating, separation of signals, and removal of noise from a signal. Thus many people who do such things are actually using digital filters without realizing that they are; being unacquainted with the theory, they neither understand what they have done nor the possibilities of what they might have done."
This quote from R. W. Hamming applies to the vast majority of indicators in technical analysis . Moving averages, be they simple, weighted, or exponential, are lowpass filters; low frequency components in the signal pass through with little attenuation, while high frequencies are severely reduced.
"Oscillator" type indicators (such as MACD , Momentum, Relative Strength Index ) are another type of digital filter called a differentiator.
Tushar Chande has observed that many popular oscillators are highly correlated, which is sensible because they are trying to measure the rate of change of the underlying time series, i.e., are trying to be the first and second derivatives we all learned about in Calculus.
We use moving averages (lowpass filters) in technical analysis to remove the random noise from a time series, to discern the underlying trend or to determine prices at which we will take action. A perfect moving average would have two attributes:
It would be smooth, not sensitive to random noise in the underlying time series. Another way of saying this is that its derivative would not spuriously alternate between positive and negative values.
It would not lag behind the time series it is computed from. Lag, of course, produces late buy or sell signals that kill profits.
The only way one can compute a perfect moving average is to have knowledge of the future, and if we had that, we would buy one lottery ticket a week rather than trade!
Having said this, we can still improve on the conventional simple, weighted, or exponential moving averages. Here's how:
Two Interesting Moving Averages
We will examine two benchmark moving averages based on Linear Regression analysis.
In both cases, a Linear Regression line of length n is fitted to price data.
I call the first moving average ILRS, which stands for Integral of Linear Regression Slope. One simply integrates the slope of a linear regression line as it is successively fitted in a moving window of length n across the data, with the constant of integration being a simple moving average of the first n points. Put another way, the derivative of ILRS is the linear regression slope. Note that ILRS is not the same as a SMA ( simple moving average ) of length n, which is actually the midpoint of the linear regression line as it moves across the data.
We can measure the lag of moving averages with respect to a linear trend by computing how they behave when the input is a line with unit slope. Both SMA (n) and ILRS(n) have lag of n/2, but ILRS is much smoother than SMA .
Our second benchmark moving average is well known, called EPMA or End Point Moving Average. It is the endpoint of the linear regression line of length n as it is fitted across the data. EPMA hugs the data more closely than a simple or exponential moving average of the same length. The price we pay for this is that it is much noisier (less smooth) than ILRS, and it also has the annoying property that it overshoots the data when linear trends are present.
However, EPMA has a lag of 0 with respect to linear input! This makes sense because a linear regression line will fit linear input perfectly, and the endpoint of the LR line will be on the input line.
These two moving averages frame the tradeoffs that we are facing. On one extreme we have ILRS, which is very smooth and has considerable phase lag. EPMA has 0 phase lag, but is too noisy and overshoots. We would like to construct a better moving average which is as smooth as ILRS, but runs closer to where EPMA lies, without the overshoot.
A easy way to attempt this is to split the difference, i.e. use (ILRS(n)+EPMA(n))/2. This will give us a moving average (call it IE /2) which runs in between the two, has phase lag of n/4 but still inherits considerable noise from EPMA. IE /2 is inspirational, however. Can we build something that is comparable, but smoother? Figure 1 shows ILRS, EPMA, and IE /2.
Filter Techniques
Any thoughtful student of filter theory (or resolute experimenter) will have noticed that you can improve the smoothness of a filter by running it through itself multiple times, at the cost of increasing phase lag.
There is a complementary technique (called twicing by J.W. Tukey) which can be used to improve phase lag. If L stands for the operation of running data through a low pass filter, then twicing can be described by:
L' = L(time series) + L(time series - L(time series))
That is, we add a moving average of the difference between the input and the moving average to the moving average. This is algebraically equivalent to:
2L-L(L)
This is the Double Exponential Moving Average or DEMA , popularized by Patrick Mulloy in TASAC (January/February 1994).
In our taxonomy, DEMA has some phase lag (although it exponentially approaches 0) and is somewhat noisy, comparable to IE /2 indicator.
We will use these two techniques to construct our better moving average, after we explore the first one a little more closely.
Fixing Overshoot
An n-day EMA has smoothing constant alpha=2/(n+1) and a lag of (n-1)/2.
Thus EMA (3) has lag 1, and EMA (11) has lag 5. Figure 2 shows that, if I am willing to incur 5 days of lag, I get a smoother moving average if I run EMA (3) through itself 5 times than if I just take EMA (11) once.
This suggests that if EPMA and DEMA have 0 or low lag, why not run fast versions (eg DEMA (3)) through themselves many times to achieve a smooth result? The problem is that multiple runs though these filters increase their tendency to overshoot the data, giving an unusable result. This is because the amplitude response of DEMA and EPMA is greater than 1 at certain frequencies, giving a gain of much greater than 1 at these frequencies when run though themselves multiple times. Figure 3 shows DEMA (7) and EPMA(7) run through themselves 3 times. DEMA^3 has serious overshoot, and EPMA^3 is terrible.
The solution to the overshoot problem is to recall what we are doing with twicing:
DEMA (n) = EMA (n) + EMA (time series - EMA (n))
The second term is adding, in effect, a smooth version of the derivative to the EMA to achieve DEMA . The derivative term determines how hot the moving average's response to linear trends will be. We need to simply turn down the volume to achieve our basic building block:
EMA (n) + EMA (time series - EMA (n))*.7;
This is algebraically the same as:
EMA (n)*1.7-EMA( EMA (n))*.7;
I have chosen .7 as my volume factor, but the general formula (which I call "Generalized Dema") is:
GD (n,v) = EMA (n)*(1+v)-EMA( EMA (n))*v,
Where v ranges between 0 and 1. When v=0, GD is just an EMA , and when v=1, GD is DEMA . In between, GD is a cooler DEMA . By using a value for v less than 1 (I like .7), we cure the multiple DEMA overshoot problem, at the cost of accepting some additional phase delay. Now we can run GD through itself multiple times to define a new, smoother moving average T3 that does not overshoot the data:
T3(n) = GD ( GD ( GD (n)))
In filter theory parlance, T3 is a six-pole non-linear Kalman filter. Kalman filters are ones which use the error (in this case (time series - EMA (n)) to correct themselves. In Technical Analysis , these are called Adaptive Moving Averages; they track the time series more aggressively when it is making large moves.
Included:
Bar coloring
Signals
Alerts
Loxx's Expanded Source Types
Keltner Channel [LINKUSDT] 1HThis is a long-only strategy tested on LINK/USDT, 1 hour bar, from Feb 2019. The entry is determined by the breakout of upper Keltnel Channel and when the +DI is higher than 32. Instead of a fixed stop-loss from the original script , I change the exit to the middle band of the Keltnel Channel. 1st profit target will close 20% of the position. 2nd profit target will close 30% of the position. While the remaining 50% position will be closed when the price closes below the middle band of the Keltnel Channel, to take advantage of big trend. All parameters are adjustable. I added another option to enable or disable the ribbon trend filter.
My thoughts: For the same period, LINK appreciated 3000%. So I guess most in and out strategies couldn’t beat a buy and hold strategy during this period. But this doesn’t mean that this strategy is not feasible as each strategy is designed to only take advantage of a certain pattern or behavior of the market. Also, short term strategies allow you to use leverage and hence enable you to use you capital efficiently. Commission is set to 0.1%, taking account of the slippage.
Suggestion: Please perform walk forward analysis before you use real money for trading. Parameters need to be adjusted from time to time depends on your analysis. Can try using ATR for profit targets as over a longer term, the volatility might drop hence a high fixed % profit targets might not be realistic.
Any suggestions are welcome!

Keltner Channels Linda RaschkeThis channel is a second version designed by the famous american analyst Linda Raschke; it allows you to find the main trend and to implement a trend-following strategy. You can open a new long/short position when the price cross up the basis and the upper/lower band (jointly with other indicators).

Keltner Channels Oscillator v3V2 with Bollinger Bands
Planning to make an STO/KCO hybrid and a model strategy for an all-in-one indicator.
Keltner Channel StrategyOverview
The Keltner Channel Strategy is a powerful trend-following and mean-reversion system that leverages the Keltner Channels, EMA crossovers, and ATR-based stop-losses to optimize trade entries and exits. This strategy has proven to be highly effective, particularly when applied to Gold (XAUUSD) and other commodities with strong trend characteristics.
📈 How It Works
This strategy incorporates two trading approaches: 1️⃣ Keltner Channel Reversal Trades – Identifies overbought and oversold conditions when price touches the outer bands.
2️⃣ Trend Following Trades – Uses the 9 EMA & 21 EMA crossover, with confirmation from the 50 EMA, to enter trades in the direction of the trend.
🔍 Entry & Exit Criteria
📊 Keltner Channel Entries (Reversal Strategy)
✅ Long Entry: When the price crosses below the lower Keltner Band (potential reversal).
✅ Short Entry: When the price crosses above the upper Keltner Band (potential reversal).
⏳ Exit Conditions:
Long positions close when price crosses back above the mid-band (EMA-based).
Short positions close when price crosses back below the mid-band (EMA-based).
📈 Trend Following Entries (Momentum Strategy)
✅ Long Entry: When the 9 EMA crosses above the 21 EMA, and price is above the 50 EMA (bullish momentum).
✅ Short Entry: When the 9 EMA crosses below the 21 EMA, and price is below the 50 EMA (bearish momentum).
⏳ Exit Conditions:
Long positions close when the 9 EMA crosses back below the 21 EMA.
Short positions close when the 9 EMA crosses back above the 21 EMA.
📌 Risk Management & Profit Targeting
ATR-based Stop-Losses:
Long trades: Stop set at 1.5x ATR below entry price.
Short trades: Stop set at 1.5x ATR above entry price.
Take-Profit Levels:
Long trades: Profit target 2x ATR above entry price.
Short trades: Profit target 2x ATR below entry price.
🚀 Why Use This Strategy?
✅ Works exceptionally well on Gold (XAUUSD) due to high volatility.
✅ Combines reversal & trend strategies for improved adaptability.
✅ Uses ATR-based risk management for dynamic position sizing.
✅ Fully automated alerts for trade entries and exits.
🔔 Alerts
This script includes automated TradingView alerts for:
🔹 Keltner Band touches (Reversal signals).
🔹 EMA crossovers (Momentum trades).
🔹 Stop-loss & Take-profit activations.
📊 Ideal Markets & Timeframes
Best for: Gold (XAUUSD), NASDAQ (NQ), Crude Oil (CL), and trending assets.
Recommended Timeframes: 15m, 1H, 4H, Daily.
⚡️ How to Use
1️⃣ Add this script to your TradingView chart.
2️⃣ Select a 15m, 1H, or 4H timeframe for optimal results.
3️⃣ Enable alerts to receive trade notifications in real time.
4️⃣ Backtest and tweak ATR settings to fit your trading style.
🚀 Optimize your Gold trading with this Keltner Channel Strategy! Let me know how it performs for you. 💰📊

Keltner Channel+EMA with Buy/Sell SignalsIndicator Name: Double Keltner Channel with EMA (Buy/Sell Signals)
Description:
This indicator is designed to help traders identify potential trend reversals and generate buy/sell signals in volatile markets. It combines two Keltner Channels with different sensitivities (multipliers of 2.6 and 3.8) to visualize dynamic support and resistance levels. The addition of a 20-period EMA helps confirm trend direction and filter out potential false signals.
How the Indicator Works:
• Keltner Channels: These bands dynamically adjust to changing market volatility, offering a visual representation of potential price ranges. The 2.6 multiplier Keltner Channel (KC) is more sensitive to price changes, potentially highlighting short-term reversals, while the 3.8 multiplier KC focuses on broader trend shifts.
• 20-period EMA: This widely used trend indicator helps smooth out price fluctuations and identify the underlying direction of the market.
• Buy Signals: Generated when a candle's low touches or crosses below either Keltner Channel's lower band, and within the next 6 candles, that same candle closes above the 20 EMA. This combination suggests a potential rejection of lower prices (support) and a possible resumption of the uptrend.
• Sell Signals: Mirror the buy signal logic but are triggered when the candle's high touches or crosses above either Keltner Channel's upper band and then closes below the 20 EMA within the next 6 candles. This indicates a potential rejection of higher prices (resistance) and a possible shift to a downtrend.
How to Use the Indicator:
1. Identify the Trend: Use the 20 EMA to determine the overall trend direction. Look for buy signals primarily in uptrends and sell signals in downtrends.
2. Confirm with RSI : While not included in this indicator, consider using a separate Relative Strength Index (RSI) with a length of 10, SMA type, MA length of 14, and standard deviation of 2. Look for oversold conditions (RSI below 20) to confirm buy signals and overbought conditions (RSI above 80) to confirm sell signals.
3.Apply Risk Management: Always use appropriate risk management techniques, such as stop-loss orders, to protect your capital.
Key Points:
• This indicator is most effective in trending markets.
• It is not a standalone trading system and should be used in conjunction with other analysis tools and confirmation.
• The Keltner Channel multiplier values can be adjusted to suit your trading style and risk tolerance.
Important Disclaimer:
This indicator is a modification of the original Keltner Channel code and is intended for educational and informational purposes only.
It does not constitute financial advice. Always conduct your own research and consult with a qualified financial advisor before making any investment decisions.

Keltner Channel Strategy with Golden CrossOnly trade with the trend.
This Keltner Channel-based strategy that will only enter into a trade if the signal of the Keltner Channel agrees with a moving average crossover as defined by the user.
Long Position Entries
2 Conditions must be present
1. There must be a Golden Cross (lower period moving average is above higher period moving average). ex 50 period MA > 200 period MA.
2. Price must cross above the Keltner Channel ATR defined by the user.
Short Position Entries
2 Conditions must be present
1. There must be a Death Cross (lower period moving average is below higher period moving average). ex 50 period MA < 200 period MA.
2. Price must cross below the Keltner Channel ATR defined by the user
Closing Trades:
The strategy closes trades as follows:
1. Price crossing the Keltner Channel's Take Profit ATR (defined by User)
2. Price crossing the Keltner Channel's Stop Loss ATR (defined by User)

Keltner Channel Based Grid Strategy # KC Grid Strategy - Keltner Channel Based Grid Trading System
## Strategy Overview
KC Grid Strategy is an innovative grid trading system that combines the power of Keltner Channels with dynamic position sizing to create a mean-reversion trading approach. This strategy automatically adjusts position sizes based on price deviation from the Keltner Channel center line, implementing a systematic grid-based approach that capitalizes on market volatility and price oscillations.
## Core Principles
### Keltner Channel Foundation
The strategy builds upon the Keltner Channel indicator, which consists of:
- **Center Line**: Moving average (EMA or SMA) of the price
- **Upper Band**: Center line + (ATR/TR/Range × Multiplier)
- **Lower Band**: Center line - (ATR/TR/Range × Multiplier)
### Grid Trading Logic
The strategy implements a sophisticated grid system where:
1. **Position Direction**: Inversely correlated to price position within the channel
- When price is above center line → Short positions
- When price is below center line → Long positions
2. **Position Size**: Proportional to distance from center line
- Greater deviation = Larger position size
3. **Grid Activation**: Positions are adjusted only when the difference exceeds a predefined grid threshold
### Mathematical Foundation
The core calculation uses the KC Rate formula:
```
kcRate = (close - ma) / bandWidth
targetPosition = kcRate × maxAmount × (-1)
```
This creates a mean-reversion system where positions increase as price moves further from the mean, expecting eventual return to equilibrium.
## Parameter Guide
### Time Range Settings
- **Start Date**: Beginning of strategy execution period
- **End Date**: End of strategy execution period
### Core Parameters
1. **Number of Grids (NumGrid)**: Default 12
- Controls grid sensitivity and position adjustment frequency
- Higher values = More frequent but smaller adjustments
- Lower values = Less frequent but larger adjustments
2. **Length**: Default 10
- Period for moving average and volatility calculations
- Shorter periods = More responsive to recent price action
- Longer periods = Smoother, less noisy signals
3. **Grid Coefficient (kcRateMult)**: Default 1.33
- Multiplier for channel width calculation
- Higher values = Wider channels, less frequent trades
- Lower values = Narrower channels, more frequent trades
4. **Source**: Default Close
- Price source for calculations (Close, Open, High, Low, etc.)
- Close price typically provides most reliable signals
5. **Use Exponential MA**: Default True
- True = Uses EMA (more responsive to recent prices)
- False = Uses SMA (equal weight to all periods)
6. **Bands Style**: Default "Average True Range"
- **Average True Range**: Smoothed volatility measure (recommended)
- **True Range**: Current bar's volatility only
- **Range**: Simple high-low difference
## How to Use
### Setup Instructions
1. **Apply to Chart**: Add the strategy to your desired timeframe and instrument
2. **Configure Parameters**: Adjust settings based on market characteristics:
- Volatile markets: Increase Grid Coefficient, reduce Number of Grids
- Stable markets: Decrease Grid Coefficient, increase Number of Grids
3. **Set Time Range**: Define your backtesting or live trading period
4. **Monitor Performance**: Watch strategy performance metrics and adjust as needed
### Optimal Market Conditions
- **Range-bound markets**: Strategy performs best in sideways trending markets
- **High volatility**: Benefits from frequent price oscillations around the mean
- **Liquid instruments**: Ensures efficient order execution and minimal slippage
### Position Management
The strategy automatically:
- Calculates optimal position sizes based on account equity
- Adjusts positions incrementally as price moves through grid levels
- Maintains risk control through maximum position limits
- Executes trades only during specified time periods
## Risk Warnings
### ⚠️ Important Risk Considerations
1. **Trending Market Risk**:
- Strategy may underperform or generate losses in strong trending markets
- Mean-reversion assumption may fail during sustained directional moves
- Consider market regime analysis before deployment
2. **Leverage and Position Size Risk**:
- Strategy uses pyramiding (up to 20 positions)
- Large positions may accumulate during extended moves
- Monitor account equity and margin requirements closely
3. **Volatility Risk**:
- Sudden volatility spikes may trigger multiple rapid position adjustments
- Consider volatility filters during high-impact news events
- Backtest across different volatility regimes
4. **Execution Risk**:
- Strategy calculates on every tick (calc_on_every_tick = true)
- May generate frequent orders in volatile conditions
- Ensure adequate execution infrastructure and consider transaction costs
5. **Parameter Sensitivity**:
- Performance highly dependent on parameter optimization
- Over-optimization may lead to curve-fitting
- Regular parameter review and adjustment may be necessary
## Suitable Scenarios
### Ideal Market Conditions
- **Sideways/Range-bound markets**: Primary use case
- **Mean-reverting instruments**: Forex pairs, some commodities
- **Stable volatility environments**: Consistent ATR patterns
- **Liquid markets**: Major currency pairs, popular stocks/indices
## Important Notes
### Strategy Limitations
1. **No Stop Loss**: Strategy relies on mean reversion without traditional stop losses
2. **Capital Requirements**: Requires sufficient capital for grid-based position sizing
3. **Market Regime Dependency**: Performance varies significantly across different market conditions
## Disclaimer
This strategy is provided for educational and research purposes only. Past performance does not guarantee future results. Trading involves substantial risk of loss and is not suitable for all investors. Users should thoroughly test the strategy and understand its mechanics before risking real capital. The author assumes no responsibility for trading losses incurred through the use of this strategy.
---
# KC网格策略 - 基于肯特纳通道的网格交易系统
## 策略概述
KC网格策略是一个创新的网格交易系统,它将肯特纳通道的力量与动态仓位调整相结合,创建了一个均值回归交易方法。该策略根据价格偏离肯特纳通道中心线的程度自动调整仓位大小,实施系统化的网格方法,利用市场波动和价格振荡获利。
## 核心原理
### 肯特纳通道基础
该策略建立在肯特纳通道指标之上,包含:
- **中心线**: 价格的移动平均线(EMA或SMA)
- **上轨**: 中心线 + (ATR/TR/Range × 乘数)
- **下轨**: 中心线 - (ATR/TR/Range × 乘数)
### 网格交易逻辑
该策略实施复杂的网格系统:
1. **仓位方向**: 与价格在通道中的位置呈反向关系
- 当价格高于中心线时 → 空头仓位
- 当价格低于中心线时 → 多头仓位
2. **仓位大小**: 与距离中心线的距离成正比
- 偏离越大 = 仓位越大
3. **网格激活**: 只有当差异超过预定义的网格阈值时才调整仓位
### 数学基础
核心计算使用KC比率公式:
```
kcRate = (close - ma) / bandWidth
targetPosition = kcRate × maxAmount × (-1)
```
这创建了一个均值回归系统,当价格偏离均值越远时仓位越大,期望最终回归均衡。
## 参数说明
### 时间范围设置
- **开始日期**: 策略执行期间的开始时间
- **结束日期**: 策略执行期间的结束时间
### 核心参数
1. **网格数量 (NumGrid)**: 默认12
- 控制网格敏感度和仓位调整频率
- 较高值 = 更频繁但较小的调整
- 较低值 = 较少频繁但较大的调整
2. **长度**: 默认10
- 移动平均线和波动率计算的周期
- 较短周期 = 对近期价格行为更敏感
- 较长周期 = 更平滑,噪音更少的信号
3. **网格系数 (kcRateMult)**: 默认1.33
- 通道宽度计算的乘数
- 较高值 = 更宽的通道,较少频繁的交易
- 较低值 = 更窄的通道,更频繁的交易
4. **数据源**: 默认收盘价
- 计算的价格来源(收盘价、开盘价、最高价、最低价等)
- 收盘价通常提供最可靠的信号
5. **使用指数移动平均**: 默认True
- True = 使用EMA(对近期价格更敏感)
- False = 使用SMA(对所有周期等权重)
6. **通道样式**: 默认"平均真实范围"
- **平均真实范围**: 平滑的波动率测量(推荐)
- **真实范围**: 仅当前K线的波动率
- **范围**: 简单的高低价差
## 使用方法
### 设置说明
1. **应用到图表**: 将策略添加到您所需的时间框架和交易品种
2. **配置参数**: 根据市场特征调整设置:
- 波动市场:增加网格系数,减少网格数量
- 稳定市场:减少网格系数,增加网格数量
3. **设置时间范围**: 定义您的回测或实盘交易期间
4. **监控表现**: 观察策略表现指标并根据需要调整
### 最佳市场条件
- **区间震荡市场**: 策略在横盘趋势市场中表现最佳
- **高波动性**: 受益于围绕均值的频繁价格振荡
- **流动性强的品种**: 确保高效的订单执行和最小滑点
### 仓位管理
策略自动:
- 根据账户权益计算最优仓位大小
- 随着价格在网格水平移动逐步调整仓位
- 通过最大仓位限制维持风险控制
- 仅在指定时间段内执行交易
## 风险警示
### ⚠️ 重要风险考虑
1. **趋势市场风险**:
- 策略在强趋势市场中可能表现不佳或产生损失
- 在持续方向性移动期间均值回归假设可能失效
- 部署前考虑市场制度分析
2. **杠杆和仓位大小风险**:
- 策略使用金字塔加仓(最多20个仓位)
- 在延长移动期间可能积累大仓位
- 密切监控账户权益和保证金要求
3. **波动性风险**:
- 突然的波动性激增可能触发多次快速仓位调整
- 在高影响新闻事件期间考虑波动性过滤器
- 在不同波动性制度下进行回测
4. **执行风险**:
- 策略在每个tick上计算(calc_on_every_tick = true)
- 在波动条件下可能产生频繁订单
- 确保充足的执行基础设施并考虑交易成本
5. **参数敏感性**:
- 表现高度依赖于参数优化
- 过度优化可能导致曲线拟合
- 可能需要定期参数审查和调整
## 适用场景
### 理想市场条件
- **横盘/区间震荡市场**: 主要用例
- **均值回归品种**: 外汇对,某些商品
- **稳定波动性环境**: 一致的ATR模式
- **流动性市场**: 主要货币对,热门股票/指数
## 注意事项
### 策略限制
1. **无止损**: 策略依赖均值回归而无传统止损
2. **资金要求**: 需要充足资金进行基于网格的仓位调整
3. **市场制度依赖性**: 在不同市场条件下表现差异显著
## 免责声明
该策略仅供教育和研究目的。过往表现不保证未来结果。交易涉及重大损失风险,并非适合所有投资者。用户应在投入真实资金前彻底测试策略并理解其机制。作者对使用此策略产生的交易损失不承担任何责任。
---
**Strategy Version**: Pine Script v6
**Author**: Signal2Trade
**Last Updated**: 2025-8-9
**License**: Open Source (Mozilla Public License 2.0)

Keltner + RSI Bitcoin Futures Trading [luca_badoer]This indicator combines the power of the Keltner channel with the power of the Relative Strength Indicator (RSI). It can help understand when the market is entering a bullish or a bearish trend.
Normally a Keltner channel would reference an Exponential Moving Average (EMA) of the price. In this case the Keltner Channel in the "Keltner + RSI Bitcoin Futures Trading " references the EMA of the 14-day RSI (white line). On top of that it overlays a 7-day RSI line (blue line). This produces some signals that are particularly useful in 2h, 4h and 1 day charts. The signals consist in the 7-day RSI line (blue line) crossing the upper (green) or lower (red) Keltner channels as well as the middle (white) line. Depending on the direction of the crossing (up or down) and the RSI level (from 0 to 100) at which the crossing takes place this produces bullish or bearish signals.
Examples:
- Bullish crossing: 7-day RSI (blue) crosses both the lower (red) and middle (white) lines upwards at a low to neutral RSI level (<70%)
- Bearish crossing: 7-day RSI (blue) cross both the upper (green) and middle (white) lines downwards at a high to neutral RSI (>30%)
Recommendations:
- Better to use it in 2h, 4h, and 1-day charts, thought it can also be used in lower timeframes. Confirmations of crossings in higher time-frames provide more certainty about the direction of the move.
- Use in combination with Heikin Ashi candles and volume indicators.

Keltner Channel Volatility FilterOVERVIEW
The Keltner Channel Volatility Filter indicator is a technical indicator that gauges the amount of volatility currently present in the market. The purpose of this indicator is to filter out with-trend signals during ranging/non-trending/consolidating conditions.
CONCEPTS
This indicator assists traders in capitalizing on the assumption that trends are more likely to start during periods of high volatility compared to periods of low volatility . This is because high volatility indicates that there are bigger players currently in the market, which is necessary to begin a sustained trending move.
So, to determine whether the current volatility in the market is low, the KCVF will grey out all bars whose average price is within the Keltner Channels.
If the average price breaks out of the Keltner Channels , it is reasonable to assume we are in a high-volatility period. Thus, this is the ideal time to enter a trending trade due to the assumption that trends are more likely to start during these high-volatility periods.
HOW DO I READ THIS INDICATOR
When the candles are greyed out, don't take any trend trades since the current volatility is less than the usual volatility experienced in the market.
When the candles aren't greyed out, take all valid with-trend trades since the current volatility is greater than the usual volatility experienced in the market.

Keltner+Bollinger Squeeze [kingthies_]Keltner-Bollinger-Combo Squeeze
As you likely know, the bollinger squeeze comes from the bband indicator, a classic indicator in all forms of technical analysis, effectively measuring volatility of a given assets price movement.
There are different forms of the squeeze here on tradingview, and I've combined the Bollinger band indicator in my own strategy, to the alternative and similar appearing Keltner channels. The two work incredibly well together and I've used them in my analysis for years now as my core approach to understanding the technical side of the markets.
This tool will show users the result that i typically look for when assessing for potential volatile moves in the near future for an asset, and will highlight the chart + send an alert when the chart is something to look at and the indicator suggests incoming volatility may be in the near future.
The users will still need to assess themselves whether the squeeze they see is a bullish or bearish leaning, but the overall idea is to set it and forget it with the alert clause thats added in.
Personally i enjoy this with Heikin ashi inputs but use whichever preference you have, and all timeframes + tickers should apply here.
Cheers

Keltner Channel %KIndicator display where price is in relation to the bands of Keltner Channel (20,2)
A. Keltner Channe Info
1. Basis = EMA(close,20)
2. Upper Band = Basis + 2 x ATR(14)
3. Lower Band = Basis - 2 x ATR(14)
B. %K Info
1. %K Above 1 = Price is Above the Upper Band
2. %K Below 0 = Price is Below the Lower Band
3. %K Above 0.8 = Price is Nearing the Upper Band
4. %K Below 0.2 = Price is Nearing the Lower Band

Keltner Alım Stratejisi v6 (10, 0.5)sadece keltner kanal girdilerinin değiştirilmesiyle oluşturulmuş bir göstergedir
