EMA 50, 100 and 200Draw a set of 3 EMA: 50, 100 and 200. It highlight with a circle the crossing of EMA(50) with other EMAsอินดิเคเตอร์ Pine Script®โดย SmartChain_Investments22 1.5 K
IV/HV ratio 1.0 [dime]This script compares the implied volatility to the historic volatility as a ratio. The plot indicates how high the current implied volatility for the next 30 days is relative to the actual volatility realized over the set period. This is most useful for options traders as it may show when the premiums paid on options are over valued relative to the historic risk. The default is set to one year (252 bars) however any number of bars can be set for the lookback period for HV. The default is set to VIX for the IV on SPX or SPY but other CBOE implied volatility indexes may be used. For /CL you have OVX/HV and for /GC you have GVX/HV. Note that the CBOE data for these indexes may be delayed and updated EOD and may not be suitable for intraday information. (Future versions of this script may be developed to provide a realtime intraday study. ) There is a list of many volatility indexes from CBOE listed at: www.cboe.com (Some may not yet be available on Tradingview) RVX Russell 2000 VXN NASDAQ VXO S&P 100 VXD DJIA GVX Gold OVX OIL VIX3M 3-Month VIX6M S&P 500 6-Month VIX1Y 1-Year VXEFA Cboe EFA ETF VXEEM Cboe Emerging Markets ETF VXFXI Cboe China ETF VXEWZ Cboe Brazil ETF VXSLV Cboe Silver ETF VXGDX Cboe Gold Miners ETF VXXLE Cboe Energy Sector ETF EUVIX FX Euro JYVIX FX Yen BPVIX FX British Pound EVZ Cboe EuroCurrency ETF Volatility Index Amazon VXAZN Apple VXAPL Goldman Sachs VXGS Google VXGOG IBM VXIBM อินดิเคเตอร์ Pine Script®โดย dime22498
Moving Average Cross Strategy Simply define your fast and slow M then backtest the strategy. *First script, work in progress. Will allow you to combine two TV indicators into one.กลยุทธ์ Pine Script®โดย Charts_and_Such_1ที่อัปเดต: 44556
MA Cross 50/200 - Moving Averageindicates short-term 50-day moving average AND long-term 200-day moving average CROSS @GateTickerอินดิเคเตอร์ Pine Script®โดย Valconที่อัปเดต: 126
Multi-Timeframe Probability Zones [DW]This is an experimental study based on multi-timeframe price action and a simple average. Use it to quickly identify MTF support and resistance, and high probability price levels. NOTE: Because higher timeframe levels are not certain until the interval is closed, refresh your chart as new levels are drawn. อินดิเคเตอร์ Pine Script®โดย DonovanWall33278
Line Break StrategyLine Break Strategy Entry rule: Long on a bullish line and short on a bearish line. Backtest: Profit factors are shown below for three-line break. Daily time frame, FXCM broker. EURUSD: 1.267, USDJPY: 1.039, GBPUSD: -0.816, AUDUSD: -0.959 S&P500: -0.783, Nikkei225: 1.099 CrudeOil: 1.03, Gold: 1.196 BTCUSD: -0.883 Reference: Steve Nison, Beyond Candlesticks - New Japanese Charting Techniques Revealed Note: This strategy doesn't work properly on the linebreak chart. A good example is shown below. The entry prices are not always correct. If you have signal, but the next candle moves in the opposite direction, the entry price is drawn at the Open of the new candle instead of the Close of the previous candle. The results of backtest are unreliable due to this reason. กลยุทธ์ Pine Script®โดย Mizuki3288501
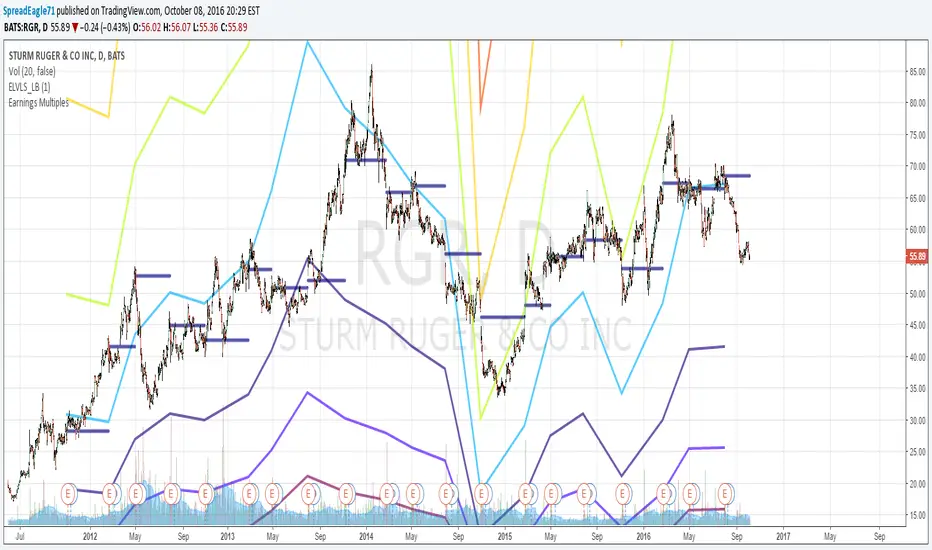
Earnings MultiplesMultiplies Quarterly Earnings x 13, x 21, x 34, x 55, x 89, x 144, x 233. Yes its a fibonacci sequence. "Goldilocks zone" seems to be in the 55x - 89x area. Also when companies become profitable, the indicator looks like a "starburst". อินดิเคเตอร์ Pine Script®โดย SpreadEagle712280
EMA & SMA with FRACTAL DEVIATION BANDS by @XeL_ArjonaEMA & SMA with FRACTAL DEVIATION BANDS Ver. 1.0.25.08.2015 By Ricardo M Arjona @XeL_Arjona DISCLAIMER: DISCLAIMER: The Following indicator/code IS NOT intended to be a formal investment advice or recommendation by the author, nor should be construed as such. Users will be fully responsible by their use regarding their own trading vehicles/assets. The embedded code and ideas within this work are FREELY AND PUBLICLY available on the Web for NON LUCRATIVE ACTIVITIES and must remain as is. WHAT IS THIS? This is the adaptation of the FRACTAL DEVIATION BANDS to be used on Traditional Moving Averages (Simple & Exponential). ALL NEW IDEAS OR MODIFICATIONS to these indicator(s) are Welcome in favor to deploy a better and more accurate readings. I will be very glad to be notified at Twitter or TradingVew accounts at: @XeL_Arjona Any important addition to this work MUST REMAIN PUBLIC by means of CreativeCommons CC & TradingView. 2015อินดิเคเตอร์ Pine Script®โดย xel_arjona11898
H4 Color Change Bias (Correct Final)Trading is the active buying and selling of financial instruments—such as stocks, currencies, commodities, and derivatives—to generate short-term profits from price fluctuations. Unlike long-term investing, traders capitalize on both rising (bullish) and falling (bearish) markets using technical analysis, market research, and risk management strategies. Key aspects of trading include: Financial Instruments: Traders deal in various markets, including stock markets (shares), foreign exchange (Forex), commodities (gold, oil), and cryptocurrencies. Goal: The primary objective is to buy at a lower price and sell at a higher price, or vice versa (short selling) to make a profit. Timeframe: Trading is typically fast-paced, with positions held for minutes, hours, days, or weeks, as opposed to years.อินดิเคเตอร์ Pine Script®โดย michalnam1610
NY 3Min Range Break 09H303 Min Range breakout NY Open High and Low range of Gold at 09H27-09H30. Break out to either side with full body candle closure. Enter with 1:1 RR Stop Loss on opposite side of the range.อินดิเคเตอร์ Pine Script®โดย aubreyoxugnที่อัปเดต: 4
Top score Scalping 3-Signal Dashboard v2If you are using this indicator in an international environment or want to understand the English terminology used in professional trading, here is a guide on how to use and interpret the **Scalping 3-Signal Dashboard v2**. --- ## 1. Understanding the Dashboard Logic The dashboard works on a **Confluence Model**. Instead of following one indicator blindly, it looks for "agreement" between three different types of analysis: * **Trend Analysis (EMA):** Shows the direction of the market. * **Momentum Analysis (RSI):** Shows the strength of the move. * **Volume Analysis (VFI):** Shows if "Big Money" is supporting the move. ### 📊 Score Interpretation The **Verdict** row is your final decision maker: * **"BUY ZONE" (Score 60% - 100%):** High probability bullish setup. All or most signals are aligned. * **"SELL ZONE" (Score 60% - 100%):** High probability bearish setup. * **"WAIT":** The market is in a **Conflict State**. (e.g., Price is going up, but volume is decreasing). **Do not trade.** --- ## 2. Trading Terms & Actions When using this tool, you will encounter these English terms in the settings and alerts: | English Term | Definition / Action | | --- | --- | | **Bullish** | Market is going up (Look for Buy). | | **Bearish** | Market is going down (Look for Sell). | | **Crossover** | When the Fast EMA crosses the Slow EMA (Trend change). | | **Neutral** | RSI is near 50; no clear strength in either direction. | | **Probability (Prob)** | The calculated confidence level of the signal. | | **Trigger** | The exact moment the "BUY" or "SELL" label appears. | --- ## 3. How to Execute a Trade (Step-by-Step) ### **Step 1: Check the Verdict** Wait for the **"BUY ZONE"** or **"SELL ZONE"** to appear on the dashboard. Do not enter if the dashboard says **"WAIT"**. ### **Step 2: Verify the Signal (The Arrow)** Look for the **Green Label (BUY)** below the candle or the **Red Label (SELL)** above the candle. * *Tip:* The best signals happen when the labels appear just as the EMAs cross each other. ### **Step 3: Set Your Exit (Risk Management)** Since this script doesn't provide exit targets, use these standard English trading rules: * **Stop Loss (SL):** Place it below the recent "Swing Low" (for Buys) or above the "Swing High" (for Sells). * **Take Profit (TP):** Aim for a **Risk/Reward ratio of 1:1.5 or 1:2**. --- ## 4. Optimization Settings (Inputs) If you want to change the settings, here is what the English labels mean: * **EMA Fast/Slow Length:** Adjusts how sensitive the trend lines are. * **Min Probability:** The threshold for showing arrows. If you want fewer, more accurate signals, increase this to **70%**. * **Weight Settings:** How much "importance" you give to each indicator. If you trust Volume more than RSI, increase the **VFI Weight**. --- ### 💡 Pro Tip for XAUUSD (Gold) Gold is highly volatile. In English, we call this **"Market Noise."** To avoid being "stopped out" by noise, it is best to use this indicator during high-volume sessions: 1. **London Session** (starts ~8:00 AM GMT) 2. **New York Session** (starts ~1:00 PM GMT) **Would you like me to translate the labels inside the script's code into English so the dashboard itself displays English text?**อินดิเคเตอร์ Pine Script®โดย thanachaiyo2723
ICT HARDIKThis strategy script identifies liquidity sweeps, MSS, and FVGs strictly within the 10-11 AM EST Killzone. It automates entries, places SL beyond swept levels, and targets 1:2 R:R for high-probability trades matching gold's volatility.กลยุทธ์ Pine Script®โดย mandanihardik1232
Stoch RSI + RSI Auto Buy Bot (XAUUSD 20 USD SL + Break-Even) WS Strategy Name Stochastic RSI + RSI Auto Buy Bot (XAUUSD) with $20 Stop Loss & Break-Even Market Instrument: XAUUSD (Gold) Direction: Buy-only (long bias) Typical Timeframes: M5 – M15 (can be adapted to M30) Gold tends to respect momentum reversals and overbought/oversold conditions well on lower timeframes, which is why RSI-based confirmation works nicely here. Indicators Used RSI (Relative Strength Index) Period: Commonly 14 Used to identify oversold conditions and momentum shift Stochastic RSI Used for precise entry timing Confirms RSI signals and avoids early entries Entry Conditions (BUY) All conditions must align: RSI Condition RSI is below 30 (oversold zone) RSI starts turning upward or crosses above a confirmation level (e.g. 30–35) Stochastic RSI Condition Stoch RSI is in oversold zone (below 20) %K crosses above %D (bullish crossover) Market Context (Filter) Prefer price near support, previous low, or after a pullback Avoid buying during high-impact news spikes Once these conditions align, the bot executes a market buy. Risk Management This is the backbone of the strategy. Stop Loss Fixed $20 Stop Loss Designed to survive normal XAUUSD volatility while protecting capital Break-Even Rule When price moves X pips / dollars into profit (example: +$15 or +1R): Stop Loss is automatically moved to entry price Trade becomes risk-free This prevents winning trades from turning into losers and allows the bot to let profits run psychologically and mechanically. Take Profit Logic One of the following (depending on bot setup): Dynamic TP Exit when RSI reaches overbought (65–70) Or when Stoch RSI exits overbought Partial Close (Optional) Close part of the position at 1R Let the rest run with break-even or trailing stop Why This Strategy Works RSI identifies exhausted sellers Stoch RSI provides precise timing Fixed SL keeps losses controlled Break-even protects capital Gold’s volatility amplifies clean momentum reversals This combo filters weak entries and focuses only on high-probability bounce trades.กลยุทธ์ Pine Script®โดย dove81412
XAU_Scalper_Conservative (EMA 9/21/200 + VWAP + BOS + HTF)XAU_Scalper_Conservative — One‑Page Cheat Sheet 1) What you see on the chart EMA 9 (teal): fast momentum line. EMA 21 (orange): main pullback line (must be touched for entries by default). EMA 200 (purple): trend filter; trade with its side and away from it. VWAP (blue): intraday “fair value”; longs above / shorts below (if enabled). Background tint: greenish in bull bias, reddish in bear bias (based on MA stack). Signals on chart: “L‑PB CONS / S‑PB CONS” — conservative long/short pullback signal. “BOS UP / BOS DN” — Break of Structure (new HH/LL confirms trend continuation). 2) What is enabled by default (Conservative filters) Structure/BOS mode: Only trade with the most recent BOS (up for longs, down for shorts) and only for a limited number of bars after it (default 40). HTF filter (15m): Longs when HTF EMA50 > EMA200 and price above HTF EMA50; shorts vice versa. EMA21 touch required: Pullback must reach EMA21 (no shallow touches at EMA9 only). Candle confirmation: Default = prevHighBreak/prevLowBreak (close breaks prior bar’s high/low). EMA21 slope filter: Trend must tilt (not flat). Distance from EMA200: Price must be at least 0.06% away (avoid “fights” at 200). VWAP filter: Longs above, shorts below VWAP. Volume filter: Volume above MA × 1.4 (avoids weak breaks). Session filter: Signals only during London 08:00–11:00 and NY 14:30–17:00 (your local time). You can relax/tighten any of these from the indicator settings panel. 3) Where to look for entries (step‑by‑step) Long (mirror for Short): Context: Price above EMA200, EMA9 > EMA21. Last BOS UP is active (no newer BOS DN, and within BOS lookback). HTF filter says bullish (15m EMA50 > EMA200, close > EMA50). Wait for pullback: Price pulls back to touch EMA21. EMA21 is sloping up (slope filter passes). VWAP OK (price above, if filter ON). Volume OK (above threshold). Trigger (confirmation): The entry candle closes above prior bar’s high (default), or choose Engulf/Pinbar mode in settings. Signal: You’ll see “L‑PB CONS” under the bar (or “S‑PB CONS” above for shorts). 4) How to place SL/TP (simple, mechanical) Stop‑loss (SL): Conservative: a few ticks beyond the last swing pivot created by the pullback. Alternative: just beyond EMA21 if pivots are too tight on 2m. Take‑profit (TP): Fixed 1.2R–1.5R for scalps or the prior swing high/low. Scale out partial at 1R, trail rest with EMA9 (fast) or last pivot (safer). Tip: On gold, spreads and spikes can be tricky — give SL a little air beyond the pivot. 5) When to skip signals EMA21 slope ~ flat or ADX low (you’ll often see few/no signals — that’s good). Too close to EMA200 (filter blocks it by default). VWAP magnet days (price whips around VWAP). Just after big news — wait for impulse → pullback → confirmation. 6) Default settings that work well on XAUUSD (2m/5m) BOS lookback: 30–50 bars. EMA21 slope: length 6, min 0.03–0.05%. Min distance from EMA200: 0.06–0.12%. Volume factor: 1.3–1.6 (raise during quiet London, lower during NY impulse). HTF: 15m (EMA50/EMA200). 7) Alerts (recommended) CONSERVATIVE LONG Pullback 9/21 (BOS/HTF/Volume/ADX) CONSERVATIVE SHORT Pullback 9/21 (BOS/HTF/Volume/ADX) Set Once per bar close for cleaner signals. Use app/email/webhook as you prefer. 8) Quick troubleshooting No signals? Loosen one thing at a time: first distance from EMA200, then volume factor, then slope/ADX. Keep BOS + HTF intact — they protect you. Too many signals? Tighten slopeMinPct (e.g., 0.05%) or raise minAdx to 18, or enforce EMA21 touch (keep ON). 9) Workflow you can trust Top‑down glance (HTF bias). BOS active? Yes → proceed. Wait for EMA21 touch → confirmation candle → alert. Place SL beyond pivot/EMA21, TP 1.2–1.5R or swing target. Manage: partial at 1R, trail via EMA9 or pivots.อินดิเคเตอร์ Pine Script®โดย lucinka_krchlikova6
KSCP Dist25 For SHIN このインジケータは、「ボラティリティ調整済みの移動平均乖離率」を用いた、トレンドフォロー型の押し目買い(Dip Buying)および過熱感判定ツールです。 単純な価格乖離率(%)ではなく、ATR(Average True Range)で正規化している点が最大の特徴であり、あなたのTier 3(CFD)のようにボラティリティが異なる複数のアセット(日経、Gold、FX)を、統一された「歪み(Dist)」の基準で管理するために設計されています。 以下、主要なロジックと実戦での解釈を解説します。 1. コアロジック:Dist25(ボラティリティ調整済み乖離)価格が中期トレンド(SMA25)から「ATR何個分」離れているかを数値化しています。 目的: 銘柄固有のボラティリティを除外し、純粋な「トレンドからの逸脱度」を測る。 優位性: 変化率の激しいGoldも、比較的穏やかなドル円も、同じ「0.6」や「1.0」という閾値で判定可能になります。 2. レジーム判定(トレンドフィルター)マルチタイムフレーム(MTF)機能により、チャートの時間軸に関わらず、指定した上位足(デフォルトは日足「D」)の環境認識を行います。 Perfect Order (PO): SMA5 > SMA25 > SMA75 の成立有無。Range (レンジ): SMA25とSMA75の乖離率が指定値(rangeBand)以下の収縮状態。 Risk-On (上昇トレンド): レンジ外かつ、SMA25 > SMA75、かつSMA25の傾き(Slope)が正。 Risk-Off (下落トレンド): レンジ外かつ、SMA25 < SMA75、かつSMA25の傾きが負。 3. アクションゾーン(シグナル)算出された Dist25 の値に基づき、現在のプライスアクションを4つのゾーンに分類します。 ゾーンDist25 閾値判定推奨アクション BUY ZONE0.0 ~ 0.6健全な押し目**ロング・エントリー検討領域。 **トレンド継続中の調整局面(Pullback) CHASE NO> 1.0過熱(買われすぎ)**追撃禁止。 **利食い、またはヘッジ(売り)検討。新規ロングは期待値が低い。 KNIFE< -0.3落ちるナイフ**静観。 **SMA25を明確に割り込んでおり、トレンド転換または深い調整のリスク。NEUTRALその他中立明確なシグナルなし。 This indicator is a trend-following tool designed for Dip Buying and gauging Overheating, utilizing a "Volatility-Adjusted Moving Average Deviation." Its key feature is normalizing deviation using ATR (Average True Range) rather than simple percentage (%) terms. It is designed to manage multiple assets with varying volatilities—such as the Nikkei, Gold, and FX in your Tier 3 (CFD) portfolio—under a unified standard of "Distortion (Dist)." Below is an explanation of the core logic and practical interpretation: 1. Core Logic: Dist25 (Volatility-Adjusted Deviation) It quantifies how many "ATRs" the price has deviated from the medium-term trend (SMA25). Objective: To exclude asset-specific volatility and measure the pure "degree of deviation from the trend." Advantage: Highly volatile assets like Gold and relatively stable pairs like USD/JPY can both be judged using the same thresholds (e.g., "0.6" or "1.0"). 2. Regime Detection (Trend Filter) Using Multi-Timeframe (MTF) functionality, it analyzes the market environment on a specified higher timeframe (default: Daily "D"), regardless of the chart's current timeframe. Perfect Order (PO): Checks if SMA5 > SMA25 > SMA75. Range: A contraction state where the deviation between SMA25 and SMA75 is below a specified value (rangeBand). Risk-On (Uptrend): Outside of Range AND SMA25 > SMA75 AND SMA25 Slope is positive. Risk-Off (Downtrend): Outside of Range AND SMA25 < SMA75 AND SMA25 Slope is negative.อินดิเคเตอร์ Pine Script®โดย kensakai12141
XAUUSD 1-Minute Scalping Strategy - Advanced Strategy for ExitsThis is a **mean-reversion scalping strategy** optimized for **XAUUSD on the 1-minute (or the 5-minute) timeframe**. It combines a classic **RSI(14)** oscillator with an optional **200-period EMA trend filter** to identify short-term overextended conditions in gold price action, while enforcing fixed, conservative exits to maintain strict risk control. ### Core Logic & Why This Combination: The strategy enters counter-trend when RSI reaches extreme levels (below 30 for longs, above 70 for shorts), capturing quick snap-backs that frequently occur in gold's intraday volatility. - **RSI(14)** acts as the primary momentum filter — detecting oversold/overbought exhaustion. - The **200 EMA trend filter** (enabled by default) adds directional context: longs are allowed only when price is above the EMA (overall uptrend bias), shorts only below it (downtrend bias). This reduces whipsaws in strong trending sessions and improves trade quality without overly restricting opportunities. - Disabling the trend filter allows pure mean-reversion trading (useful in ranging/Asian sessions), but enabling it is strongly recommended for better expectancy in most market conditions. Entries occur only when flat (no pyramiding), keeping the system clean and directional. ### Exit Rules (Fixed at Entry): - **Take Profit**: +10 pips (0.10 in XAUUSD price terms) - **Stop Loss**: -5 pips (0.05 in price terms) - **Risk:Reward** = 1:2 Exits are **set once on the entry bar** using limit/stop orders — this prevents dynamic recalculation and mimics real broker behavior more closely. The 2:1 RR gives the strategy mathematical edge even with moderate win rates. ### Performance & Realism Guidelines: This strategy is tuned for **high-frequency scalping** on gold, which typically produces hundreds to thousands of trades per year on 1-minute data. Recommended **backtest/publication settings** (update these in the strategy properties before publishing): - **Initial Capital**: $10,000 – $50,000 (realistic for retail prop/swing traders; the script defaults to $1,000,000 only for visual scaling — change it!) - **Order Size**: Fixed 0.10–0.50 lots (adjust according to account size) - **Commission**: 3–7 USD per round-turn lot (typical ECN/raw-spread gold commission on brokers like IC Markets, Pepperstone, etc.) - **Slippage**: 2–5 ticks (≈0.02–0.05 in price) — gold can be slippery during news/volatility spikes on 1-minute charts - **Pyramiding**: 1 (default — no stacking) - **Dataset**: At minimum 1–3 years of 1-minute data (aim for >500–1000 closed trades for statistical significance) With realistic costs applied, expect win rate ≈55–70%, profit factor >1.4–1.8 in favorable periods, but results vary significantly across trending vs. ranging regimes and news events. **Risk per trade** remains very controlled (typically <0.5–1.5% depending on SL distance and position sizing) — never exceeds sustainable levels. ### Important Usage Notes: - Check thoroughly the curve-fitted back tests. - Gold is extremely volatile on 1-minute charts; check major news (NFP, FOMC, FED) unless you widen SL/TP dynamically (you can manually implement it here). - Always forward-test on demo first and use proper position sizing. - The built-in dashboard shows live stats (net P&L, win rate, profit factor, current RSI, position status, etc.) for quick monitoring. - Restricted Sample Size for Precision Happy scalping — trade responsibly! 🚀กลยุทธ์ Pine Script®โดย uzair2join20
DafeVIXEngineDAFE VIX Intelligence Engine: The Definitive Guide to Market Volatility This is a professional-grade intelligence engine that decodes the multi-dimensional language of market fear. It analyzes the VIX Term Structure, Volatility Surprise, and Regime Physics to provide a probabilistic forecast of market stability and transitions. █ CHAPTER 1: THE PHILOSOPHY - BEYOND THE VIX NUMBER For most traders, the VIX is a single number—a simple "fear gauge." This is a dangerously incomplete view. The VIX is not a single data point; it is the observable surface of a deep, complex, multi-dimensional field of information. Its true power lies not in its absolute level, but in its relationship to itself across time (its slope), its relationship to its future expectations (its term structure), and its relationship to the market's actual, realized volatility (the volatility risk premium). The DAFE VIX Intelligence Engine was created to provide a complete, institutional-grade view of this hidden information field. This script is not a simple "mashup" of existing indicators; it is a foundational, original work that introduces a suite of proprietary algorithms and concepts to the TradingView platform. It deconstructs the entire VIX complex and analyzes it through the lens of quantitative finance and statistical modeling. Its purpose is not to give you simple buy or sell signals. Its purpose is to provide you with a master "weather report" for the market. It answers the most critical questions a professional trader must ask before putting on any position: What is the current volatility regime? Is the market stable or fragile? And what is the probability that the entire environment is about to change? This is a tool for quantifying the unseen risks and opportunities in the market. █ CHAPTER 2: THE CORE INNOVATIONS - ORIGINALITY & USEFULNESS This engine's value is rooted in its synthesis of concepts from professional derivatives analysis, applied to the VIX in a novel and accessible way. Every component is designed to extract a unique and powerful layer of intelligence. Multi-Source Data Ingestion & Validation: The engine doesn't just rely on the standard VIX. It intelligently pulls data from the entire VIX family, including the VIX9D (9-day VIX) and VX1! (the front-month VIX future). Crucially, it includes a sophisticated Stale Data Detection system. If it detects that the CBOE data is not updating (a common issue), it seamlessly falls back to a high-fidelity Realized Volatility model (blending Parkinson and Yang-Zhang estimators), ensuring you always have a reliable reading. Term Structure Analysis: This is the heart of the engine and a concept rarely seen outside of institutional platforms. It analyzes the slope of the VIX futures curve (VX1! - VIX) to determine if the market is in Contango (normal, calm) or Backwardation (stressed, fearful). An inverted term structure is one of the most reliable leading indicators of market stress. Volatility Surprise (VRP) Engine: The engine quantifies the Volatility Risk Premium by comparing implied volatility (the VIX) to the actual, historical realized volatility of the underlying asset. This allows it to detect when "fear is overpriced" (VIX is much higher than reality, a potential bullish signal for equities) or "fear is underpriced" (VIX is lower than reality, signaling dangerous complacency). Probabilistic Regime Transition Model: This is the engine's predictive powerhouse. It doesn't just tell you the current regime; it calculates the probability of a transition. It does this by analyzing the "acceleration" of key volatility metrics—the rate of change of the term structure slope, the rate of change of realized volatility, and the "mean-reversion pressure" building up in the system. A high transition probability is a powerful early warning that the entire market character is about to shift. Intelligent Instrument Profiling: The engine includes a smart detection system that identifies the asset you are trading (e.g., NQ, ES, BTC, Gold) and automatically applies a pre-calibrated "Sensitivity Profile." It understands that a VIX of 25 has a different implication for Nasdaq than it does for Bitcoin, and it adjusts its risk calculations accordingly. █ CHAPTER 3: THE ANALYTICAL PIPELINE - HOW THE ENGINE THINKS The VIX Intelligence Engine operates on a clear, five-stage pipeline to transform raw data into high-level intelligence. STAGE 1: DATA INGESTION & VALIDATION: The engine pulls data from VIX, VIX9D, and VX1!. It simultaneously calculates the realized volatility of the primary asset. It runs a continuous check for stale data. If the VIX data is found to be stale, it transparently switches to a fallback model, blending the last known VIX value with the live realized volatility reading. STAGE 2: MULTI-DIMENSIONAL ANALYSIS: The validated volatility data is analyzed across four key dimensions: Level: The raw VIX value is converted to a Z-Score to measure its statistical rarity. Slope: The rate of change of the VIX is calculated to measure its momentum. Term Structure: The VX1! - VIX spread and the VIX9D - VIX spread are calculated to determine the shape of the futures curve. Surprise: The VIX - Realized Volatility spread is calculated to quantify the Volatility Risk Premium. STAGE 3: REGIME CLASSIFICATION: A weighted scoring model synthesizes all the metrics from Stage 2 to classify the market into one of seven distinct volatility regimes: Compression, Low Vol, Normal, Elevated, Expansion, Panic, or Euphoria. Each regime is assigned a color and a confidence score. STAGE 4: TRANSITION PROBABILITY: This is the predictive layer. The engine analyzes the second derivative (acceleration) of its core metrics. A sharp acceleration in the term structure slope, combined with a build-up of mean-reversion pressure, will result in a high "Transition Probability" score, warning you that the current regime is becoming unstable. STAGE 5: FINAL OUTPUT & VISUALIZATION: All of this intelligence is rendered into the intuitive lower pane display, the on-chart detection dots, and the comprehensive dashboard. █ CHAPTER 4: A GUIDE FOR DEVELOPERS - INTEGRATING THE ENGINE This script is published as a standalone indicator, but its core logic is designed to be extracted and used as a library. This guide provides the complete input template and a conceptual workflow for integrating this VIX intelligence into your own systems. PART I: THE INPUTS TEMPLATE (THE CONTROL PANEL) To give your users full control over the VIX engine, you can replicate these inputs in your own script. // ╔═════════════════════════════════════════════════════╗ // ║ INPUTS TEMPLATE (COPY INTO YOUR SCRIPT) ║ // ╚═════════════════════════════════════════════════════╝ // INPUT GROUPS string GRP_ENGINE = "══════════ 🌡️ VIX ENGINE ══════════" string GRP_DISPLAY = "══════════ 📊 DISPLAY LAYERS ══════════" string GRP_DETECT = "══════════ 🔍 DETECTION OVERLAYS ══════════" string GRP_VIZ = "══════════ 🎨 VISUALIZATION ══════════" string GRP_DASH = "══════════ 📋 DASHBOARD ══════════" // VIX ENGINE int i_zLookback = input.int(50, "Z-Score Lookback", minval=20, maxval=200, group=GRP_ENGINE, tooltip="Normalization period for all Z-score calculations.\n• 30-40: Adaptive\n• 50: Standard\n• 100+: Very stable") int i_rvLookback = input.int(20, "Realized Vol Lookback", minval=10, maxval=50, group=GRP_ENGINE, tooltip="Lookback for Parkinson + Yang-Zhang realized volatility estimators.") // DISPLAY LAYERS bool i_showVixLevel = input.bool(true, "Show VIX Level Z-Score", group=GRP_DISPLAY) bool i_showVixSlope = input.bool(true, "Show VIX Slope", group=GRP_DISPLAY) bool i_showTermStructure = input.bool(true, "Show Term Structure", group=GRP_DISPLAY) bool i_showVolSurprise = input.bool(true, "Show Vol Surprise", group=GRP_DISPLAY) bool i_showTransition = input.bool(true, "Show Transition Probability", group=GRP_DISPLAY) bool i_showDangerBar = input.bool(true, "Show Danger Bar", group=GRP_DISPLAY) // DETECTION OVERLAYS bool i_showRegimeDots = input.bool(true, "Show Regime Detection Dots", group=GRP_DETECT) bool i_showTransitionWarning = input.bool(true, "Show Transition Warnings", group=GRP_DETECT) bool i_showStaleDots = input.bool(true, "Show Stale Data Warnings", group=GRP_DETECT) bool i_showSurpriseDetection = input.bool(true, "Show Vol Surprise Detections", group=GRP_DETECT) float i_transitionThreshold = input.float(0.4, "Transition Warning Threshold", minval=0.1, maxval=0.9, step=0.05, group=GRP_DETECT) // VISUALIZATION & DASHBOARD string i_vizMode = input.string("Layered Analysis", "Visualization Mode", options= , group=GRP_VIZ) string i_colorTheme = input.string("Quantum Dark", "Color Theme", options= , group=GRP_VIZ) bool i_showDash = input.bool(true, "Show Dashboard", group=GRP_DASH) // ... other dash inputs PART II: THE IMPLEMENTATION WORKFLOW (CONCEPTUAL) If this were a library, here is how you would use its exported functions to build a sophisticated signal filter. // import DskyzInvestments/DafeVIXEngineLib/1 as vix // // // 1. INITIALIZE & RUN THE ENGINE (happens on every bar) // // The engine would contain all the logic from this indicator. // = vix.run_analysis(zLookback, rvLookback) // // // 2. USE THE INTELLIGENCE TO CREATE FILTERS FOR YOUR STRATEGY // // // A simple trend-following strategy // bool my_buy_signal = ta.crossover(ta.ema(close, 20), ta.ema(close, 50)) // bool my_sell_signal = ta.crossunder(ta.ema(close, 20), ta.ema(close, 50)) // // // --- Build the VIX Filter --- // // We only want to take trend-following trades if the VIX engine confirms a stable, low-volatility environment. // bool vix_filter_pass = state.regime_id <= 2 and // Must be in "Normal" regime or better // state.transition_prob < 0.5 and // Regime must be stable // state.danger_score < 50 and // Overall danger must be low // state.data_confidence > 0.7 // VIX data must be reliable // // // --- Apply the filter to your signals --- // bool final_buy_signal = my_buy_signal and vix_filter_pass // bool final_sell_signal = my_sell_signal and vix_filter_pass // // // 3. PLOT YOUR FILTERED SIGNALS // plotshape(final_buy_signal, "Filtered Buy", ...) /pine] █ CHAPTER 5: A VISUAL GUIDE - DECODING THE DISPLAYS THE ON-CHART OVERLAYS (THE DOTS) These dots are your real-time alerts, plotted directly on the price chart. Colored Dots (Above Price): These are the Regime Detection Dots . Their color corresponds to the currently detected volatility regime (e.g., Green for Low Vol, Yellow for Elevated, Red for Panic). Their transparency indicates the confidence of the classification—a solid dot is a high-confidence reading. Purple Dots (Below Price): These are the Transition Warning Dots . They appear when the engine's predictive model calculates a high probability that the market regime is about to shift. This is a critical early warning to tighten stops or defer new entries. Gold/Red Dots (Below Price): These are the Volatility Surprise Detections . A gold dot signals that fear is significantly "overpriced" (VIX > RV), a condition that often precedes a bounce in equities. A red dot signals that fear is "underpriced" (VIX < RV), indicating dangerous complacency. Gray Dots (Below Price): These are Stale Data Warnings , providing transparent feedback that the engine is currently operating in its fallback mode using realized volatility. THE LOWER INDICATOR PANE (THE ENGINE ROOM) This is where the raw data from all analytical layers is visualized. Choose from four distinct modes: Layered Analysis: The default professional view. Each major component (VIX Level, Slope, Term Structure, Surprise, Transition Prob) gets its own layer, allowing you to see which factor is driving the current analysis. Regime Heatmap: A color-block visualization where the color of each block is determined by a specific metric's state, creating a "heatmap" of market risk. Oscillator Stack: Renders the core metrics as a set of zero-centric oscillators, ideal for spotting momentum and divergences within the volatility data itself. Risk Waterfall: A unique cascading visualization that cumulatively stacks the risk from each component, with the final line representing the total, blended risk assessment. THE DASHBOARD (MISSION CONTROL) The dashboard is a comprehensive, institutional-grade summary of the entire VIX ecosystem. VIX Family Data: Displays the live values for VIX, VIX9D, and VX1!, along with a data confidence score. Instrument Profile: Shows the detected asset and its automatically applied sensitivity profile. State Variables: The core Z-Score and Slope readings that power the engine. Volatility Regime: The final, classified regime name, its duration, and the confidence of the reading. Term Structure: A complete breakdown of the VIX curve analysis, showing the state (Contango/Backwardation), the slope, and the level of inversion. Vol Surprise: Quantifies the Volatility Risk Premium, showing the spread between Implied and Realized vol and classifying it as "Overpriced" or "Underpriced." Transition Engine: The predictive output, showing the raw Transition Probability and the predicted next regime. Danger Assessment: The final, synthesized "Danger Score" from 0-100, providing a single, unambiguous measure of market fragility. █ DEVELOPMENT PHILOSOPHY The DAFE VIX Intelligence Engine was born from the conviction that volatility is the master variable in all financial markets. By deconstructing the VIX complex and analyzing its components through the lens of quantitative finance, we have created a tool that provides a level of contextual awareness previously unavailable to retail traders. This is not just about measuring fear; it's about understanding its structure, its momentum, and its probable future state. It is a tool for quantifying the unseen. █ DISCLAIMER & IMPORTANT NOTES THIS IS AN ADVANCED ANALYTICAL TOOL: This indicator provides intelligence on market volatility, not direct buy or sell signals. It is designed to be used as a master filter and contextual guide for your existing trading strategies. DATA DEPENDENCY: The accuracy of the engine is dependent on a live, reliable data feed for the CBOE VIX family. While the engine has a robust fallback system, its full power is realized with live data. ALL TRADING INVOLVES RISK: The probabilities and classifications are based on historical statistical models. They are a powerful edge, not a guarantee of future outcomes. Create with DAFE.ไลบรารี Pine Script®โดย DskyzInvestments7
Triple SMA with Trend Confirmation SignalsA clean and customizable moving average indicator featuring three SMAs (50, 150, 200) with intelligent trend confirmation arrows. Features: Three Moving Averages: 50, 150, and 200-period SMAs with fully customizable colors and line widths 50/150 Crossover Dots: Visual markers on the 150 MA line when the 50 MA crosses over/under Trend Confirmation Arrows: Smart arrows that confirm sustained moves above/below the 150 MA No False Signals: Arrows only appear after two closes in the same direction, preventing whipsaws How It Works: The 150 SMA is the key decision line. The indicator tracks when price moves above or below this level and waits for confirmation before displaying an arrow: Upward Arrow (↑): Appears above candle when price closes above the 150 MA twice, with the second close higher than the first Downward Arrow (↓): Appears below candle when price closes below the 150 MA twice, with the second close lower than the first Arrows alternate - you'll never see two consecutive arrows in the same direction, ensuring you only get signals at genuine trend changes. Use Cases: Identify sustained breakouts above/below the 150 MA Confirm trend direction before entering trades Spot potential exit points when price weakens below key moving averages Track golden/death crosses between the 50 and 150 SMAs Customization : All colors, line widths, and periods are fully adjustable through the settings panel. Arrow color is also customizable for your preferred chart theme.อินดิเคเตอร์ Pine Script®โดย samnigelmcmahon2
Decycler Momentum Regime Filter ~ CharonQuantThe Decycler Momentum Regime Filter is a trend-following and momentum confirmation indicator built on John Ehlers’ Decycler filtering methods, combined with the Price Momentum Oscillator (PMO) for regime validation. The original Decycler concept uses high-pass filtering techniques to suppress cyclical noise and isolate the underlying directional structure of price. This version extends that foundation into a unified trend regime system designed for real trading conditions, not constant flipping in chop. What’s different in this implementation: • Ehlers Decycler trend backbone to smooth price action and reduce noise • Momentum confirmation using PMO • Zero-line regime filter to avoid weak or transitional environments • Directional state engine that clearly defines bullish, bearish, or neutral trend regimes • Clean visual context using adaptive trend coloring, bar bias, and background shading Trend regimes are only confirmed when all conditions align: • Decycler slope confirms directional trend persistence • PMO is aligned with its signal line (momentum continuation) • PMO is above or below zero (trend-strength regime validation) • The CharonQuant state updates only when trend + momentum agree If one condition fails, the system remains neutral or holds its previous state. This design prioritizes signal quality over signal frequency. Visual interpretation: • Gold (CharonQuant = +1) → Confirmed Bullish Trend Regime • Wine (CharonQuant = –1) → Confirmed Bearish Trend Regime • Gray (Neutral) → No strong trend / transition zone This makes the indicator especially useful as a trend bias filter for systematic swing and position trading. Development and calibration notes: This indicator was developed and calibrated on the 1D CRYPTO:SOLUSD chart. Default parameters are optimized for SOL’s volatility structure and daily trend behavior. You must tweak the settings to fit your asset, timeframe, and trading style. If you do not read this description or do not understand what the indicator is designed to do, do not use it. Indicators amplify both discipline and mistakes. Important reminder: No single indicator is sufficient on its own. This tool is a trend regime filter, not a complete trading system. อินดิเคเตอร์ Pine Script®โดย CharonQuant63
Smart Krypto Futures Daytrade Suite Here is the complete **Strategy & User Guide** for your **"Smart Crypto Futures Daytrade Suite (Final)"** in English. --- # 📘 Smart Crypto Futures Daytrade Suite – User Guide ### 1. Overview This suite is an all-in-one institutional-grade tool designed for **Scalping and Daytrading** cryptocurrencies (Bitcoin, Ethereum, Altcoins). It combines high-timeframe trends with lower-timeframe entry triggers, liquidity levels, and a real-time market dashboard. ### 2. The Visual Legend (What is what?) #### A) Trend & Momentum (The "Traffic Light") * **🟣 Daily EMA 50 (Neon Violet):** The **Macro Trend**. * *Price Above:* Bullish Bias (Look for Longs). * *Price Below:* Bearish Bias (Look for Shorts). * **🟢 4h EMA 50 (Neon Green):** The **Swing Trend**. Ideally, price is above both the Violet and Green lines for a strong trend. * **🔵 WMA 200 (Royal Blue):** The **"Last Line of Defense"**. A weighted moving average often respected by algorithms as major dynamic support or resistance. * **💠 VWAP (Cyan/Light Blue):** The **Session Anchor**. * *Bullish Day:* Price stays above VWAP. * *Bearish Day:* Price stays below VWAP. * **🟡 EMA 9 (Yellow):** The **Entry Trigger**. Use this for timing. Enter when a candle closes above/below this line after a pullback. #### B) Market Structure & Zones * **🟥 / 🟩 Boxes (Solid):** **Supply & Demand Zones** (1h Timeframe). These are major reversal areas. * **⬜ FVG Boxes (Transparent):** **Fair Value Gaps**. Imbalances in the market that price often wants to fill ("mitigate") before continuing the trend. #### C) Liquidity & Targets * **🟡 POC Line (Gold):** **Point of Control** (Yesterday’s highest volume price). * *Rule:* Use as a **Take Profit** target. Price acts like a magnet to this level. * **⚪ PDH / PDL (Grey Dashed):** **Previous Day High / Low**. * *Strategy:* Watch for "Fakeouts" (Liquidity Grabs) at these levels to take a reversal trade. --- ### 3. The Dashboard (Head-Up Display) Located in the top right corner, this panel gives you an instant overview of the market health without switching charts. **Columns:** 1. **ASSET:** Monitors BTC, ETH, Bitcoin Dominance (BTC.D), and Tether Dominance (USDT.D). 2. **TREND (15m):** Compares Price vs. EMA 50 (15m timeframe). * **🟢 BULL:** Short-term trend is Up. * **🔴 BEAR:** Short-term trend is Down. 3. **RSI (15m):** Relative Strength Index (14). * **🟢 < 30:** Oversold (Potential Bounce / Long opportunity). * **🔴 > 70:** Overbought (Potential Pullback / Short opportunity). * **⚪ 30-70:** Neutral. **Correlations to watch:** * If **BTC.D** is BULL (Green), money is flowing into Bitcoin (Altcoins might bleed). * If **USDT.D** is BULL (Green), traders are fleeing to cash (Crypto prices usually drop). --- ### 4. Trading Strategy Blueprints #### Setup A: The "Trend Pullback" (High Probability) 1. **Context:** Price is above **Daily EMA (Violet)** and **4h EMA (Green)**. 2. **Pullback:** Price drops down to test the **WMA 200 (Royal Blue)** or **VWAP (Cyan)**. 3. **Confluence:** Ideally, there is a **Green Demand Zone** or an **FVG** at the same level. 4. **Trigger:** Wait for a candle to close back above the **EMA 9 (Yellow)**. 5. **Target:** The **POC (Gold)** or **PDH (Grey)**. #### Setup B: The "Liquidity Sweep" (Reversal) 1. **Context:** Price shoots up rapidly. 2. **Event:** Price breaks the **PDH (Previous Day High)** but fails to close above it (leaves a long wick). 3. **Dashboard Check:** RSI is red (> 70). 4. **Entry:** Short when price falls back below the PDH. 5. **Target:** Back to the **VWAP** or **POC**. --- ### 5. Risk Management Rules * **No Man's Land:** Do not trade when price is far away from all EMAs and VWAP. Wait for a return to value. * **The Chop:** If the EMAs are flat and weaving through price, the market is ranging. Reduce position size or wait. * **VWAP Rule:** In a strong trend, the VWAP often acts as the "floor" (Longs) or "ceiling" (Shorts). If price breaks VWAP with volume, the day's trend might be changing. **Enjoy the suite! Simplicity is the ultimate sophistication.**อินดิเคเตอร์ Pine Script®โดย socke198629
Logarithmic Fair Value Anchor | PWLogarithmic Fair Value Anchor This indicator overlays a dynamic "fair value" estimate on the price chart, anchored to the momentum and historical relationship of a user-selected reference asset (e.g., gold, broad liquidity proxies, or major indices). It combines logarithmic deviation analysis with relative valuation to adapt to the anchor's behavior, offering a flexible tool for exploring cross-asset divergences, mean-reversion setups, and contextual extremes. Core Mechanics and Math Overview The fair value starts with a baseline: an EMA-smoothed ratio of price to the anchor over the lookback period (default 180 bars). This ratio reflects the historical "normal" relationship between the chart symbol and the anchor. Anchor momentum is added via the smoothed 1-period ROC of the anchor, scaled by a user-adjustable Momentum Influence Scale (default 5.0 — lower values increase responsiveness). This scaled influence is exponentially applied to adjust the baseline ratio. An optional correlation filter weights the adjustment using absolute log-price correlation (with threshold and manual multiplier). The result is DEMA-smoothed (default length 14) for a responsive yet stable fair value line. Deviation bands are built multiplicatively around this fair value using exp(deviation * level), preserving log-scale compatibility. Three band types are available: Log Stdev: Standard deviation of log(price / fair value) — dynamic, volatility-responsive. Static Sigma: Fixed user-defined deviation (default 0.15) — consistent relative widths. ATR: Relativized ATR converted to log deviation — range-based smoothing for volatile markets. Bands use asymmetric multipliers (defaults 1.8 upper / 1.25 lower) with three levels, fills, and markers for visual clarity. Key Features Anchor Flexibility: Choose from Gold (XAUUSD), Silver (XAGUSD), S&P 500 (SPX), BTC, or experimental proxies (GLI/M2 aggregates from FRED/ECONOMICS data). Trend and Visuals: Trend detection (price vs. offset fair value) with optional bar coloring, background highlights for extremes, and diamond markers for overbought/oversold. Enhanced Info Table (toggleable): Shows current fair value, selected anchor, band type, bias (LONG/SHORT/NEUTRAL), trend duration, trend quality (% clean bars), strength rating (icon-based), z-score deviation (effective band multiple in sigmas + approximate percentile), and valuation (Overvalued/Undervalued/Fair). Customization: Lookback, offset, smoothing, momentum scale, correlation weighting, band type, multipliers, bar color toggle — adaptable to different assets/timeframes. What Makes This Approach Distinct The script uses a smoothed price-to-anchor ratio as its baseline, then applies scaled logarithmic momentum influence to create a fair value that respects both history and external dynamics. This differs from pure moving averages or direct ratio models by incorporating cross-asset momentum in a log framework. Band variety and detailed trend quality/strength metrics provide practical tools for navigating volatility regimes and assessing trend reliability — features not commonly combined in one overlay. Usage Suggestions Crypto: Anchor to GLI/M2 for liquidity context; ATR bands help manage volatility. Watch high z-score/percentile or low trend quality for reversals. Equities/Commodities: Gold for inflation views, S&P for market ties; static sigma for stable benchmarks. General Tips: Use log scale for visual alignment. Offset (default 90) projects fair value forward. Leverage table metrics — e.g., quality >80% for stronger trends, strength icons for momentum conviction, valuation extremes for mean-reversion ideas. Test anchors and scales to fit your market. This is an exploratory relative-valuation overlay — results vary by anchor, conditions, and settings. Not financial advice; backtest thoroughly and verify independently. Notes Pine Script v6; requires access to external symbols via request.security(). Minor repainting possible on realtime bars due to smoothing and external data. Community feedback welcome for refinements! อินดิเคเตอร์ Pine Script®โดย PaulWegelin22
Pulse Mean AcceleratorPulse Mean Accelerator (PMA) | MisinkoMaster Pulse Mean Accelerator (PMA) is a high-speed adaptive trend engine designed to dynamically accelerate or stabilize its behavior depending on how aggressively price moves relative to its underlying structure. Instead of acting like a traditional moving average that simply lags behind price, PMA attempts to anticipate momentum expansion by accelerating when price pulses strengthen and stabilizing when market movement slows. The result is a responsive yet smooth trend-following tool that adapts to both trending and consolidating markets. PMA is particularly useful for traders who want earlier participation in expanding trends without sacrificing structural clarity. By combining adaptive acceleration, volatility awareness, and layered smoothing, PMA balances speed and stability to help traders remain aligned with developing momentum. Key Features Adaptive acceleration that reacts when price movement intensifies Automatically slows down during consolidation to reduce noise Multiple moving average types supported for flexibility Volatility-aware responsiveness adjustment Optional confirmation logic to filter weak signals Multiple smoothing modes for balancing speed vs stability Dynamic candle coloring reflecting active trend state Automatic Long and Short markers when direction changes Works across fast intraday and slower swing environments Designed to reduce lag while preserving structure How It Works Pulse Mean Accelerator begins with a moving average structure but enhances it by measuring how aggressively price moves relative to that baseline. When price starts moving faster than the average, acceleration increases, allowing the indicator to catch up quickly. When price slows or becomes erratic, acceleration reduces, preventing excessive reaction to noise. Volatility measurements are incorporated to scale this acceleration, ensuring that responsiveness adapts naturally to current market conditions. Strong moves result in quicker adaptation, while quiet markets lead to smoother, calmer behavior. Additional smoothing layers can then be applied, allowing traders to choose between faster responsiveness or more stable structure depending on their trading style. Optional confirmation logic ensures that signals are not triggered solely by temporary price spikes, helping filter weaker moves. The outcome is a moving average framework that behaves more like a dynamic trend engine rather than a static lagging indicator. Trend Detection Logic Trend direction is determined by how price behaves relative to the accelerated mean structure. Bullish phases occur when price maintains strength above the adaptive mean while momentum confirms upward pressure. Bearish phases occur when price weakens below the structure and downward momentum dominates. Signals appear when participation shifts strongly enough to confirm directional change, helping traders detect transitions from consolidation to expansion phases. Acceleration Behavior A defining characteristic of PMA is its pulse acceleration mechanism. • Strong price pulses increase responsiveness • Weak or slow price movement reduces acceleration • Volatility conditions influence adaptation speed • Structure remains smooth when momentum is weak This dynamic adjustment helps traders enter trends earlier while avoiding excessive reactions during sideways markets. Smoothing Modes PMA includes multiple smoothing options so users can tune responsiveness: • Raw acceleration for fastest reaction • Exponential stabilization for balanced behavior • Additional smoothing layers for structural clarity • Double smoothing for maximum noise reduction This flexibility allows PMA to be tailored for scalping, intraday trading, or higher-timeframe trend following. Visual Signals The indicator provides several visual cues for ease of interpretation: • Candle coloring reflects active trend direction • Adaptive mean and accelerated mean are plotted together • Long and Short markers appear when trend shifts occur • Filled areas highlight separation between price and structure These features help traders read market structure quickly without relying on numerical interpretation. Inputs Overview Users can customize behavior through adjustable components including: • Price source selection used in calculations • Moving average type controlling base structure • Length settings affecting responsiveness • Acceleration sensitivity determining reaction speed • Volatility measurement type influencing adaptation • Smoothing mode selection for stability control • Optional confirmation filtering for signal validation These controls allow the tool to be tuned for both aggressive and conservative trading approaches. Usage Notes Ideal for traders needing faster adaptation to momentum expansion Helps detect early stages of trend acceleration Useful for filtering sideways noise while remaining reactive to breakouts Works well in volatile assets where traditional averages lag Can be combined with support/resistance or volume tools for confirmation Higher smoothing settings suit swing traders, lower smoothing benefits intraday traders Confirmation mode reduces false signals in choppy markets Parameter tuning improves performance across different assets Best Use Scenarios Pulse Mean Accelerator performs particularly well in: • Momentum expansion phases • Breakouts from consolidation ranges • Trend continuation environments • High-volatility market conditions • Assets showing periodic acceleration bursts • Markets transitioning from low to high volatility It is especially effective where traditional moving averages react too slowly to developing moves. Summary Pulse Mean Accelerator transforms traditional moving average logic into an adaptive trend engine capable of accelerating when price momentum expands and stabilizing during calm conditions. By blending acceleration, volatility awareness, and flexible smoothing, it provides traders with a faster yet structured view of market direction. PMA is best suited for traders seeking earlier trend participation while maintaining smooth, readable structure across both fast-moving and consolidating markets.อินดิเคเตอร์ Pine Script®โดย MisinkoMaster73
XAUUSD Position calculator **XAUUSD Funded Position Calculator — Pro Risk Suite** The XAUUSD Funded Position Calculator is a professional risk management and position sizing tool specifically designed for Gold traders and prop firm accounts. This indicator allows traders to visually plan, size, and manage trades directly from the chart using a simple click-based workflow. Users can mark Entry, Stop Loss, and Take Profit levels, and the tool automatically calculates precise lot size based on account balance and selected risk percentage. Key features include a real Break-Even engine that adjusts for fees and spread using position size, Risk-Reward analysis with a dynamic quality meter, and visual R-Lock levels (1R / 2R) to help traders secure profits systematically. The integrated data panel displays both target risk and actual risk exposure, profit projections, lot size formatted for MT4/MT5 standards, and real-time trade quality evaluation. Designed for funded traders, scalpers, and Gold specialists, this tool enhances execution discipline, capital protection, and trade planning efficiency — all within a clean, professional chart interface. **Core Features** • Click-to-set Entry / SL / TP • Funded account risk % sizing • Real Break-Even price calculation • 1R & 2R profit lock levels • Dynamic Risk-Reward meter • Actual vs Target risk display • MT4/MT5 lot formatting • Clean visual trade panel Built for precision. Designed for discipline. Optimized for funded trading. อินดิเคเตอร์ Pine Script®โดย StivenMRที่อัปเดต: 9