Temporal Value Tracker: Inception-to-Present Inflation Lens!What we're looking at here is a chart that does more than just display the price of gold. It offers us a time-traveling perspective on value. The blue line, that's our nominal price—it's the straightforward market price of gold over time. But it's the red line that takes us on a deeper journey. This line adjusts the nominal price for inflation, showing us the real purchasing power of gold.
Now, when we talk about 'real value,' we're not just philosophizing. We're anchoring our prices to a point in time when the journey began—let's say when gold trading started on the markets, or any inception point we choose. By 'shadowing' certain years—say, from the 1970s when the gold standard was abandoned—we can adjust this chart to reflect what the inflation-adjusted price means since that key moment in history.
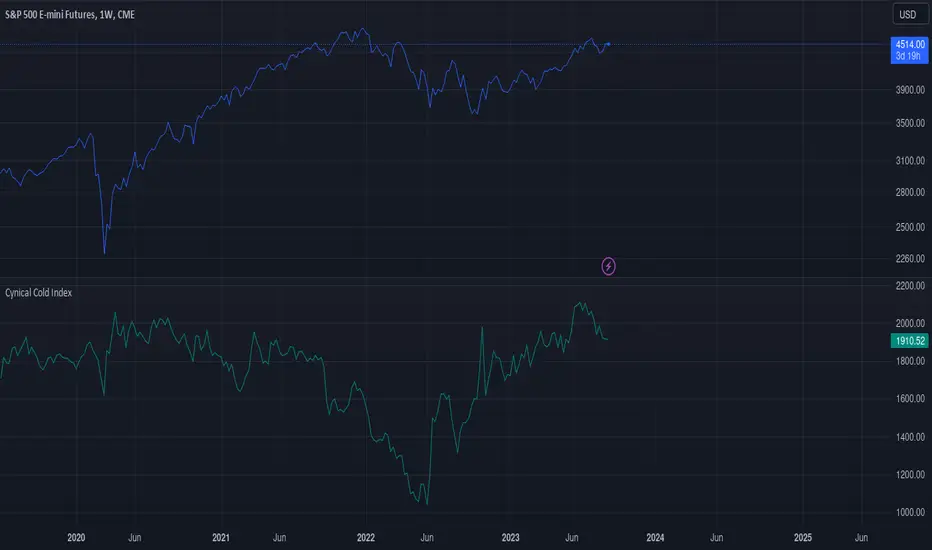
By doing so, we're effectively isolating our view to start from that pivotal year, giving us insight into how gold, or indeed any asset, has held up against the backdrop of economic changes, policy shifts, and the inevitable rise in the cost of living. If you're analyzing a stock index like the S&P 500, you might begin your inflation-adjusted view from the index's inception date, which allows you to measure the true growth of the market basket from the moment it started.
This adjustment isn't just academic. It influences how we perceive value and growth. Consider a period where the nominal price skyrockets. We might toast to our brilliance in investment! But if the inflation-adjusted line lags, what we're seeing is nominal growth without real gains. On the other hand, if our red line outpaces the blue even during stagnant market periods, we're witnessing real growth—our asset is outperforming the eroding effects of inflation.
Every asset class can be evaluated this way. Stocks, bonds, real estate—they all have their historical narratives, and inflation adjustment tells us if these stories are tales of genuine growth or illusions masked by inflation.
So, as informed traders and investors, we need to keep our eyes on this inflation-adjusted line. It's our measure against the silent thief that is inflation. It ensures we're not just keeping up with the Joneses of the market, but actually outpacing them, building real wealth over time
อินดิเคเตอร์ Pine Script®