Gold / Silver Ratio (Live Futures Ratio)This gives you the live futures ratio, which is better for intraday traders.อินดิเคเตอร์ Pine Script®โดย Benjamil990
GOLD SCALP HUSSAIN ALSLAEM PROalawi and hasooni indicator for xauusd and for easy margin call อินดิเคเตอร์ Pine Script®โดย HussainAlsalem20
Gold Trap Hunter (Auto-Structure & Liquidity Sweeps)The Concept: Stop Getting Trapped Have you ever bought a breakout, only to watch the price immediately reverse and hit your stop loss? This is called a Liquidity Trap (or "Sweep"). Institutional algorithms often push price slightly above a key High or below a key Low to trigger retail stop losses before moving the market in the real direction. The Universal Trap Hunter is designed to visualize this market structure automatically. It helps you avoid "Fake Breakouts" and identifies high-probability Reversal points where the "Smart Money" is active. How It Works (The Logic) 1. The Structure Boxes (The Battlefield) The indicator draws a shaded box representing the Higher Timeframe Structure. Green Box: The market structure is Bullish (Making Higher Highs). We are looking for longs. Red Box: The market structure is Bearish (Making Lower Lows). We are looking for shorts. Feature: This is Universal. If you are on the 15-minute chart, it automatically calculates the 4-Hour structure for you. You are always trading with the bigger trend. 2. The "SWEEP" Signal (The Entry Trigger) A "Sweep" is the most powerful signal in this system. What is it? Price breaks a previous structure High/Low but fails to close there. It grabs the liquidity and reverses. ⚔️ Green Sweep: Price broke the previous Low (trapping sellers), then closed back UP inside the range. This is a bullish reversal signal. ⚔️ Red Sweep: Price broke the previous High (trapping buyers), then closed back DOWN inside the range. This is a bearish reversal signal. 3. The Noise Filter (Gray Candles) Trading is about knowing when NOT to trade. Gray Candles: These indicate "Noise." The price action is choppy or conflicting with the trend. Colored Candles: The candles only turn Green or Red when the Trend, Momentum, and Structure all align. If you see color, the move is valid. Settings & Customization Structure Mode (Auto vs Manual): Auto (Recommended): The script automatically selects the best Higher Timeframe for you. Scalping 1m? → It looks at 1H Structure. Trading 15m? → It looks at 4H Structure. Manual: You can lock it to a specific timeframe (e.g., always show Daily structure). Colors: Fully customizable to fit your dark/light theme. How to Trade This Strategy Identify the Trend: Look at the background Box color (Green = Bullish, Red = Bearish). Wait for the Trap: Do not chase the price. Wait for price to challenge the edge of the box. The Signal: Look for the "⚔️ SWEEP" label. If the box is Green and you see a Green Sweep at the bottom: Strong Buy. If the box is Red and you see a Red Sweep at the top: Strong Sell. Disclaimer: This tool is for educational purposes and market analysis only. It helps visualize market structure and liquidity traps but does not guarantee future results. Always manage your risk.อินดิเคเตอร์ Pine Script®โดย chyg88231185
Gold 2-Week Futures LevelsYou may change the color at bottom of script and i used 1h to mark out my levels, you may change it to fit your time frame.อินดิเคเตอร์ Pine Script®โดย aryx100
Gold Scalp//@version=5 indicator("scalp strategy (Boxed)", overlay=true) // Ensure 5-minute chart isFiveMin = timeframe.isminutes and timeframe.multiplier == 5 // New York time (EST/EDT auto) nyHour = hour(time, "America/New_York") nyMinute = minute(time, "America/New_York") // Target times (exact candle close) triggerTime = (nyHour == 11 and nyMinute == 0) or (nyHour == 19 and nyMinute == 0) or (nyHour == 14 and nyMinute == 0) or (nyHour == 6 and nyMinute == 0) or (nyHour == 8 and nyMinute == 0) or (nyHour == 21 and nyMinute == 0) or (nyHour == 00 and nyMinute == 0) // Final trigger trigger = isFiveMin and triggerTime and barstate.isconfirmed // Draw box + label if trigger box.new(bar_index - -5, high, bar_index, low, bgcolor=color.new(#0e06eb, 76), border_color=color.rgb(4, 252, 136)) label.new(bar_index, high, "", style=label.style_label_down, color=color.rgb(11, 48, 3), textcolor=color.white, size=size.small) // Alert alertcondition(trigger, title="LETS GO", message="5-minute candle CLOSED at key EST time") อินดิเคเตอร์ Pine Script®โดย JASPALGOLD26
GOLD TERTIUM estrategiaThis indicator is a visual tool for TradingView designed to help you read trend structure using EMAs and highlight potential long and short entries on the MGC 1‑minute chart, while filtering pullbacks and avoiding trades when the 200 EMA is flat. It calculates five EMAs (32, 50, 110, 200, 250) and plots them in different colors so you can clearly see the moving‑average stack and overall direction. The main trend is defined by the 200 EMA: bullish when price and the fast EMAs (32 and 50) are above it with a positive slope, and bearish when they are below it with a negative slope; if the 200 EMA is almost flat, signals are blocked to reduce trading in choppy markets.กลยุทธ์ Pine Script®โดย bkfeuer3264
GOLD TERTIUM MGC 1mThis indicator is a visual tool for TradingView designed to help you read trend structure using EMAs and highlight potential long and short entries on the MGC 1‑minute chart, while filtering pullbacks and avoiding trades when the 200 EMA is flat. It calculates five EMAs (32, 50, 110, 200, 250) and plots them in different colors so you can clearly see the moving‑average stack and overall direction. The main trend is defined by the 200 EMA: bullish when price and the fast EMAs (32 and 50) are above it with a positive slope, and bearish when they are below it with a negative slope; if the 200 EMA is almost flat, signals are blocked to reduce trading in choppy markets. Entry logic looks for a pullback into the 32–50 EMA zone on the previous candle, then requires a trend‑aligned candle to trigger a signal: long when the trend is up, the previous bar retested the EMA zone, and the current bar closes above EMA 32 with a bullish body; short when the trend is down, there was a valid retest, the current bar closes below EMA 32 with a bearish body and EMA 32 is below EMA 50. On the chart, you will see colored EMAs plus green “L” triangles under bars for potential long entries and red “S” triangles above bars for potential short entries, which are meant as visual cues rather than automatic trade instructionsอินดิเคเตอร์ Pine Script®โดย bkfeuer326ที่อัปเดต: 5
Gold Bullish Order Blocks - 3 Candle Confirmation after the OBBest Order blocks finder created by Marky using claude AI.อินดิเคเตอร์ Pine Script®โดย Maychristine50
GOLDEN RSI (70-50-30)The fluctuation range has been expanded. Theoriginal author only set it between 40 and 60, but arange of 30 to 70 would be more reasonableAdditionally, a 50 median line has been added withinthe fluctuation rangeอินดิเคเตอร์ Pine Script®โดย keefe_hoo16
SHOPPA trendgolden cross and death cross indicator with exit strategy อินดิเคเตอร์ Pine Script®โดย Trend7117
GOLD EMA Crossover Strategy This EMA Crossover Strategy is designed for intraday trading on the 5-minute chart. It uses three EMAs (fast, mid, slow) to identify momentum shifts and trigger long or short entries. Risk management is dollar-based, with default settings of $100 risk per trade and $300 profit target. Entries are taken when the fast EMA crosses above/below the mid or slow EMA, with stops and targets calculated dynamically. The strategy runs across all hours and uses fixed position sizing (default 3 contracts). It is intended as a framework for traders to adapt and optimize to their own instruments and risk preferences.กลยุทธ์ Pine Script®โดย crtaylor5522
Gold Master: Swing + Daily Scalp (Fixed & Working)How to use it correctly Daily chart → Focus only on big green/red triangles (Swing trades) 5m / 15m / 1H chart → Focus on small circles (Scalp trades) You can turn each system on/off independently in the settings Works perfectly on XAUUSD, GLD, GC futures, and even DXY (inverse signals).อินดิเคเตอร์ Pine Script®โดย ela2418
XAU/SPX with SMA 48Gold to SP 500 ratio monthly with 48 months moving average.อินดิเคเตอร์ Pine Script®โดย Niddecoucous4
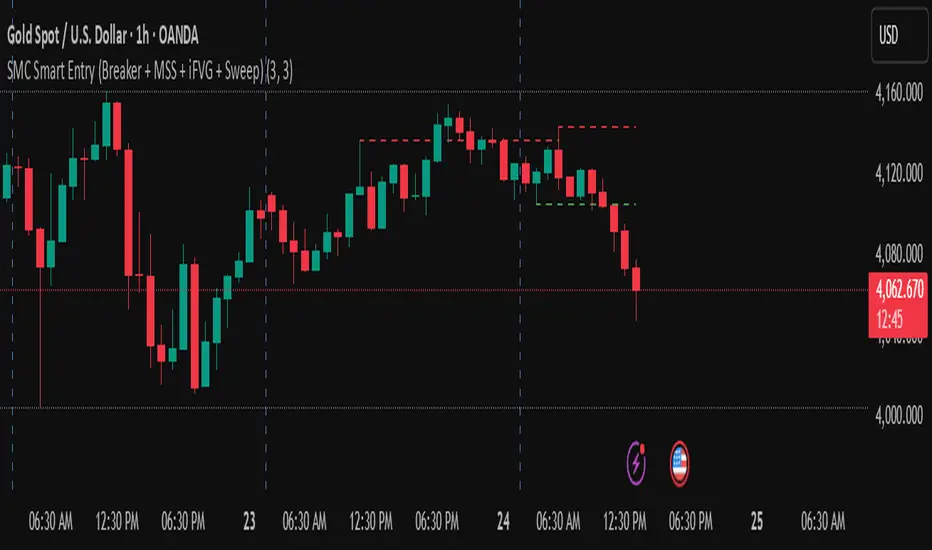
golden smart entrySmart Money Concepts (SMC) is a trading methodology that focuses on understanding and following the behavior of institutional investors—often referred to as "smart money." The goal is to identify high-probability trade setups by analyzing how these large players move the market.อินดิเคเตอร์ Pine Script®โดย Kanagashuba123112
Golden Cross & Death Cross DetectorThis script will: Plot both moving averages on your chart Show triangle markers when crossovers occur Allow you to set up alerts Let you choose between SMA and EMA Customize the periods for both moving averages อินดิเคเตอร์ Pine Script®โดย antsanchezdev4
nadia Gold ramon strategy based on 50 candles and atr of 12 You enter the maximum of 50 candles once the most bearish starts to rise, we expect 10 candles, if you don't go up in 10 candles, you don't enter, if you go up before 10 candles, you enter. When is TP? Enough with 5 candles The temporality is 1 hour. It can be adjusted to 1 minute temporality for scalping. It is never lost, because it always exceeds the previous maximums.กลยุทธ์ Pine Script®โดย nadia1988173
Gold Sessions BackgroundEasier to see on chart when NY hours start and finishอินดิเคเตอร์ Pine Script®โดย KamillaAbr13
Gold NY Session Key TimesJust showing to us that news come out, open market, close bond for NY Session Time For Indonesiaอินดิเคเตอร์ Pine Script®โดย gadingthebeatboxer31
Gold - First 5m Candle NY Session rteerrhhrhhfkfwewjgggjjgtiioghghghghghghihhjggdhlhgกลยุทธ์ Pine Script®โดย qbkvxr20
Gold Master Indicator [Improved Signals]this indicater help you buy sans sell abobe and below the blue line.อินดิเคเตอร์ Pine Script®โดย bholalondon057
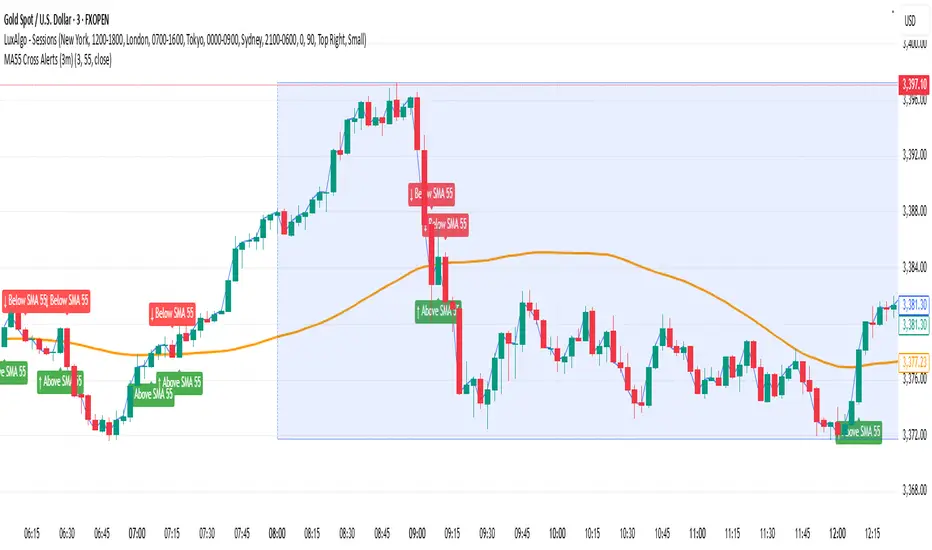
Gold MA55 Cross Alerts (3m)This indicator helps to trade profitably in london and new york session.อินดิเคเตอร์ Pine Script®โดย navdeepsingh12227
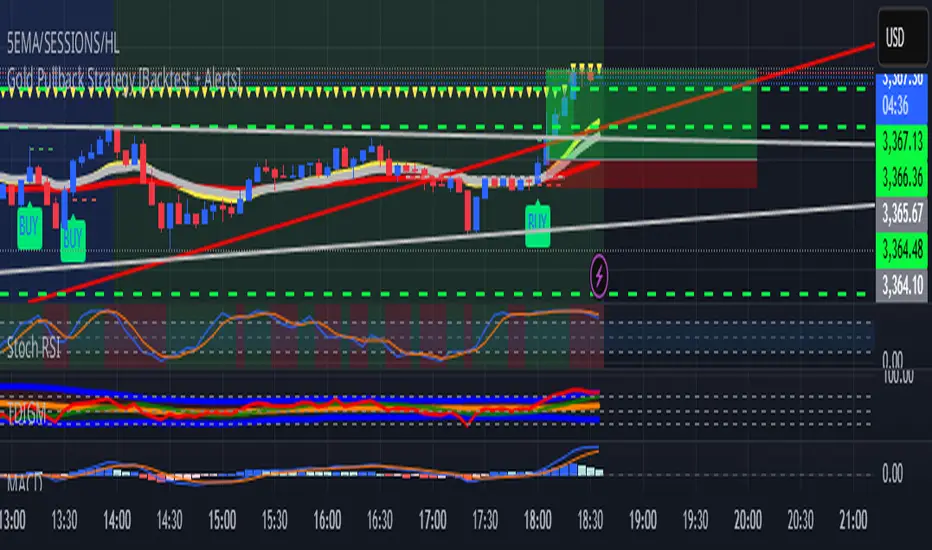
Gold Pullback Strategy [Backtest + Alerts]XAU USD M5 M15 TP1-1 BUY Pull black EMA 21 Storsi oversold กลยุทธ์ Pine Script®โดย HaiUs3026
GOLD Volume-Based Entry StrategyShort Description: This script identifies potential long entries by detecting two consecutive bars with above-average volume and bullish price action. When these conditions are met, a trade is entered, and an optional profit target is set based on user input. This strategy can help highlight momentum-driven breakouts or trend continuations triggered by a surge in buying volume. How It Works Volume Moving Average A simple moving average of volume (vol_ma) is calculated over a user-defined period (default: 20 bars). This helps us distinguish when volume is above or below recent averages. Consecutive Green Volume Bars First bar: Must be bullish (close > open) and have volume above the volume MA. Second bar: Must also be bullish, with volume above the volume MA and higher than the first bar’s volume. When these two bars appear in sequence, we interpret it as strong buying pressure that could drive price higher. Entry & Profit Target Upon detecting these two consecutive bullish bars, the script places a long entry. A profit target is set at current price plus a user-defined fixed amount (default: 5 USD). You can adjust this target, or you can add a stop-loss in the script to manage risk further. Visual Cues Buy Signal Marker appears on the chart when the second bar confirms the signal. Green Volume Columns highlight the bars that fulfill the criteria, providing a quick visual confirmation of high-volume bullish bars. Works fine on 1M-2M-5M-15M-30M. Do not use it on higher TF. Due the lack of historical data on lower TF, the backtest result is limited.กลยุทธ์ Pine Script®โดย Rendon13395