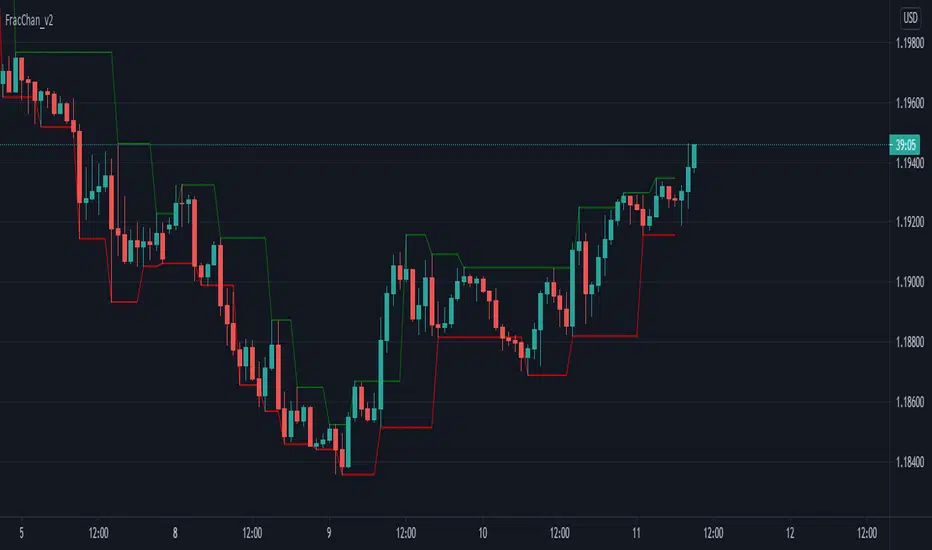
Fractal Channel v2Just another way of visualizing Williams' Fractals: they are now joined in a channel.
You can also create a channel of Fractals from another time frame than the current.
Great for identifying breakout entries, trend direction analysis (i.e. easily visualize Higher Lows, Higher Highs, Lower Lows, Lower Highs) or to trail your Stop Losses.
Version 2 of the Fractal Channel now correctly identifies William's Fractals when the High/Low of the 'Fractal Candle' is equal to the High/Low of the neighbouring 2 candles on both sides.
ค้นหาในสคริปต์สำหรับ "Fractal"
Fractals | Swing Points | Highs & Lows | Custom PeriodsSimple script which marks out key swing highs & lows.
One of the only indicators I have on the chart most days
- perfect for naked charting
- quickly helps you to visually identify key areas of interest
An extension of Bill Williams fractals
- aka short term swing points
Allows you to filter for only the most prominent swing points
- you can even overlay multiple swingpoint filters in different colours (as per example chart)
The number ( Fractal Periods) is simply:
- the number of less prominent points either side of your swing high/low
- example shown on the chart
Otherwise make a fist
- look at your 5 knuckles
- swing high is your middle knuckle
- 2 lower points either side
Bill Williams Original Fractal:
Fractal Periods = 2
Your Fractal Period for Filtering:
3, 4, 5, 30, 365, etc
Allows you to find swing points down to:
Fractal Periods = 1
Simple, easy, shared to enjoy =)

Fractal & Entropy Market Dynamics with Mexican Hat WaveletThis indicator combines fractal analysis, entropy, and wavelet theory to model market dynamics using a customized approach. It integrates advanced mathematical techniques to assess the complexity and structure of price action, while also incorporating volume and price volatility.
Key Concepts and Features:
Volume-Weighted Price:
The script calculates a volume-adjusted price using a moving average of volume to give more weight to periods with higher volume. This allows the indicator to account for the impact of trading volume on price movements, enhancing its sensitivity to significant price shifts.
Mexican Hat Wavelet Approximation:
The script employs the Mexican Hat Wavelet, a mathematical tool that approximates price movements based on the Laplacian of the price series. This helps capture localized oscillations in price, acting as a filter to highlight certain price dynamics over the specified length. This wavelet is commonly used to identify key inflection points and trends in financial data.
Fractal Dimension Calculation:
The fractal dimension is calculated to quantify the market's complexity. It measures how price moves between intervals, with higher values indicating chaotic or more volatile market behavior. This dimension captures the self-similarity in price movements across different time frames, a key feature of fractals.
Shannon Entropy Calculation:
Shannon Entropy is used to measure the randomness or uncertainty in the price action. It calculates the degree of unpredictability based on the price changes, providing insight into the market's informational efficiency. Higher entropy indicates more randomness, while lower entropy suggests more predictable trends.
Custom Normalization:
The script includes a custom normalization function that processes the composite score (derived from fractal dimension and entropy). This normalization helps scale the values into a consistent range, making it easier to interpret the output. The smoothing factor and RSI-based approach ensure that the normalized value reacts smoothly to the changes in market dynamics.
Composite Score:
The composite score is a weighted combination of the fractal dimension and entropy. This score aims to provide a holistic view of the market by combining the structural complexity (fractal) and randomness (entropy) into one unified metric.
Plotting and Visuals:
The indicator plots the normalized composite score on a scale where a baseline of 50 is provided for reference. The resulting plot helps traders visualize market dynamics, with the score fluctuating based on changes in the market's fractal dimension and entropy. A score above or below the baseline of 50 indicates potential market shifts.
Use Case:
The "Enhanced Fractal and Entropy Market Dynamics with Mexican Hat Wavelet" is useful for traders looking to identify market conditions where there is a balance between price structure and randomness. By integrating wavelets, fractals, and entropy, the indicator can provide insights into market complexity, helping traders recognize potential trend reversals, periods of consolidation, or increased volatility. This can be particularly effective for those employing swing trading or trend-following strategies

Fractal FramerThis indicator constructs dynamic high/low price range levels, based on 3 point fractals. Trend lines are drawn (zigzag style) at fractal points when trend direction is clearly established.
This is a lagging indicator: fractals lag by one bar and trend lines can lag by many bars. However, its strength lays in objectively defining historic price action: e.g. support/resistance levels and waves within a trend.
See the comments at the beginning of the script for a complete description.

Fractal and Alligator Alerts by JustUncleLThis is based on two well known Bill Williams Fractal and Alligator strategies.
The following code is an implementation is similar to reversal strategy specified here:
forexwot.com
and another well know Alligator break out strategy.
This was achieved by combining some of the ideas from two other indicators:
True Williams Alligator (SMMA) by the_batman
Fractals and Levels by JustUncleL
There are two types of Fractal + Alligator Strategies included in this indicator:
Fractal Reversal : In an uptrend defined by Low Fractal that is above the Alligator teeth and the Alligator mouth is completed open in an uptrend. The opposite for downtrends. (Green and Red Arrows)
Fractal BreakOut : In an uptrend, at the start of Alligator open we look back for the first Fractal High above Alligator Teeth. Alligator teeth must be above mouth. (Aqua and Fuchsia arrows)

Event Locator BasicUsable under any conditions and in all markets, the 'event locator' provides a foundational layer for any count-based trading strategy or system. This specific installment color codes events - all down events are green, up events are blue, double-marked events are red, and smooth events are gray. It also wraps the price sequence in a 3-d line landscape plot - providing a visual using lines that are event sensitive. Though events are sometimes referred to as 'fractals,' this is not a fractal tool. These marks are based on 3 candles, not 5 as is common with the Bill Williams fractal scripts. Every countable event on the chart will be marked using this tool. Really, Elliott Wave should have told you about this... (because you can't legitimately count w/o it)
//This indicator was originally a mod of the 'Williams Fractals' indicator - modified by Erek A.D., Nov. 2017
//It was rewritten from the ground up by 'Brobear' in Sept./Oct. 2018
//This code marks 'rough' AND 'smooth' EVENTS in price flow
//EVENTS are naturally created in markets when SEPARATION occurs at candle tips
//SEPARATION happens when a high is flanked by lower highs or a low is flanked by higher lows
//EVENT LOCATORS like this provide an objective foundation for counting price movement

STP Fractal CorridorsFractal Corridors is a lagging channel connecting Fractal highs and lows each with added/substracted pre-set value.
It is inspired and designed for Vladimir Poltoratskiy's trading style with his ST patterns (book: Forex Strategy: ST Patterns Trading Manual).
This uses fractals with one candle lower/higher on each side as in the book.
You may choose to disable fractals and view the channel only.
Good luck trading!

Fractals with HH/LLStandard fractals indicator with an additional signal to show if it was higher than the last "up" or lower than the last "down"
A blue dot indicates the higher/lower fractal.
Working on an update to add a counting feature which will indicate when a certain number of higher highs from a given starting point has been achived.

Fractal Regression Bands [DW]This study is an experimental regression curve built around fractal and ATR calculations.
First, Williams Fractals are calculated, and used as anchoring points.
Next, high anchor points are connected to negative sloping lines, and low anchor points to positive sloping lines. The slope is a specified percentage of the current ATR over the sampling period.
The median between the positive and negative sloping lines is then calculated, then the best fit line (linear regression) of the median is calculated to generate the basis line.
Lastly, a Golden Mean ATR is taken of price over the sampling period and multiplied by 1/2, 1, 2, and 3. The results are added and subtracted from the basis line to generate the bands.
Williams Fractals are included in the plots. The color scheme indicated whether each fractal is engulfing or non-engulfing.
Custom bar color scheme is included.

Fractal Suite: MTF Fractals + BOS/CHOCH + OB + FVG + Targets Kese Way
Fractals (Multi-Timeframe): Automatically detects both current-timeframe and higher-timeframe Bill Williams fractals, with customizable left/right bar settings.
Break of Structure (BOS) & CHoCH: Marks structural breaks and changes of character in real time.
Liquidity Sweeps: Identifies sweep patterns where price takes out a previous swing high/low but closes back within range.
Order Blocks (OB): Highlights the last opposite candle before a BOS, with customizable extension bars.
Fair Value Gaps (FVG): Finds 3-bar inefficiencies with a minimum size filter.
Confluence Zones: Optionally require OB–FVG overlap for high-probability setups.
Entry, Stop, and Targets: Automatically calculates entry price, stop loss, and up to three take-profit targets based on risk-reward ratios.
Visual Dashboard: Mini on-chart table summarizing structure, last swing points, and settings.
Alerts: Set alerts for new fractals, BOS events, and confluence-based trade setups.

Fractals V9 ModifiedSo taking Ricardo Santos script for fractals V9 -I change the time function of the high TF fractal to non repainting one
adding daily fib levels
This hybrid seems to look nice . I have to admit that all credit to Ricardo Santos for his exelent script.
thi work it hybrid work and not so much original work....
The main improvment is the signals which are not reapinting as we remove security from that.
Security function exist for daily fib but it has nothing to do wih signal generation so i did not touch it

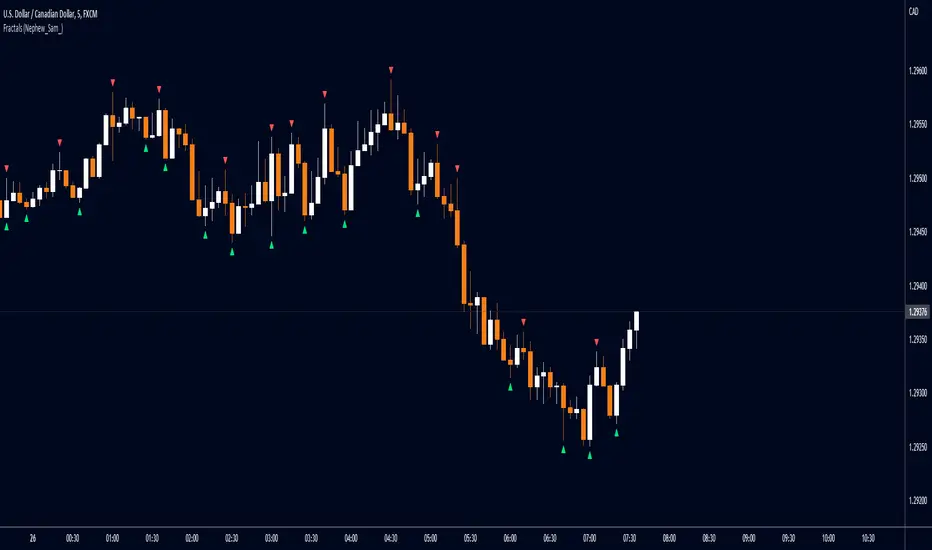
Fractals (Nephew_Sam_)Regular and Williams fractal
1. Plots 3 and 5 bar fractal point
2. Plots significant highs/lows lines
Credits to @RicardoSantos, Code taken from his open source script (V9).
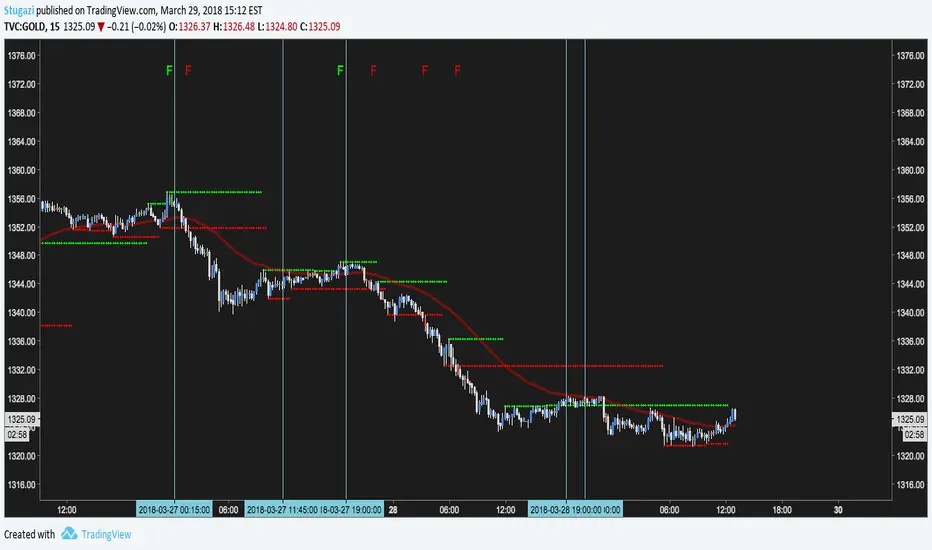
Fractal Support ResistanceTroubleshooting this script.
The vertical lines are when the alerts fired in TradingView. Along the top a green F is LONG signal and red F is SHORT. Signals fire only after CLOSING for two consecutive bars above or below a fractal. Also there is a min delay of 12 bars between signals.
The alerts are configured identical to the F character plots. Not sure why the alerts are randomly firing. =(
Fractal Break Strategy with Time FilterThis strategy isn't complete yet but just curious how fast they will take it down. It is based off breaks of fractals and then taking the High/Low of the break candle

Williams Fractals BW - Flechas + Breakoutsfractal con velas en la direccion hacia donde va para menos conficion
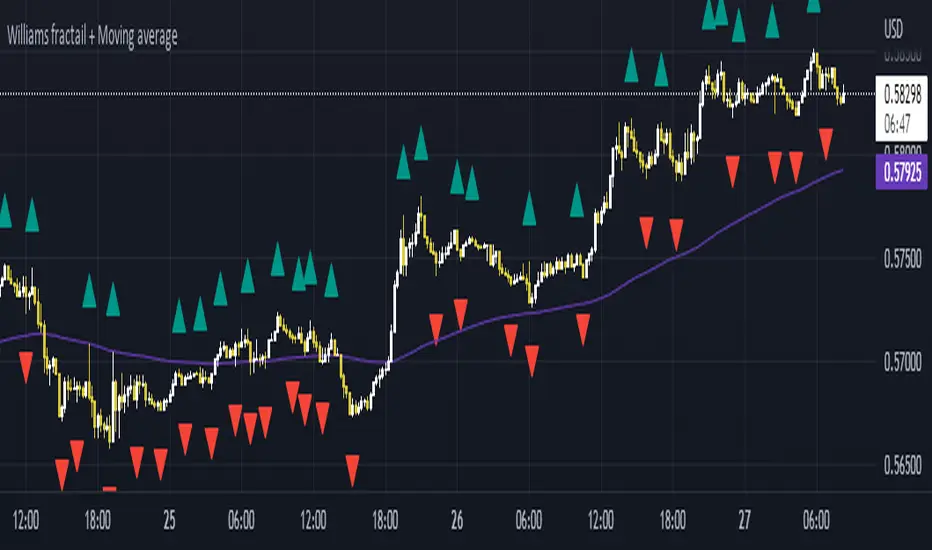
Williams Fractals + SMMAwilliams fractail + moving average. Is for educational . combined indicator of williams fractails and smmothed moving average
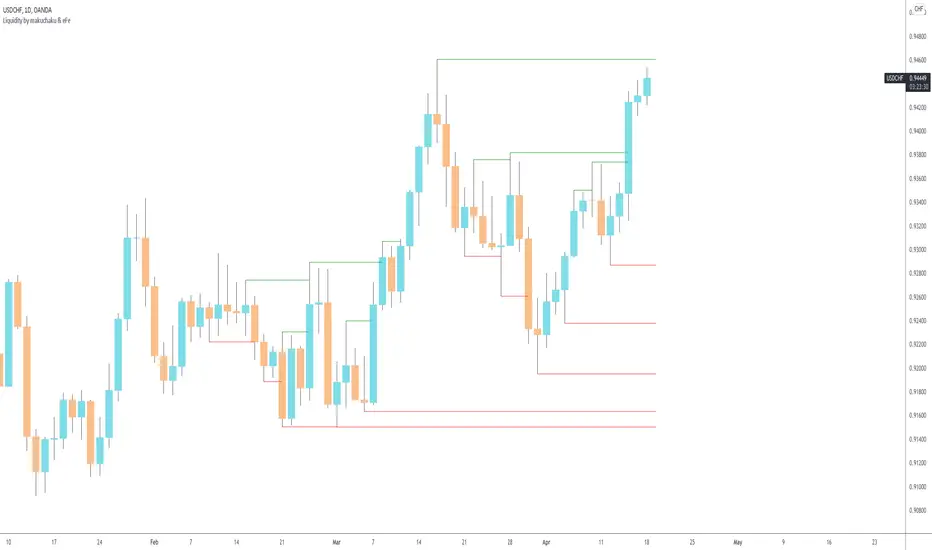
Makuchaku's trading tools - Liquidity visualizerThis indicator plots those pivots/fractals which have not been taken out by price, whereby showing where are the clusters of highs/lows where stop orders (or liquidity) could be hiding.
This is a fantastic tool for taking reversal trades.
Fractal lines multi time framePlot lines using last two William's fractals to find trends, it supports different resolutions and alerts

RSX FracticalityA little project I was working on to avoid studying for finals. Using LazyBear's RSX code for a smoother RSI, then taking the RSX of fib number lengths. Take the average of that, then the JMA of that from the same fib numbers. The average of that is then treated as the trend, take the average of the trend values from the main time frames, the script calls pretty far back so adding a W or M TF I think would throw the calculations off. Then I smoothed that value using the jma's to create the overall trend. I got the idea from Ehler's Empirical Mode Decomposition about identifying peaks and valleys and creating an average of that to create a range. The idea is that if the trend is above the Average Peak then it is a bull trend, less than the average valley it's a bear trend, in between it's ranging. It looks like it turned out alright, I'll be working on this idea of fractals a lot this summer to see if I can improve it or build something better off of the idea.

Fractals and Pattern MandelbrotThis indicator show classic fractals and patterns of force long or short if they are on the top or on the low of a x candles, so they try to anticipate the inversion of the trend.
The purple arrow indicate the fractals and the blue indicate the pattern for the inversion of the trend.
For the targets and the stop we need to use Fibonacci extentions modificate with this values:
-1.64
-0.64
1.5563
2.422
3.5699
4.669
5.8664
9.1299
14.208
and use this A,B,C points:
For long positions A is the LAST RED CLOSE, B is the GREEN CLOSE just before the blue arrow, C is B.
the -1.64 is the stop loss, if price close under that
the -0.64 is the best level to enter long
For short positions A is the LAST GREEN CLOSE, B is the RED CLOSE just before the blue arrow, C is B.
the -1.64 is the stop loss, if price close above that
the -0.64 is the best level to enter short

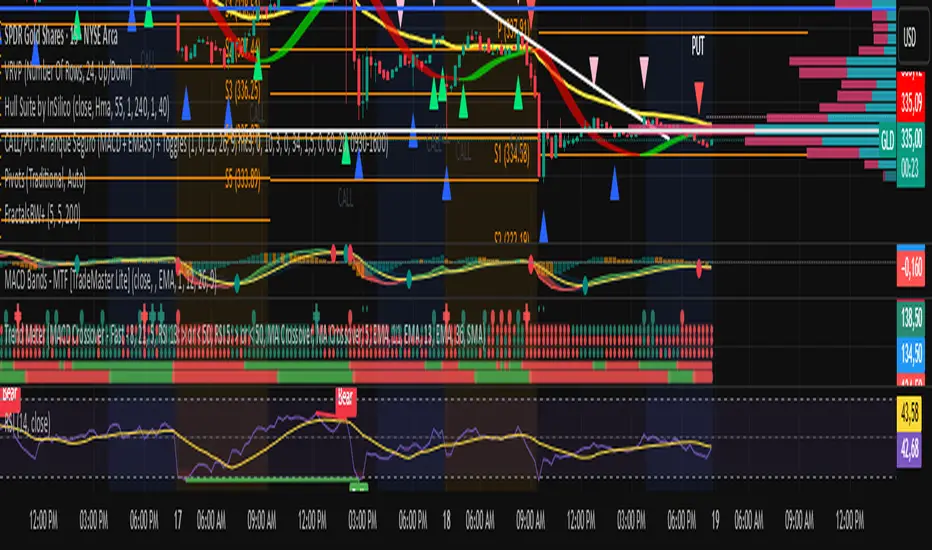
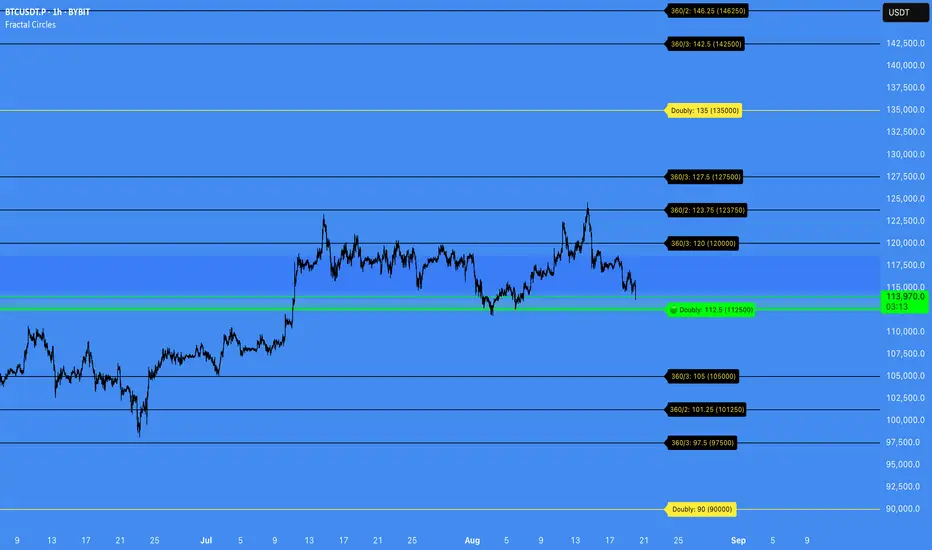
Fractal Circles#### FRACTAL CIRCLES ####
I combined 2 of my best indicators Fractal Waves (Simplified) and Circles.
Combining the Fractal and Gann levels makes for a very simple trading strategy.
Core Functionality
Gann Circle Levels: This indicator plots mathematical support and resistance levels based on Gann theory, including 360/2, 360/3, and doubly strong levels. The system automatically adjusts to any price range using an intelligent multiplier system, making it suitable for forex, stocks, crypto, or any market.
Fractal Wave Analysis: Integrates real-time trend analysis from both current and higher timeframes. Shows the current price range boundaries (high/low) and trend direction through dynamic lines and background fills, helping traders understand market structure.
Key Trading Benefits
Active Level Detection: The closest Gann level to current price is automatically highlighted in green with increased line thickness. This eliminates guesswork about which level is most likely to act as immediate support or resistance.
Real-Time Price Tracking: A customizable line follows current price with an offset to the right, projecting where price sits relative to upcoming levels. A gradient-filled box visualizes the exact distance between current price and the active Gann level.
Multi-Timeframe Context: View fractal waves from higher timeframes while maintaining current timeframe precision. This helps identify whether short-term moves align with or contradict longer-term structure.
Smart Alert System: Comprehensive alerts trigger when price crosses any Gann level, with options to monitor all levels or focus only on the active level. Reduces the need for constant chart monitoring while ensuring you never miss significant level breaks.
Practical Trading Applications
Entry Timing: Use active level highlighting to identify the most probable support/resistance for entries. The real-time distance box helps gauge risk/reward before entering positions.
Risk Management: Set stops based on Gann level breaks, particularly doubly strong levels which tend to be more significant. The gradient visualization makes it easy to see how much room price has before hitting key levels.
Trend Confirmation: Fractal waves provide immediate context about whether current price action aligns with broader market structure. Bullish/bearish background fills offer quick visual confirmation of trend direction.
Multi-Asset Analysis: The auto-scaling multiplier system works across all markets and timeframes, making it valuable for traders who monitor multiple instruments with vastly different price ranges.
Confluence Trading: Combine Gann levels with fractal wave boundaries to identify high-probability setups where multiple technical factors align.
This tool is particularly valuable for traders who appreciate mathematical precision in their technical analysis while maintaining the flexibility to adapt to real-time market conditions.
Fractal Breakout Trend Following System█ OVERVIEW
The Fractal Breakout Trend Following System is a custom technical analysis tool designed to pinpoint significant fractal pivot points and breakout levels. By analyzing price action through configurable pivot parameters, this indicator dynamically identifies key support and resistance zones. It not only marks crucial highs and lows on the chart but also signals potential trend reversals through real-time breakout detections, helping traders capture shifts in market momentum.
█ KEY FEATURES
Fractal Pivot Detection
Utilizes user-defined left and right pivot lengths to detect local highs (pivot highs) and lows (pivot lows). This fractal-based approach ensures that only meaningful price moves are considered, effectively filtering out minor market noise.
Dynamic Line Visualization
Upon confirmation of a pivot, the system draws a dynamic line representing resistance (from pivot highs) or support (from pivot lows). These lines extend across the chart until a breakout occurs, offering a continuous visual guide to key levels.
Trend Breakout Signals
Monitors for price crossovers relative to the drawn pivot lines. A crossover above a resistance line signals a bullish breakout, while a crossunder below a support line indicates a bearish move, thus updating the prevailing trend.
Pivot Labelling
Assigns labels such as "HH", "LH", "LL", or "HL" to detected pivots based on their relative values.
It uses the following designations:
HH (Higher High) : Indicates that the current pivot high is greater than the previous pivot high, suggesting continued upward momentum.
LH (Lower High) : Signals that the current pivot high is lower than the previous pivot high, which may hint at a potential reversal within an uptrend.
LL (Lower Low) : Shows that the current pivot low is lower than the previous pivot low, confirming sustained downward pressure.
HL (Higher Low) : Reveals that the current pivot low is higher than the previous pivot low, potentially indicating the beginning of an upward reversal in a downtrend.
These labels provide traders with immediate insight into the market structure and recent price behavior.
Customizable Visual Settings
Offers various customization options:
• Adjust pivot sensitivity via left/right pivot inputs.
• Toggle pivot labels on or off.
• Enable background color changes to reflect bullish or bearish trends.
• Choose preferred colors for bullish (e.g., green) and bearish (e.g., red) signals.
█ UNDERLYING METHODOLOGY & CALCULATIONS
Fractal Pivot Calculation
The script employs a sliding window technique using configurable left and right parameters to identify local highs and lows. Detected pivot values are sanitized to ensure consistency in subsequent calculations.
Dynamic Line Plotting
When a new pivot is detected, a corresponding line is drawn from the pivot point. This line extends until the price breaks the level, at which point it is reset. This method provides a continuous reference for support and resistance.
Trend Breakout Identification
By continuously monitoring price interactions with the pivot lines, the indicator identifies breakouts. A price crossover above a resistance line suggests a bullish breakout, while a crossunder below a support line indicates a bearish shift. The current trend is updated accordingly.
Pivot Label Assignment
The system compares the current pivot with the previous one to determine if the move represents a higher high, lower high, higher low, or lower low. This classification helps traders understand the underlying market momentum.
█ HOW TO USE THE INDICATOR
1 — Apply the Indicator
• Add the Fractal Breakout Trend Following System to your chart to begin visualizing dynamic pivot points and breakout signals.
2 — Adjust Settings for Your Market
• Pivot Detection – Configure the left and right pivot lengths for both highs and lows to suit your desired sensitivity:
- Use shorter lengths for more responsive signals in fast-moving markets.
- Use longer lengths to filter out minor fluctuations in volatile conditions.
• Visual Customization – Toggle the display of pivot labels and background color changes. Select your preferred colors for bullish and bearish trends.
3 — Interpret the Signals
• Support & Resistance Lines – Observe the dynamically drawn lines that represent key pivot levels.
• Pivot Labels – Look for labels like "HH", "LH", "LL", and "HL" to quickly assess market structure and trend behavior.
• Trend Signals – Watch for price crossovers and corresponding background color shifts to gauge bullish or bearish breakouts.
4 — Integrate with Your Trading Strategy
• Use the identified pivot points as potential support and resistance levels.
• Combine breakout signals with other technical indicators for comprehensive trade confirmation.
• Adjust the sensitivity settings to tailor the indicator to various instruments and market conditions.
█ CONCLUSION
The Fractal Breakout Trend Following System offers a robust framework for identifying critical fractal pivot points and potential breakout opportunities. With its dynamic line plotting, clear pivot labeling, and customizable visual settings, this indicator equips traders with actionable insights to enhance decision-making and optimize entry and exit strategies.

Fractal Dimension Index The Fractal Dimension Index is a technical indicator that gauges the amount of volatility currently present in the market.
The theory behind this indicator is that a value of 1.5 suggests the market is acting in a completely random fashion. As the market deviates from 1.5, the opportunity for earning profits is increased in proportion to the amount of deviation.
Keep in mind that the indicator does not show the direction of trends ! Although you can try to test it as a trend-following indicator that gives trend-following signals, that isn't the intended use of the indicator.
The Fractal Dimension Index is red when the market is in a trend. And it is blue when there is high volatility. When the Fractal Dimension Index changes its color from red to blue , it means that a trend is finishing. The market becomes erratic and high in volatility when the Fractal Dimension Index is blue . Usually, these "blue periods" do not go on for a long time, they come before a new trend.
So, look for trend-following signals while the Fractal Dimension Index is blue since this indicates high volatility before a potential trend, and avoid trend-following signals when the Fractal Dimension Index is red since this indicates a ranging/non-trending market or a trend that started long ago.
