Fractals with Flexible Visuals and Auto HTFPurpose:
This indicator displays fractals, including significant ones, with enhanced visual
flexibility and new visualization modes.
Functionality:
- Regular Fractals of Current Timeframe: **
Displays standard fractals based on the current chart timeframe.
- Significant Fractals: **
Recognizes significant fractals through a combination of apexes from the current
timeframe and a higher timeframe (HTF).
- Fractal Filtering: **
- Please note that this option makes some fractals dissapear, but someone finds this
to be useful.
- Fractal filtering has been made separate for Regular and Significant fractals.
- HH/LL Labels: **
HH/LL and LH/HL labels are now available separately for Regular and Significant
fractals.
- Automatic HTF Switching for Significant Fractals:
Added automatic HTF thresholds, removing the need to set HTF manually when changing
the chart's timeframe.
- Marker Relocation Modes:
- Mode 0:0
The fractal appears on the bar when it is recognized, not where it forms. This
mode assists traders who want to observe recognition in real-time when developing
strategies with fractals.
- Mode 1:1
The fractal appears on the previous bar when it is recognized, not where it forms.
- Mode 2:2 (General)
The fractal appears two bars back, where it is recognized, not when.
- Other additional Modes for Significant Fractals:
May be good for experimenting with Significant fractals. The first number
indicates bars back for the current timeframe; the second number indicates
bars back for the higher timeframe.
Other modes may assist with additional filtering or be suitable for specific
pairs or timeframes.
- Visual Adjustments:
Added user settings to customize visuals according to preferences.
Acknowledgment:
This indicator's functionality has been refactored from Fractals V9 by Ricardo
Santos (with gratitude to him):
()
'RSFractals' is not used as a name prefix, reflecting that this version lacks the
Zigzag and Pattern functionalities present in 'RSFractals'. If the original author
prefers a different naming convention, they may contact me, and I will gladly make
the adjustment.
ค้นหาในสคริปต์สำหรับ "Fractal"

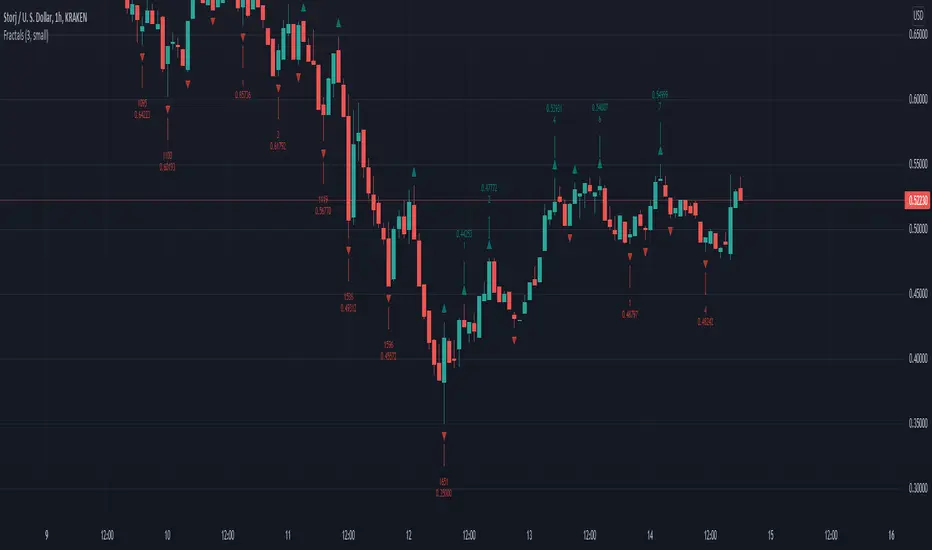
Fractals Trend [BigBeluga]🔵 OVERVIEW
Fractals Trend is a trend-following overlay that leverages fractal swing points to define dynamic support and resistance zones. By storing and averaging recent high and low fractals, it determines trend direction and plots a smooth band that flips depending on market bias—displaying support during uptrends and resistance during downtrends .
🔵 CONCEPTS
Fractal Swings: Fractals are identified using a customizable length. A high fractal forms when the current high is the highest in a range; a low fractal when the current low is the lowest.
Fractal Memory: The indicator keeps a rolling window of recent high and low fractals inside arrays, limited by the user-defined storage quantity.
switch
upperF => FracrtalsUpper.push(high )
lowerF => FracrtalsLower.push(low )
FracrtalsUpper.size() > fCount => FracrtalsUpper.shift()
FracrtalsLower.size() > fCount => FracrtalsLower.shift()
Trend Detection: Price crossing above the average, min/max or median high fractals signals an uptrend; crossing below average, min/max or median low fractals signals a downtrend.
Dynamic Band Plotting: Depending on the trend, the script plots the average of either the upper or lower fractals as a trailing support or resistance line.
Visual Confirmation: Fractal labels appear as triangle markers at highs and lows, providing additional structural context.
🔵 FEATURES
Automatically detects high and low fractals using customizable length.
Stores a defined number of fractals to smooth out noise and reduce false signals.
Flips trend bias dynamically with colored band and smooth transitions.
Plots fractal-based support in bullish trends, resistance in bearish trends.
Triangle markers show real-time fractal highs and lows.
Fully configurable visuals, color themes, and fractal detection logic.
Clean, non-intrusive overlay that works on any market or timeframe.
🔵 HOW TO USE
Use the colored band as a directional filter: green = uptrend (support), orange = downtrend (resistance).
Combine with entry signals or break/retest strategies when price approaches the band.
Use triangle markers to confirm structural swing points.
Adjust Fractals Length to tune sensitivity—shorter values detect quicker shifts, longer values reduce noise.
Change the fractal bands type to adapt trend detection to different market conditions.
Use in conjunction with momentum or volume tools for confluence.
🔵 CONCLUSION
Fractals Trend offers a lightweight, intuitive way to track market bias using price structure alone. Its smart switching logic and clean visuals make it a powerful tool for trend traders seeking structure-based dynamic S/R—without laggy moving averages or overcomplicated signals.

MTF Fractals [RunRox]🔽 MTF Fractals is a powerful indicator designed to visualize fractals from multiple timeframes directly on your chart, highlight liquidity sweeps at these fractal levels, and provide several additional features we’ll cover in detail below.
We created this indicator because we couldn’t find a suitable tool that met our specific needs on TradingView. Therefore, we decided to develop a valuable indicator for the entire TradingView community, combining simplicity and versatility.
⁉️ WHAT IS A FRACTALS?
In trading, a fractal is a technical analysis pattern composed of five consecutive candles, typically highlighting local market turning points. Specifically, a fractal high is formed when a candle’s high is higher than the highs of the two candles on either side, whereas a fractal low occurs when a candle’s low is lower than the lows of the two adjacent candles on both sides.
Traders use fractals as reference points for identifying significant support and resistance levels, potential reversal areas, and liquidity zones within price action analysis. Below is a screenshot illustrating clearly formed fractals on the chart.
📙 FRACTAL FORMATION
Here’s how fractals form depending on your chosen setting (3, 5, 7, or 9):
▶️ 3-bar fractal – forms when the central candle is higher (for highs) or lower (for lows) than one candle on each side.
▶️ 5-bar fractal – forms when the central candle is higher or lower than two candles on both sides.
▶️ 7-bar fractal – forms when the central candle is higher or lower compared to the three candles on each side.
▶️ 9-bar fractal – forms similarly but requires four candles on each side, making the fractal significantly more reliable and robust.
A higher number of bars ensures stronger fractal levels, highlighting more significant potential reversal points on the chart.
Now that we’ve covered the theory behind fractal formation, let’s explore the indicator’s functionality in more detail.
Below, I’ll explain each feature clearly and illustrate how you can effectively utilize this indicator in your trading.
🕐 MULTI-TIMEFRAME FRACTALS
We realized that displaying fractals only from the current timeframe isn’t always convenient, so we’ve introduced Multi-Timeframe Fractals into this indicator.
Now you can easily display fractals from higher timeframes directly on your current chart, providing you with broader market context and clearer trading signals.
Fractals from Current Timeframe – Fractals identified directly on the chart’s current timeframe.
Fractals from Higher Timeframes – Fractals sourced from higher timeframes and displayed clearly on your current chart for enhanced market perspective.
📈 FRACTAL LINES
Since fractals represent areas of high liquidity, we’ve added an option to extend fractal levels horizontally as Fractal Lines across your chart.
This feature allows you to clearly visualize critical liquidity areas from higher timeframes, directly on your current timeframe chart, as demonstrated in the screenshot below.
With this approach, you can clearly visualize significant fractal levels from higher timeframes directly on your current chart - for example, projecting fractals from the 1-hour (1H) timeframe onto a 3-minute (3m) chart. ✅ This helps you easily identify critical liquidity areas and potential reversal zones without the need to switch between multiple timeframes.
💰 LIQUDITY SWEEP (LIQUDITY GRAB)
To enhance your trading experience, we’ve introduced a feature that clearly identifies liquidity sweeps of fractal levels.
A Liquidity Sweep occurs when a candle closes beyond a fractal line, leaving a wick that pierces through it, signaling that liquidity has been collected at this level.
Below, you’ll find two examples illustrating this functionality:
▶️ Fractal lines from the current timeframe
▶️ Fractal lines projected from higher timeframes
The first example illustrates liquidity being swept from fractals on the current timeframe .
Here, the candle clearly closes beyond the fractal line, leaving a wick through it. This indicates a liquidity sweep at the fractal level, visually highlighting a potential reversal or continuation opportunity directly on your chart.
In the second example, fractals from the higher timeframe are projected onto your current chart.
When a candle on your current timeframe closes beyond an HTF fractal line - leaving a wick through this level - the indicator highlights it clearly. This signals to traders a potential reversal zone, indicating that liquidity has been swept, and price may reverse or significantly react from this area.
You can also enable the display of additional labels on the chart. These labels clearly mark liquidity sweeps at fractal levels, making it easier to visually identify potential reversal points directly on your chart.
⚙️ SETTINGS
Below are the indicator settings with detailed explanations for each parameter.
🔷 Bars in Fractal – Number of candles to the right and left required to form a fractal.
🔷 Fractal Timeframe – Select the timeframe from which you want to display fractals on the current chart.
🔷 Max Age, bars – Number of bars during which the fractal will remain active.
🔷 Show Fractal Line – Display or hide fractal lines.
🔷 Line Style – Choose the style of the line displayed on the chart.
🔷 Line Width – Thickness of the fractal line.
🔷 High Fractal – Style and color of bearish fractals.
🔷 Low Fractal – Style and color of bullish fractals.
🔷 Fractal Label Size – Select the size of fractal labels.
🔷 Show Sweep Labels – Option to display labels when a liquidity sweep occurs.
🔷 Label Color – Color and transparency of the area marked on the chart during a sweep.
🔷 Shade Sweep Area – Show or hide the sweep area shading.
🔷 Area Color – Color and transparency settings for the sweep area.
🔶 We’d love to hear your feedback and any suggestions for additional features you’d like to see in this indicator. We’ll be happy to consider your ideas and continue improving the indicator!

Fractal Trail [UAlgo]The Fractal Trail is designed to identify and utilize Williams fractals as dynamic trailing stops. This tool serves traders by marking key fractal points on the chart and leveraging them to create adaptive stop-loss trails, enhancing risk management and trade decision-making.
Williams fractals are pivotal in identifying potential reversals and critical support/resistance levels. By plotting fractals dynamically and providing configurable options, this indicator allows for personalized adjustments based on the trader's strategy.
This script integrates both visual fractal markers and adjustable trailing stops, offering insights into market trends while catering to a wide variety of trading styles and timeframes.
🔶 Key Features
Williams Fractals Identification: The indicator marks Williams Fractals on the chart, which are significant highs and lows within a specified range. These fractals are crucial for identifying potential reversal points in the market.
Dynamic Trailing Stops: The indicator generates dynamic trailing stops based on the identified fractals. These stops adjust automatically as new fractals are formed, providing a responsive and adaptive approach to risk management.
Fractal Range: Users can specify the number of bars to the left and right for analyzing fractals, allowing for flexibility in identifying significant price points.
Trail Buffer Percentage: A percentage-based safety margin can be added between the fractal price and the trailing stop, providing additional control over risk management.
Trail Invalidation Source: Users can choose whether the trailing stop flips based on candle closing prices or the extreme points (high/low) of the candles.
Alerts and Notifications: The indicator provides alerts for when the price crosses the trailing stops, as well as when new Williams Fractals are confirmed. These alerts can be customized to fit the trader's notification preferences.
🔶 Interpreting the Indicator
Fractal Markers: The triangles above and below the bars indicate Williams Fractals. These markers help traders identify potential reversal points in the market.
Trailing Stops: The dynamic trailing stops are plotted as lines on the chart. These lines adjust based on the latest identified fractals, providing a visual representation of potential support and resistance levels.
Fill Colors: The optional fill colors between the trailing stops and the price action help traders quickly identify the current trend and potential pullback zones.
🔶 Disclaimer
Use with Caution: This indicator is provided for educational and informational purposes only and should not be considered as financial advice. Users should exercise caution and perform their own analysis before making trading decisions based on the indicator's signals.
Not Financial Advice: The information provided by this indicator does not constitute financial advice, and the creator (UAlgo) shall not be held responsible for any trading losses incurred as a result of using this indicator.
Backtesting Recommended: Traders are encouraged to backtest the indicator thoroughly on historical data before using it in live trading to assess its performance and suitability for their trading strategies.
Risk Management: Trading involves inherent risks, and users should implement proper risk management strategies, including but not limited to stop-loss orders and position sizing, to mitigate potential losses.
No Guarantees: The accuracy and reliability of the indicator's signals cannot be guaranteed, as they are based on historical price data and past performance may not be indicative of future results.

Fractal Support and Resistance [BigBeluga]🔵 OVERVIEW
The Fractal Support and Resistance indicator automatically identifies high-probability support and resistance zones based on repeated fractal touches. When a defined number of fractal highs or lows cluster around the same price zone, the indicator plots a clean horizontal level and shaded zone, helping traders visualize structurally important areas where price may react.
🔵 CONCEPTS
Fractal Points: Swing highs and lows based on user-defined left and right range (length). A valid fractal forms only when the center candle is higher or lower than its neighbors.
Zone Validation: A level is only confirmed when the price has printed the specified number of fractals (e.g., 3) within a narrow ATR-defined range.
Dynamic Zone Calculation: The plotted level can be based on the average of clustered fractals or on the extreme value (min or max), depending on the user’s choice.
Support/Resistance Zones: Once a zone is validated, a horizontal line and shaded box are drawn and automatically extended into the future until new valid clusters form.
Auto-Clean & Reactivity: Each zone persists until replaced by a new fractal cluster, ensuring the chart remains uncluttered and adaptive.
🔵 FEATURES
Detects swing fractals using adjustable left/right range.
Confirms zones when a defined number of fractals occur near the same price.
Plots horizontal level and shaded box for visual clarity.
Choice between average or min/max logic for level calculation.
Distinct color inputs for support (green) and resistance (orange) zones.
Adaptive auto-extension keeps valid zones projected into the future.
Displays optional triangle markers above/below bars where fractals form.
Clean design optimized for structural S/R analysis.
🔵 HOW TO USE
Use support zones (from low fractals) to look for potential long entries or bounce points .
Use resistance zones (from high fractals) to look for short setups or rejections .
Adjust the Fractals Qty to make zones more or less strict—e.g., 3 for higher reliability, 2 for quicker responsiveness.
Combine with liquidity indicators or break/retest logic to validate zone strength.
Toggle between average and min/max mode to fit your style (average for balance, extremes for aggression).
🔵 CONCLUSION
Fractal Support and Resistance offers a robust way to identify hidden levels that the market respects repeatedly. By requiring multiple fractal confirmations within a zone, it filters out noise and highlights clean structural areas of interest. This tool is ideal for traders who want automatic, adaptive, and reliable S/R levels grounded in raw market structure.

Fractals PivotsWhich trader does not know pivots? There are a lot of varieties of pivots indicators of which some are a default on most trading platforms. So what better way to challenge yourself then to create your own kind of pivots. Let's welcome the idea of Fractal Pivots.
Williams Fractal or fractals is a technical analysis indicator introduced by the famous trader Bill Williams in his book ‘Trading Chaos’. He developed it on the basis of the Chaos Theory and trading psychology. The indicator is centred around the idea that there is repetition in price behaviour and fractals can provide an insight into those repetitive patterns.
How does the indicator turn these into pivot lines?
The user will set a time period in which the script will look for fractals. It will then remember all the fractals that happen during that time period.
Let's say you are trading the hourly chart with a weekly pivot setting like in the chart this script is published on. The script will highling the 1h fractals that are happening. Then the next week it will use these exact fractals from previous week to draw the pivot lines.
Another example here is an 8h chart. Look how it uses the previous week fractals this week.
Let me know if you find a very great fractal length+timeframe setting where the levels really get respected. I would really appreciate that.

Evolution Fractals with IBA standard fractal high has two lower high (or equal high) candles to its left and right.
For standard fractal low fractals this is vice versa.
-But this indicator plots has the option to plot standard fractals only after candle close is confirmed.
So if the current candle is still forming in live markets, only after this candle has fully closed, then the indicator checks if the fractal is valid and then plotted.
You can select this option On or Off
(with the standard fractal indicator there is a fractal plotted, but when this candle high (or low ) is broken again, the fractal disappears. This re-painting of fractals can cause confusion.
-Added an alert functionality.
When setting an alert on your chart, you can select this indicator to alert you upon the forming of a new fractal high or low.
-Added optional Inside Bar function.
When a candle High/Low does not breach the previous candle High/Low, then a different body color can be shown.
This is particular handy to quickly if this high/low is breached, without having to zoom in on the chart.

Williams Fractals with BreaksThis is a Bill Williams fractal indicator with breaks.
I was turned onto fractals and the importance of their breaks by ChaosTrader63.
I know several version of this indicator have been done.
I chose this as a first project because of it's simplicity , but also because of the poor code quality of some other versions I looked at.
This is the first draft that successfully met my three criteria:
* Must identify all fractals, including simultaneous up/down fractals.
* Must identify fractal breaks with a clear indicator.
* Must provide information on how many fractals
For the first bullet, I wanted to provide a more concise modern version than the boolean logic composition I was seeing in other examples.
The later two required tracking the past which was not present in the other versions I looked at.
Code here can be improved for more uses and better integration, but it is functional and elegant enough to use.
Thanks for checking it out.
Jolly Wizard
Fractal Levels Monitor w/ Trade Lines (ChadAnt) v2Small update. Prevents the break candle from getting another signal after the first buy/sell signal detected.
1. Fractal Level Detection
The indicator identifies Fractals, which are simply a series of bars where the center bar has the highest high (Bearish Fractal) or the lowest low (Bullish Fractal) compared to a set number of bars on either side (determined by the "Fractal Period" input, usually 2 to 5 bars).
Bullish Fractal Level (Support): The indicator plots a horizontal line at the lowest low of the most recently formed Bullish Fractal.
Bearish Fractal Level (Resistance): It plots a horizontal line at the highest high of the most recently formed Bearish Fractal.
2. The "Cross Candle" Event
The core idea isn't to trade the fractal itself, but the reaction after the fractal level is broken.
When the price breaks and closes through the established Bullish Level (support) or Bearish Level (resistance), that bar is marked as the Cross Candle.
This Cross Candle's High and Low are saved. This is the "setup" for the trade.
3. The Trade Signal (Entry Trigger)
A trade is only taken when the price breaks the extreme (High or Low) of the Cross Candle.
Buy Signal: The trade is entered long if the price breaks above the High of the Cross Candle.
Sell Signal: The trade is entered short if the price breaks below the Low of the Cross Candle.

Fractal Levels Monitor w/ Trade Lines (ChadAnt)1. Fractal Level Detection
The indicator identifies Fractals, which are simply a series of bars where the center bar has the highest high (Bearish Fractal) or the lowest low (Bullish Fractal) compared to a set number of bars on either side (determined by the "Fractal Period" input, usually 2 to 5 bars).
Bullish Fractal Level (Support): The indicator plots a horizontal line at the lowest low of the most recently formed Bullish Fractal.
Bearish Fractal Level (Resistance): It plots a horizontal line at the highest high of the most recently formed Bearish Fractal.
2. The "Cross Candle" Event
The core idea isn't to trade the fractal itself, but the reaction after the fractal level is broken.
When the price breaks and closes through the established Bullish Level (support) or Bearish Level (resistance), that bar is marked as the Cross Candle.
This Cross Candle's High and Low are saved. This is the "setup" for the trade.
3. The Trade Signal (Entry Trigger)
A trade is only taken when the price breaks the extreme (High or Low) of the Cross Candle.
Buy Signal: The trade is entered long if the price breaks above the High of the Cross Candle.
Sell Signal: The trade is entered short if the price breaks below the Low of the Cross Candle.

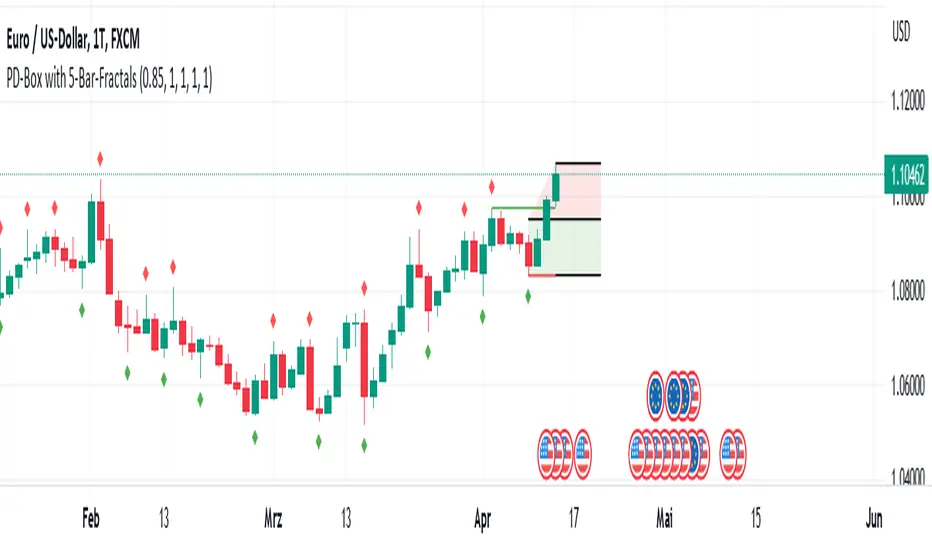
PD-Box with Fractal Points V1 (by Jonny86FXPro)PD-Box with Fractal Points V1 (by Jonny86FXPro)
This indicator has several functions:
Premium/Discount Box: The two most recent fractal highs and lows form a premium/discount box that provides valuable information about potential price movements.
Fractal Breaker Lines: Two fractal breaker lines are integrated for the high and low points to better visually represent the break of a fractal point.
Customizable: The genius of this indicator is that you can customize everything to your own needs. Whether you want to display lines, or change the colors of the box or lines, everything is possible.
Automatic Adjustment: Once a fractal point is broken, the premium discount automatically adjusts to the current price. Once a new fractal point is formed, the box is automatically adjusted again.
HTF Analysis: Use this indicator for your HTF analysis and determine in which direction the price could develop.
Premium Discount Box Information: When the price is in the premium range, there is a higher probability of a sell-off. However, if the price breaks upward, there is a good chance that it will continue to rise. The opposite is true for the discount range.
Power Behind Each Move: It is important how the price hits the fractal point. If there is power behind each move, the chances are very good that it will continue in that direction. If there is no real power behind it, it could be an indication of a trend reversal.
Weak Breaks: In the premium range, a weak upward break could lead to a bearish move, and in the discount range, a weak downward break through the fractal low point could lead to a move in the bullish direction.
As you can see, this powerful indicator has many functions that can help you determine trend direction and potential price movements.
Quick overview of functions:
Designed for higher timeframes such as 4H chart.
Identifies the last two fractal highs and lows to create a premium/discount box.
Includes two fractal breaker lines for the high and low points to better visually represent fractal breaks.
Customizable to fit individual needs, including the ability to show/hide lines and change box/line colors.
Automatically adjusts premium/discount levels to current price when a fractal point is broken.
Can be used for higher timeframe analysis to determine potential price direction.
Premium/discount box provides insight into potential market direction based on price movement within its range.
Fractal break with strong market momentum indicates a higher chance of trend continuation.
Fractal break with weak market momentum may suggest a potential trend reversal.
A powerful indicator that can greatly assist in determining trend direction.
(QUANTLABS) Fractal God Mode: 25-Timeframe Scanner The indicator aggregates data into three distinct metric columns:
1. STRUCT (Market Structure) This analyzes price action relative to Fractal Pivots (Highs and Lows) to determine market direction.
HH (Breakout): Price has closed above the previous Pivot High. (Bullish Structure)
LL (Breakdown): Price has closed below the previous Pivot Low. (Bearish Structure)
TRAPPED: Price is trading between the last Pivot High and Low. This indicates a ranging market where trend trades should be avoided.
2. VELOCITY (Thrust) This measures the specific strength of the current candle on that timeframe.
The Math: It calculates the ratio of the body (Close - Open) relative to the total candle range (High - Low).
The Signal: High positive numbers (Green) indicate buyers are closing near highs. High negative numbers (Red) indicate sellers are dominating the range.
3. QUALITY (Efficiency Ratio) This acts as a "Noise Filter." It determines if the trend is moving in a straight line or whipping back and forth.
The Math: It divides the Net Price Movement (Distance from 5 bars ago) by the Total Path Traveled (Sum of the ranges of the last 5 bars).
PRISTINE (Values > 0.6): The market is moving efficiently in one direction.
CHOPPY (Values < 0.4): The market is volatile and non-directional (High Noise).
1. The Matrix (Dashboard) Located in the bottom right, this table gives you an instant read on Short-Term (3m-9m), Medium-Term (10m-45m), and Long-Term (1H-Daily) trends.
2. Coherence Flow At the bottom of the table, the script sums up the structural score of all 25 timeframes.
COHERENT BULL: When the Short, Medium, and Long terms align green.
COHERENT BEAR: When the Short, Medium, and Long terms align red.
3. God Mode (Global S/R) The indicator can plot Support and Resistance levels from higher timeframes onto your current chart. For example, while trading the 5m chart, you can see the 4H and Daily pivot levels plotted automatically as dotted lines, ensuring you never trade blindly into a higher-timeframe wall.
Trend Following: Wait for the "Coherent Bull/Bear" signal at the bottom of the dashboard. This confirms that momentum is aligned from the 3m chart up to the Daily.
Scalping: Focus on the Quality column. Only take trades when the Quality is "CLEAN" or "PRISTINE." Avoid entries when the dashboard warns of "High Noise" (Choppy).
Risk Management: If the dashboard shows "TRAPPED" on the Long Term (1H+), reduce position size or wait for a breakout.
Pivot Lookback: Adjusts the sensitivity of the Fractal Structure (Default: 5).
Show Fractal DNA Matrix: Toggles the dashboard table.
Show ALL Timeframe S/R: Enables "God Mode" to see supports/resistances from all 25 timeframes (Heavy visual processing, use carefully).

[-_-] 2D FractalsThe sole purpose of this script is to demonstrate what's possible to make with Pinescript, namely to display images (2D Fractals in this case).
The script consists of two functions: one that generates the values of a fractal and one that displays them (utilising table) with each cell being used as a "pixel". We can control the "resolution" of image, as well as choose one of three fractal types.

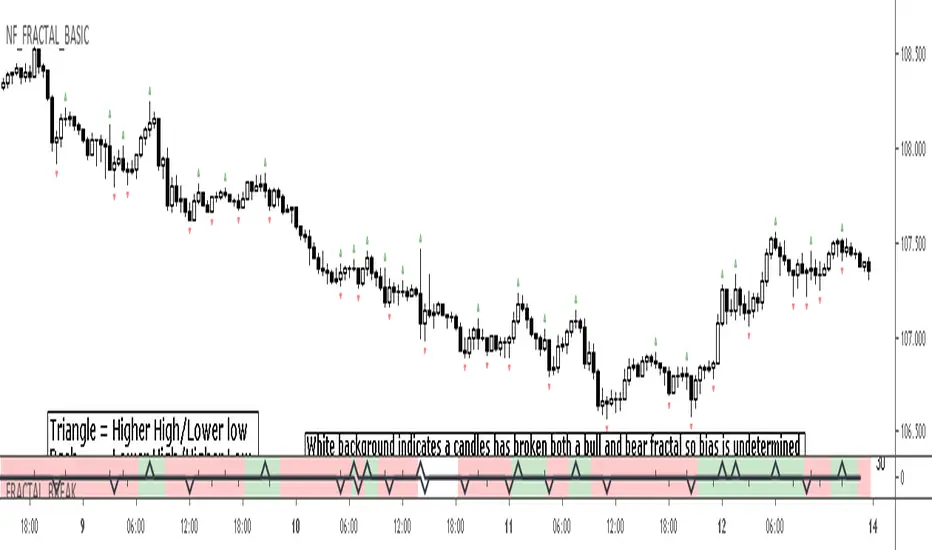
FRACTAL_BREAK - fractal trend analysis
Highlights areas on the chart where Higher Highs or Lower Lows are being created in terms of fractals
Ability to highlight breaks of highs and lows
Configurable fractal break strictness - (candle close vs candle high/low)
The large triangles = a higher high or lower low has been created
The small dashes = a lower high or lower low has been created
Alerts available for fractal break events
MTF Fractal LevelsMTF Fractal Levels is a fractal-based indicator designed to highlight key price levels and provide timely alerts when price reaches those levels.
The indicator can display fractals from the current timeframe as well as from a higher timeframe selected in the settings.
When a higher timeframe is selected, its fractal levels are correctly projected onto all lower timeframes, allowing higher-timeframe levels to be used as context for entries on lower timeframes.
The Fractal Strength parameter allows filtering of fractal formation by controlling how significant a price extremum must be to be considered a valid fractal.
Levels are displayed as horizontal zones/lines with flexible visual style settings.
The indicator supports intra bar alerts that trigger at the exact moment price touches a fractal level, without waiting for the candle to close.

Fractals (Expo)
Fractals (Expo) make use of fractals to identify trends and reversals. The indicator is designed to adapt smoothly and quickly to significant price moves in order to identify trend reversals as well as filtering out noise in an established trend. The indicator is simple to use and understand therefore valuable to all trading styles.
The user has the ability to enable a custom input source which gives the user great flexibility and full control over what the calculations should be based on. The default input source is fractals from the swing points of the market.
Real-Time Trend Alerts
No Repainting
Works on any market and in any timeframe
HOW TO USE
Use the indicator to gain insights into trends and trend reversals.
Identify Trends
Identify Trend reversals
Use it as a Trend filter
INDICATOR IN ACTION
Daily Chart
I hope you find this indicator useful , and please comment or contact me if you like the script or have any questions/suggestions for future improvements. Thanks!
I will continually work on this indicator, so please share your experience and feedback as it will enable me to make even better improvements. Thanks to everyone that has already contacted me regarding my scripts. Your feedback is valuable for future developments!
-----------------
Disclaimer
Copyright by Zeiierman.
The information contained in my scripts/indicators/ideas does not constitute financial advice or a solicitation to buy or sell any securities of any type. I will not accept liability for any loss or damage, including without limitation any loss of profit, which may arise directly or indirectly from the use of or reliance on such information.
All investments involve risk, and the past performance of a security, industry, sector, market, financial product, trading strategy, or individual’s trading does not guarantee future results or returns. Investors are fully responsible for any investment decisions they make. Such decisions should be based solely on an evaluation of their financial circumstances, investment objectives, risk tolerance, and liquidity needs.
My scripts/indicators/strategies/ideas are only for educational purposes!
ACCESS THE INDICATOR
• Contact me on TradingView or use the links below

Acc/Dist. Cloud with Fractal Deviation Bands by @XeL_ArjonaACCUMULATION / DISTRIBUTION CLOUD with MORPHIC DEVIATION BANDS
Ver. 2.0.beta.23:08:2015
by Ricardo M. Arjona @XeL_Arjona
DISCLAIMER
The Following indicator/code IS NOT intended to be a formal investment advice or recommendation by the author, nor should be construed as such. Users will be fully responsible by their use regarding their own trading vehicles/assets.
The embedded code and ideas within this work are FREELY AND PUBLICLY available on the Web for NON LUCRATIVE ACTIVITIES and must remain as is.
Pine Script code MOD's and adaptations by @XeL_Arjona with special mention in regard of:
Buy (Bull) and Sell (Bear) "Power Balance Algorithm by Vadim Gimelfarb published at Stocks & Commodities V. 21:10 (68-72).
Custom Weighting Coefficient for Exponential Moving Average (nEMA) adaptation work by @XeL_Arjona with contribution help from @RicardoSantos at TradingView @pinescript chat room.
Morphic Numbers (PHI & Plastic) Pine Script adaptation from it's algebraic generation formulas by @XeL_Arjona
Fractal Deviation Bands idea by @XeL_Arjona
CHANGE LOG:
ACCUMULATION / DISTRIBUTION CLOUD: I decided to change it's name from the Buy to Sell Pressure. The code is essentially the same as older versions and they are the center core (VORTEX?) of all derived New stuff which are:
MORPHIC NUMBERS: The "Golden Ratio" expressed by the result of the constant "PHI" and the newer and same in characteristics "Plastic Number" expressed as "PN". For more information about this regard take a look at: HERE!
CUSTOM(K) EXPONENTIAL MOVING AVERAGE: Some code has cleaned from last version to include as custom function the nEMA , which use an additional input (K) to customise the way the "exponentially" is weighted from the custom array. For the purpose of this indicator, I implement a volatility algorithm using the Average True Range of last 9 periods multiplied by the morphic number used in the fractal study. (Golden Ratio as default) The result is very similar in response to classic EMA but tend to accelerate or decelerate much more responsive with wider bars presented in trending average.
FRACTAL DEVIATION BANDS: The main idea is based on the so useful Standard Deviation process to create Bands in favor of a multiplier (As John Bollinger used in it's own bands) from a custom array, in which for this case is the "Volume Pressure Moving Average" as the main Vortex for the "Fractallitly", so then apply as many "Child bands" using the older one as the new calculation array using the same morphic constant as multiplier (Like Fibonacci but with other approach rather than %ratios). Results are AWSOME! Market tend to accelerate or decelerate their Trend in favor of a Fractal approach. This bands try to catch them, so please experiment and feedback me your own observations.
EXTERNAL TICKER FOR VOLUME DATA: I Added a way to input volume data for this kind of study from external tickers. This is just a quicky-hack given that currently TradingView is not adding Volume to their Indexes so; maybe this is temporary by now. It seems that this part of the code is conflicting with intraday timeframes, so You are advised.
This CODE is versioned as BETA FOR TESTING PROPOSES. By now TradingView Admins are changing lot's of things internally, so maybe this could conflict with correct rendering of this study with special tickers or timeframes. I will try to code by itself just the core parts of this study in order to use them at discretion in other areas. ALL NEW IDEAS OR MODIFICATIONS to these indicator(s) are Welcome in favor to deploy a better and more accurate readings. I will be very glad to be notified at Twitter or TradingView accounts at: @XeL_Arjona

Fractal Fade Pro IndicatorA revolutionary contrarian trading indicator that applies chaos theory, fractal mathematics, and market entropy to generate high-probability reverse signals. This indicator fades traditional technical signals, providing BUY signals when conventional indicators say SELL, and SELL signals when they say BUY.
Full Description:
Most traders follow the herd. QFCI does the opposite. It identifies when conventional technical analysis is about to fail by detecting mathematical patterns of exhaustion in market structure.
How It Works (Technical Overview):
The indicator combines three sophisticated mathematical approaches:
Fractal Dimension Analysis: Measures the "roughness" of price movements using fractal mathematics
Market Entropy Calculation: Quantifies the randomness and disorder in price returns using information theory
Phase Space Reconstruction: Analyzes price evolution in multi-dimensional state space from chaos theory
Signal Generation Process:
Step 1: Market Regime Detection
Chaotic Regime: High fractal complexity + rising entropy (avoid trading)
Trending Regime: Low fractal complexity + high phase space distance (fade breakouts)
Mean-Reverting Regime: Very low fractal complexity (fade extremes)
Step 2: Reverse Signal Logic
When traditional indicators would give:
BUY signal (breakout, oversold bounce, volatility spike) → QFCI shows SELL
SELL signal (breakdown, overbought rejection, volatility crash) → QFCI shows BUY
Step 3: Smart Signal Filtering
No consecutive same-direction signals
Adjustable minimum bars between signals
Multiple confirmation layers required
Unique Features:
1. Mathematical Innovation:
Original fractal dimension algorithm (not standard indicators)
Market entropy calculation from information theory
Phase space reconstruction from chaos theory
Multi-regime adaptive logic
2. Trading Psychology Advantage:
Contrarian by design - profits from market overreactions
Fades retail trader mistakes - enters when others are exiting
Reduces overtrading - strict signal frequency controls
3. Clean Visual Interface:
Only BUY/SELL labels - no chart clutter
Clear directional arrows - immediate signal recognition
Built-in alerts - never miss a trade
Recommended Settings:
Default (Balanced Approach):
Fractal Depth: 20
Entropy Period: 200
Min Bars Between Signals: 100
Aggressive Trading:
Fractal Depth: 10-15
Entropy Period: 100-150
Min Bars Between Signals: 50-75
Conservative Trading:
Fractal Depth: 30-40
Entropy Period: 300-400
Min Bars Between Signals: 150-200
Optimal Timeframes:
Primary: Daily, Weekly (best performance)
Secondary: 4-Hour, 12-Hour
Can work on: 1-Hour (with adjusted parameters)
How to Use:
For Beginners:
Apply indicator to chart
Use default settings
Wait for BUY/SELL labels
Enter on next candle open
Use 2:1 risk/reward ratio
Always use stop losses
For Advanced Traders:
Adjust parameters for your trading style
Combine with support/resistance levels
Use volume confirmation
Scale in/out of positions
Track performance by regime
Risk Management Guidelines:
Position Sizing:
Conservative: 1-2% risk per trade
Moderate: 2-3% risk per trade
Aggressive: 3-5% risk per trade (not recommended)
Stop Loss Placement:
BUY signals: Below recent swing low or -2x ATR
SELL signals: Above recent swing high or +2x ATR
Take Profit Targets:
Primary: 2x risk (minimum)
Secondary: Previous support/resistance
Tertiary: Trailing stops after 1.5x risk
IMPORTANT RISK DISCLOSURE
This indicator is for educational and informational purposes only. It is not financial advice. Past performance does not guarantee future results. Trading involves substantial risk of loss and is not suitable for every investor. The risk of loss in trading can be substantial. You should therefore carefully consider whether such trading is suitable for you in light of your financial condition.

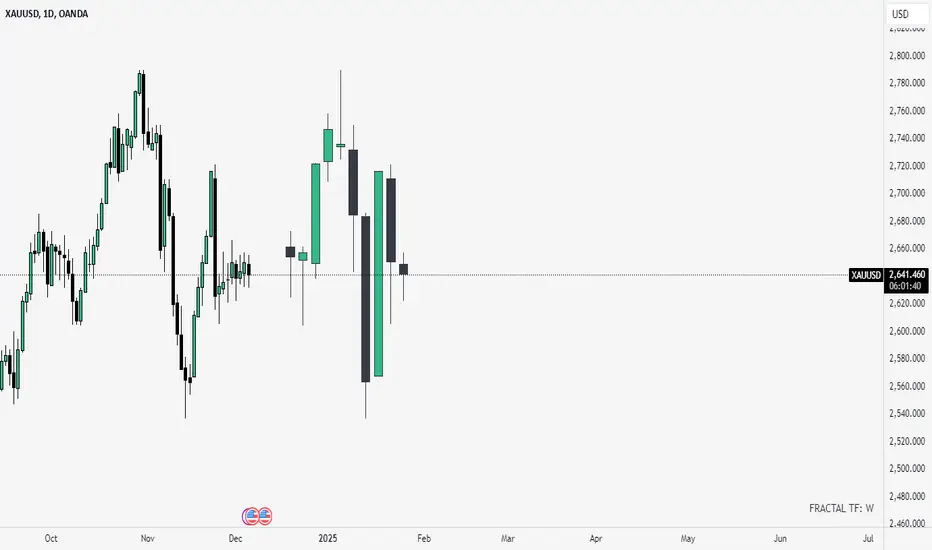
Fractal candles by RadonirinaThis script is used for HTF fractality.
Advantages
User can focus on LTF when he/she knows the biais
User can see what happens on HTF without switching between TF
Here the concept :
User can switch between TF, the script will show the HTF (<15m it uses 15min HTF, <1H it uses 1H, < 1D it uses Daily, < 1W it uses Weekly, Weekly and more the script is disabled)
User can choose a fixed TF for the fractality, this TF will be use for all TF
User can set up the candles to plot
Here are some screenshot
1min x 15min
15min x 1H
1h x 4H
1D x 1W
Williams Fractals / Goldilocks [NPR21]📊 Williams Fractals — Goldilocks
Description
Williams Fractals — Goldilocks highlights confirmed swing highs and lows using a refined Williams Fractals approach that balances signal frequency and clarity. BUY and SELL labels mark structurally important pivot points while avoiding chart clutter. The Periods (n) setting controls how often signals appear—lower values produce more signals, higher values filter noise. Signals are non-repainting and work on any instrument and any timeframe. Best used as a market structure and confirmation tool.
🔧 How to Use (Quick Guide)
BUY labels = confirmed swing lows (potential support / pullback areas)
SELL labels = confirmed swing highs (potential resistance / exhaustion areas)
Use for structure and confirmation, not as a standalone entry system
Combine with trend direction, key levels, VWAP/EMAs, volume, or momentum
⏱️ Recommended Periods by Timeframe
The Periods (n) setting determines how many and how often labels print.
1m–3m (Scalping): n = 2
More frequent signals; captures short-term swings.
5m–15m (Intraday): n = 8-9
Balanced sensitivity; filters minor noise.
30m–1h+ (HTF/Swing): n = 15-21
Fewer, stronger pivots; highlights major structure.
Rule of thumb: Lower timeframe → lower n. Higher timeframe → higher n.
🌍 Markets & Timeframes
Not futures-only. Works well on stocks, ETFs, forex, crypto, indices, and any timeframe. Adjust n to match the market’s pace.

Correct Fractal Swings by CRYPTOFORThis indicator adjusts and enhances the normal 3-fractal swing. The author of this definition, uncle_travis, takes into account swings with the absorption of 3 candles and uses them as structure points.

Varma Fractal TEMA + Strong Move Candle DetectorIts a combined Indicator built on the concepts of Fractals, EMAs, RSI, ATR and Awesome Oscillators. A fractal is a small, repeating price pattern composed of five price bars or candlesticks that helps identify potential turning points in a market trend. It acts as a technical indicator to highlight support and resistance levels, signifying potential reversals. Specifically, a bullish fractal has the middle bar as the lowest low (a "V" shape), signaling a possible uptrend reversal, while a bearish fractal has the middle bar as the highest high (an inverted "V"), indicating a potential downtrend reversal. EMA tracks an asset's price over a specific period by placing greater weight on recent data points, making it more responsive to current market changes than a Simple Moving Average (SMA). Traders use EMAs to identify bullish and bearish trends, spot potential entry and exit points, and capture market momentum and price shifts quickly, especially in shorter time frames. RSI (Relative Strength Index) is a momentum oscillator used in trading to measure the speed and change of price movements, indicating whether a security is overbought (likely to fall) or oversold (likely to rise). Developed by J. Welles Wilder Jr., the RSI oscillates between 0 and 100, with values above 70 generally signaling an overbought condition and values below 30 indicating an oversold condition. Traders use these signals to identify potential trend reversals and time their entry and exit points more effectively.

Fractal BreakoutThis indicator prints channels based on Williams Fractals creating an upper and a lower channel. Breakouts of these channels are marked as buy or sell signal including the respective alerts. Furthermore the indicator includes a Moving Average which can be toggled on to be used as a trendfilter (buy above, sell below).
