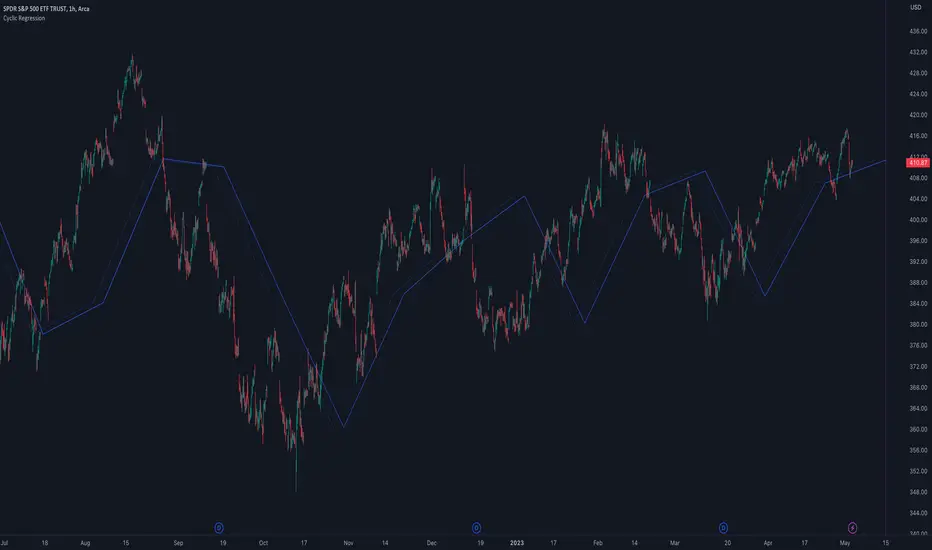
Gann Master System - CompleteGann Master Trading System - Multi-Factor Confluence Indicator
Advanced implementation of W.D. Gann methodology combining Square of 9 calculations, Octave Theory projections, Time Cycle analysis, and Planetary Aspect windows into a systematic confluence-based trading system.
Key Features:
Square of 9 geometric price levels (180°, 270°, 360° rotations)
Octave Theory targets with harmonic divisions (0.5x, 1x, 2x, 4x)
Time cycle tracking with sub-cycle analysis
10 configurable planetary aspect windows (manual input from ephemeris)
Automatic swing pivot detection
Multi-factor confluence scoring (0-20+ points)
Visual signals: Blue (score 3-6), Red (7-10), Purple (11+)
Real-time info panel with factor status
Built-in alerts for high-probability setups
How It Works:
System calculates multiple Gann factors simultaneously and awards points when price aligns with key levels. Higher confluence scores indicate stronger probability of reversal. Combines objective mathematics with astronomical timing for systematic edge.
Best For: Daily/4H charts on Gold, Forex majors, Indices
Signal Frequency: 2-4 high-quality setups per month (score 11+)
Recommended Min Score: 7 for trading, 11+ for highest probability
Setup Required: Configure Square of 9 pivot, Octave base range, Time cycle start date, and planetary aspect dates. See full documentation for detailed guide.
ค้นหาในสคริปต์สำหรับ "Cycle"
BTC Power-Law Decay Channel Oscillator (0–100)🟠 BTC Power-Law Decay Channel Oscillator (0–100)
This indicator calculates Bitcoin’s position inside its long-term power-law decay channel and normalizes it into an easy-to-read 0–100 oscillator.
🔎 Concept
Bitcoin’s long-term price trajectory can be modeled by a log-log power-law channel.
A baseline is fitted, then an upper band (excess/euphoria) and a lower band (capitulation/fear).
The oscillator shows where the current price sits between those bands:
0 = near the lower band (historical bottoms)
100 = near the upper band (historical tops)
📊 How to Read
Oscillator > 80 → euphoric excess, often cycle tops
Oscillator < 20 → capitulation, often cycle bottoms
Works best on weekly or bi-weekly timeframes.
⚙️ Adjustable Parameters
Anchor date: starting point for the power-law fit (default: 2011).
Smoothing days: moving average applied to log-price (default: 365 days).
Upper / Lower multipliers: scale the bands to align with historical highs and lows.
✅ Best Use
Combine with other cycle signals (dominance ratios, macro indicators, sentiment).
Designed for long-term cycle analysis, not intraday trading.
Fractal Wave MarkerFractal Wave Marker is an indicator that processes relative extremes of fluctuating prices within 2 periodical aspects. The special labeling system detects and visually marks multi-scale turning points, letting you visualize fractal echoes within unfolding cycles dynamically.
What This Indicator Does
Identifies major and minor swing highs/lows based on adjustable period.
Uses Phi in power exponent to compute a higher-degree swing filter.
Labels of higher degree appear only after confirmed base swings — no phantom levels, no hindsight bias. What you see is what the market has validated.
Swing points unfold in a structured, alternating rhythm . No two consecutive pivots share the same hierarchical degree!
Inspired by the Fractal Market Hypothesis, this script visualizes the principle that market behavior repeats across time scales, revealing structured narrative of "random walk". This inherent sequencing ensures fractal consistency across timeframes. "Fractal echoes" demonstrate how smaller price swings can proportionally mirror larger ones in both structure and timing, allowing traders to anticipate movements by recursive patterns. Cycle Transitions highlight critical inflection points where minor pivots flip polarity such as a series of lower highs progress into higher highs—signaling the birth of a new macro trend. A dense dense clusters of swing points can indicate Liquidity Zones, acting as footprints of institutional accumulation or distribution where price action validates supply and demand imbalances.
Visualization of nested cycles within macro trend anchors - a main feature specifically designed for the chartists who prioritize working with complex wave oscillations their analysis.
111D SMA / (350D SMA * 2)Indicator: Pi Cycle Ratio
This custom technical indicator calculates a ratio between two moving averages that are used for the PI Cycle Top indicator. The PI Cycle Top indicator triggers when the 111-day simple moving average (111D SMA) crosses up with the 350-day simple moving average (350D SMA *2).
The line value is ratio is calculated as:
Line Value = 111DSMA / (350D SMA × 2)
When the 111D SMA crosses with the 350D SMA triggering the PI Cycle Top, the value of the ratio between the two lines is 1.
This visualizes the ratio between the two moving averages into a single line. This indicator can be used for technical analysis for historical and future moves.
The Investment Clock Orbital GraphThe Investment Clock Orbital Graph is an advanced visualization tool designed to help traders and investors track economic cycles using a dynamic scatter plot of GDP growth vs. CPI inflation rates.
This indicator is a fusion of two powerful TradingView indicators:
LuxAlgo ’s Relative Strength Scatter Plot – A robust scatter plot for tracking relative strength.
The Investment Clock Indicator – A cycle-based approach to market rotation. This indicator contains more information regarding The Investment Clock.
By combining these approaches, the Investment Clock Orbital Graph enables traders to visualize economic momentum and inflationary trends in a unique, orbital-style scatter plot.
Key Features & Improvements
Orbital Graph Representation – Displays GDP growth and CPI inflation as a dynamic, evolving scatter plot, showing how the economy moves through different phases.
Quadrant-Based Market Regimes – Identifies four key economic phases:
1)🔥 Overheating (High Growth, High Inflation)
2)📉 Stagflation (Low Growth, High Inflation)
3)🤒 Recovery (High Growth, Low Inflation)
4)🎈 Reflation (Low Growth, Low Inflation)
Data-Driven Analysis – Utilizes FRED (Federal Reserve Economic Data) for accurate real-world GDP & CPI data.
Trailing Path of Economic Evolution – Tracks historical economic cycles over time to show momentum and cyclical movements.
Customizable Parameters – Set sustainable GDP growth and inflation thresholds, adjust trail length, and fine-tune scatter plot resolution.
Auto-Labeled Quadrants & Revised Accurate Market Guidance – Each quadrant includes newly updated tooltips and annotations (like ETF suggestions) to help traders make informed decisions.
Live Macro Forecasting Tool – Helps traders anticipate future market conditions, rate hikes/cuts, and sector rotations.
How to Use for Trading Decisions
The Investment Clock Orbital Graph helps traders and macro investors by identifying market phases and providing insights into asset class performance during different economic conditions.
📌 Step 1: Identify the Current Quadrant
Locate the most recent point on the orbital graph to see if the economy is in Overheating, Stagflation, Recovery, or Reflation.
📌 Step 2: Forecast Market Trends
The trajectory of the points can predict upcoming economic shifts:
Overheating → Stagflation ➡️ Expect economic slowdowns, bearish stock markets.
Stagflation → Reflation ➡️ Interest rate cuts likely, bonds and defensive stocks perform well.
Reflation → Recovery ➡️ Risk-on rally, technology and cyclicals perform best.
Recovery → Overheating ➡️ Commodities surge, inflation rises, and central banks intervene.
📌 Step 3: Align Trading & Investing Strategies
🔥 Overheating – Favor commodities & energy (Oil, Industrial Stocks, Materials).
📉 Stagflation – Favor defensive assets (Cash, Utilities, Healthcare).
🤒 Recovery – Favor growth stocks (Technology, Consumer Discretionary).
🎈 Reflation – Favor bonds, value stocks, and financials.
📌 Step 4: Monitor Trends Over Time
The indicator visualizes economic movement over multiple months, allowing traders to confirm long-term trends vs. short-term noise.
The Investment Clock Orbital Graph is an essential macro trading tool, providing a real-time visualization of economic conditions. By tracking GDP growth vs. CPI inflation, traders and investors can align their portfolios with major macroeconomic shifts, predict sector rotations, and anticipate central bank policy changes.
Bitcoin Reversal PredictorOverview
This indicator displays two lines that, when they cross, signal a potential reversal in Bitcoin's price trend. Historically, the high or low of a bull market cycle often occurs near the moment these lines intersect. The lines consist of an Exponential Moving Average (EMA) and a logarithmic regression line fitted to all of Bitcoin's historical data.
Inspiration
The inspiration for this indicator came from the PI Cycle Top indicator, which has accurately predicted past bull market peaks. However, I believe the PI Cycle Top indicator may not be as effective in the future. In that indicator, two lines cross to mark the top, but the extent of the cross has been diminishing over time. This was especially noticeable in the 2021 cycle, where the lines barely crossed. Because of this, I created a new indicator that I think will continue to provide reliable reversal signals in the future.
How It Works
The logarithmic regression line is fitted to the Bitcoin (BTCUSD) chart using two key factors: the 'a' factor (slope) and the 'b' factor (intercept). This results in a steadily decreasing line. The EMA oscillates above and below this regression line. Each time the two lines cross, a vertical colored bar appears, indicating that Bitcoin's price momentum is likely to reverse.
Use Cases
- Price Bottoming:
Bitcoin often bottoms out when the EMA crosses below the logarithmic regression line.
- Price Topping:
In contrast, Bitcoin often peaks when the EMA crosses above the logarithmic regression line.
- Profitable Strategy:
Trading at the crossovers of these lines can be a profitable strategy, as these moments often signal significant price reversals.
Detrended Price Oscillator [NexusSignals]Detrended Price Oscillator (DPO) is a detrended price oscillator, used in technical analysis, strips out price trends in an effort to estimate the length of price cycles from peak to peak or trough to trough.
DPO is not a momentum indicator, instead highlights peaks and troughs in price, which are used to estimate buy and sell points in line with the historical cycle. (cf. to investopedia)
DPO indicator made by NexusSignals components :
a filled area that allow users to see easy the trend of an asset;
a sma moving average on chart (default length is 20)
a 20 sma on oscillator, both ma's are color coded to show uptrend / downtrend
a donchian channel applied to the dpo to show breakouts, breakdowns and resistances/support, reversals
few alerts for price crossing above ma, cross above the 0 dpo line, and for cross above and below the donchian channels top and bottom
How you can use DPO indicator ?
The detrended price oscillator (DPO) can be used for measuring the distance between peaks and troughs in the indicator that may help traders to make future decisions as they can locate the most recent trough and determine when the next one may occur in the meassured distance on oscillator between peaks and troughs.
You can use the indicator to find the potential price reversals, for example when the price of an asset is in a bearish trend and the dpo is bouncing from the donchian channel bottom, that may be a potential swing low for that asset, same thing in a bullish trend when the dpo rejecting at top of donchian channel may be a trend reversal, a pullback or swing high.
When DPO is above the 0 trend is in an uptrend and when dpo is below the zero the asset is possible to move into a downtrend.
Also crosses of DPO above and below the DPO moving average may signalising a trend change.
Fourier For Loop [BackQuant]Fourier For Loop
PLEASE Read the following, as understanding an indicator's functionality is essential before integrating it into a trading strategy. Knowing the core logic behind each tool allows for a sound and strategic approach to trading.
Introducing BackQuant's Fourier For Loop (FFL) — a cutting-edge trading indicator that combines Fourier transforms with a for-loop scoring mechanism. This innovative approach leverages mathematical precision to extract trends and reversals in the market, helping traders make informed decisions. Let's break down the components, rationale, and potential use-cases of this indicator.
Understanding Fourier Transform in Trading
The Fourier Transform decomposes price movements into their frequency components, allowing for a detailed analysis of cyclical behavior in the market. By transforming the price data from the time domain into the frequency domain, this indicator identifies underlying patterns that traditional methods may overlook.
In this script, Fourier transforms are applied to the specified calculation source (defaulted to HLC3). The transformation yields magnitude values that can be used to score market movements over a defined range. This scoring process helps uncover long and short signals based on relative strength and trend direction.
Why Use Fourier Transforms?
Fourier Transforms excel in identifying recurring cycles and smoothing noisy data, making them ideal for fast-paced markets where price movements may be erratic. They also provide a unique perspective on market volatility, offering traders additional insights beyond standard indicators.
Calculation Logic: For-Loop Scoring Mechanism
The For Loop Scoring mechanism compares the magnitude of each transformed point in the series, summing the results to generate a score. This score forms the backbone of the signal generation system.
Long Signals: Generated when the score surpasses the defined long threshold (default set at 40). This indicates a strong bullish trend, signaling potential upward momentum.
Short Signals: Triggered when the score crosses under the short threshold (default set at -10). This suggests a bearish trend or potential downside risk.'
Thresholds & Customization
The indicator offers customizable settings to fit various trading styles:
Calculation Periods: Control how many periods the Fourier transform covers.
Long/Short Thresholds: Adjust the sensitivity of the signals to match different timeframes or risk preferences.
Visualization Options: Traders can visualize the thresholds, change the color of bars based on trend direction, and even color the background for enhanced clarity.
Trading Applications
This Fourier For Loop indicator is designed to be versatile across various market conditions and timeframes. Some of its key use-cases include:
Cycle Detection: Fourier transforms help identify recurring patterns or cycles, giving traders a head-start on market direction.
Trend Following: The for-loop scoring system helps confirm the strength of trends, allowing traders to enter positions with greater confidence.
Risk Management: With clearly defined long and short signals, traders can manage their positions effectively, minimizing exposure to false signals.
Final Note
Incorporating this indicator into your trading strategy adds a layer of mathematical precision to traditional technical analysis. Be sure to adjust the calculation start/end points and thresholds to match your specific trading style, and remember that no indicator guarantees success. Always backtest thoroughly and integrate the Fourier For Loop into a balanced trading system.
Thus following all of the key points here are some sample backtests on the 1D Chart
Disclaimer: Backtests are based off past results, and are not indicative of the future .
INDEX:BTCUSD
INDEX:ETHUSD
BINANCE:SOLUSD
Vertical Timelines Pro |MC|Vertical Timelines Pro |MC|
Credits go to lucemanb for the great work 👍
This indicator has been further developed and enhanced with additional features.
Vertical Timelines Pro is a customizable time-based indicator designed to mark important intraday timestamps directly on the chart. It helps traders visualize recurring market moments such as True Day Open, session opens, macro events, or personal timing models with precise vertical reference lines.
The indicator allows you to define multiple custom times, each with its own color and on/off toggle. All timestamps are calculated using a selectable timezone, ensuring consistent and accurate alignment across different markets and chart settings.
Optional labels can be displayed at each timeline to clearly identify the corresponding time. To keep the chart clean and readable, the number of visible labels can be limited retroactively. Due to Pine Script limitations, this setting only affects labels—plotted lines are not impacted.
💎 Key Features 💎
Multiple configurable intraday time markers
Timezone-aware calculations
Individual color and visibility control per line
Optional time labels with customizable size and colors
Historical label limiting to reduce chart clutter
Lightweight and suitable for all intraday timeframes
This indicator is ideal for traders who rely on time-based market behavior, session structure, or repeatable intraday cycles.
Happy Trading!
Macro Opportunity Drawdown Engine (MODE)Strategic Drawdown Classification for Macro-Cycle Accumulation. MODE identifies market drawdowns that historically align with discounted accumulation zones. Instead of treating pullbacks as risk events, it classifies them as structural opportunity phases based on distance from prior cycle highs.
The indicator continuously measures drawdown severity and labels current conditions as:
- Correction: –10% to –19%
- Bear Market: –20% to –29%
- Major Crash Opportunity: –30% or deeper
These levels are displayed directly on the chart, along with a live drawdown reading from the most recent peak.
MODE is built for long-term, macro-minded investors who view volatility as an advantage. It helps identify when the market has entered deep value phases often associated with stronger forward returns, liquidity resets, and cycle bottoms.
In short:
MODE turns market stress into clear signals of potential opportunity, providing a disciplined, data-driven framework for accumulation during corrections, bear markets, and crashes.
Index Top 5 Heavyweight Analyzer## 🎯 Overview
This advanced Pine Script indicator applies the **Pareto Principle** to Nifty 50 trading: the top 5 heavyweights control 40%+ of the index's movement. Instead of watching all 50 stocks, this tool monitors the "Kings" that actually drive the index direction.
Professional traders don't trade the index in isolation - they look "under the hood" at heavyweight constituents. This indicator does exactly that, providing real-time analysis of HDFC Bank, Reliance, ICICI Bank, Bharti Airtel, and TCS to predict Nifty movements before they happen.
## 🔥 Key Features
### 1️⃣ Four-Quadrant OI Cycle Analysis
Identifies which cycle each heavyweight is in using Open Interest from continuous futures contracts:
- **Long Buildup** (Price ↑ + OI ↑): Institutions buying aggressively → Bullish driver
- **Short Covering** (Price ↑ + OI ↓): Bears trapped and exiting → Fast bullish spike
- **Short Buildup** (Price ↓ + OI ↑): Big money shorting → Bearish drag
- **Long Unwinding** (Price ↓ + OI ↓): Buyers giving up → Index weakness
### 2️⃣ Alignment Score System
Counts how many of the top 5 stocks are bullish/bearish/neutral. When 3+ heavyweights align in the same direction with sufficient weightage (15%+), the indicator generates high-conviction trade signals for the Nifty index.
### 3️⃣ Cost of Carry (Basis) Analysis
Compares Future vs Spot prices to gauge institutional sentiment:
- **Rising Premium**: Aggressive institutional buying
- **Discount (Backwardation)**: Extreme bearishness
### 4️⃣ Divergence Detection
Warns when the index move contradicts heavyweight signals - identifying "fake moves" that professional traders fade.
### 5️⃣ Actionable Trade Signals
- **Strong Bullish**: Buy Index Calls / Long Nifty Future
- **Strong Bearish**: Buy Index Puts / Short Nifty Future
- **Neutral/Choppy**: Iron Condor / Avoid Directional trades
## 📈 What Makes This Different?
Unlike basic index indicators, this tool:
- Fetches real Open Interest data from continuous futures (RELIANCE1!, HDFCBANK1!, etc.)
- Applies weighted analysis - top 3 stocks matter most
- Provides professional trade recommendations based on constituent alignment
- Uses dark theme optimized colors for extended screen time
- Displays comprehensive dashboard with price, OI, OI change %, cycle status, and basis
## 💡 How to Use
1. **Add to any Nifty 50 or Bank Nifty chart**
2. **Watch the dashboard** in the top-right corner showing all 5 heavyweights
3. **Check the ALIGNMENT row**:
- 🔼 Bull Count | 🔽 Bear Count | ➖ Neutral Count
- Weighted Bull/Bear scores
4. **Read the INDEX SIGNAL row** for trade recommendations
5. **Look for divergence warnings** (⚠️) indicating fake moves
6. **Use the histogram plot** to visualize signal strength over time
## ⚙️ Customizable Settings
- **Constituents**: Modify ticker symbols and weightages
- **Signal Thresholds**: Adjust minimum alignment required (default: 3 out of 5)
- **Display Options**: Toggle table, signals, and basis calculations
- **Timeframe**: Works on all timeframes (intraday and daily)
## 🎨 Dark Theme Optimized
Designed specifically for TradingView's dark mode with:
- High-contrast colors that reduce eye strain
- Bright lime green (#00E676) for bullish signals
- Bright red (#FF5252) for bearish signals
- Electric colors for easy pattern recognition
## 📊 Best Used For
- **Nifty 50 Options Trading**: Know whether to buy calls or puts
- **Index Futures Trading**: Identify high-probability directional moves
- **Risk Management**: Avoid trading when heavyweights show divergence
- **Market Timing**: Enter when top stocks align (3+ in same direction)
## 🚀 Pro Tips
- **"Double Engine" Signal**: When Reliance shows Long Buildup AND HDFC Bank shows Short Covering → Extremely bullish for Nifty
- **Sector Rotation**: If Banks are strong but Tech is weak (or vice versa) → Expect choppy, range-bound index
- **Rollover Analysis**: Near expiry, watch for high OI with rising basis → Bulls/Bears carrying positions forward with confidence
## ⚠️ Important Notes
- Requires TradingView Premium for multiple `request.security()` calls
- OI data available only for stocks with active futures
- Best used on NSE exchange during market hours
- Combine with your own risk management strategy
## 📝 Credits
Based on professional institutional trading methodologies that analyze index constituents rather than the index itself. Implements the Pareto Principle: focus on the 20% (top 5 stocks) that drives 80% of the index movement.
***
## 🔔 Alerts Available
- Strong Bullish Signal (3+ stocks aligned bullish)
- Strong Bearish Signal (3+ stocks aligned bearish)
- Divergence Warning (fake index moves)
**Made for serious traders who want to trade like institutions - by watching what the "smart money" is doing in the heavyweights.**
***
*Optimize your Nifty trading by monitoring the stocks that actually matter. Stop watching all 50 - focus on the 5 Kings!* 👑
***
**Tags**: Nifty, Open Interest, OI Analysis, Heavyweight Analysis, Index Trading, Options Trading, Futures Trading, Institutional Analysis, Smart Money, Pareto Principle
Gann Square of 144 (Master Price & Time)🔹 What this tool does
Draws a 144-unit square in price & time (0 → 144)
Plots all key horizontal & vertical levels:
0, 18, 36, 48, 54, 72, 90, 96, 108, 126, 144
Highlights the main 1/2 level (72) as thick midline
Marks 1/3 and 2/3 (48 & 96) as special harmonic levels
Draws internal diagonals (0–144, 144–0 and sub-squares)
Plots an 8-ray Gann fan from the 0-point (0 → 36 / 72 / 108 / 144 etc.)
Keeps price–time ratio consistent inside the box:
the 1×1 angle has a fixed slope = price_per_bar
The idea: once the square is calibrated to a major swing, you can study how price respects these angles and harmonic zones over time.
🔧 Inputs & how to set it up correctly
Choose your timeframe
Works best on Daily and Weekly charts.
Use one timeframe consistently when calibrating the square.
Start offset (bars back)
Start offset (bars back) shifts the whole square left/right.
Increase the value to move the square further into the past, decrease it to move it closer to the current bars.
Box width (bars)
Box width (bars) = how many bars the square spans horizontally.
Bigger value = projects the structure further into the future.
Example: 288 bars ≈ 2×144 units in time, 720 bars for longer-term projection, etc.
Bottom price
Bottom price is your 0-level in price.
Usually set this to a major swing low (cycle low, bear market low, important pivot).
The bottom-left corner of the square conceptually sits at:
(start_offset_bar, bottom_price)
Price per bar (slope 1×1) (if your version has this input)
This defines the slope of the 1×1 angle (main Gann angle).
Recommended way to set it:
Pick a major impulsive move from Swing Low → Swing High.
Measure:
Price range = High − Low
Number of bars between them.
Compute:
price_per_bar = price_range / number_of_bars
Use that as your 1×1 value in the input.
Now the main diagonal from 0 to 144 represents the true Gann 1×1 for that swing.
Important: The 1×1 angle is mathematically correct (price-per-bar), even if it does not always look like a perfect 45° line visually in TradingView due to chart scaling.
📖 How to read the Square of 144
Horizontal levels
0 = anchor price (bottom)
18, 36, 48, 54, 72, 90, 96, 108, 126, 144 = key price harmonics
72 (1/2) often acts as major support/resistance
48 & 96 (1/3 and 2/3) are strong “vibration” levels
Vertical levels
Same units but in time (bars).
When important pivots in price occur near these verticals, you get time–price confluence.
Midlines (1/2)
The thick horizontal and vertical lines at 72 mark the center of the square.
Crossings around these often signal important cycle turns.
1/3 & 2/3 zones (48–54 and 90–96)
These narrow bands are powerful reversal / decision zones.
Price often reacts strongly there or accelerates if they break.
Gann fan from 0-point
These rays represent major trends:
1×1 equivalent (main diagonal)
Faster & slower angles (e.g. 2×1, 1×2, etc depending on configuration)
If price breaks one fan angle cleanly, it often “falls” or “climbs” toward the next one.
🎯 Practical use cases
Project future support/resistance zones based on a major low.
See where price is in the square: early in the cycle (0–36), mid (around 72), or late (108–144).
Watch how price respects:
midlines (72),
1/3 and 2/3 bands (48–54, 90–96),
and the fan angles from 0.
Combine with your own price action / Fibonacci / trend tools – this is not a signal generator, but a time–price map.
⚠️ Notes & limitations
This tool is for educational & analytical purposes only.
It does not generate buy/sell signals.
Visual 45° angles in TradingView can change when you zoom or rescale the chart.
→ The script keeps the internal price-per-bar logic stable, even if the drawing looks steeper/flatter when zooming.
Always confirm zones with price action, volume, and higher timeframe context
Macro Valuation Oscillator (MVO)Macro Valuation Oscillator (MVO) is a macro-relative-strength indicator that compares the current valuation of an asset against three key benchmarks: Gold, USD, and Bond. It helps visualize how the asset performs in relative macro terms over time.
When the MVO line for Gold (yellow) moves below the neutral zone (0), it reflects relative weakness against gold. When it rises above +80, it indicates relative strength or potential overheating compared to gold. The same concept applies to USD (blue) and Bond (purple) lines.
The indicator highlights macro-rotation behavior, showing periods when assets outperform (green) or underperform (red) in relative value. It is mainly intended for daily charts, providing a clear visual framework for assessing long-term macro relationships and timing within broader market cycles.
Grandoc's MTF SeparatorsOverviewThis indicator, known as Grandoc's MTF Separators, draws vertical lines to mark key period boundaries across multiple timeframes (MTF—standing for "Multi-Timeframe," which allows visualization of higher-timeframe structures like daily or weekly pivots directly on lower-timeframe charts, such as 15-minute views). It helps traders align intraday decisions with broader market cycles. Additionally, it includes optional session open/close lines and closing price ranges for major forex sessions (Sydney, Tokyo, Frankfurt, London, New York). By combining customizable timeframe separators with session-specific visuals, it provides a comprehensive tool for multi-timeframe analysis without cluttering the chart. The script is optimized for efficiency, using arrays to manage drawings and respect TradingView's limits.© grandoc
Created: October 12, 2025
Last Modified: October 12, 2025
Version: 1.4 (Improved: Added Frankfurt session with independent toggles for open/close lines and closing range)Key FeaturesMulti-Timeframe (MTF) Separators: Configurable lines for up to four timeframes (e.g., daily, weekly, monthly), plotted as vertical lines extending across the chart. Supports periods from seconds to years—ideal for spotting MTF confluences, like a weekly open aligning with a London session start.
Session Management: Independent toggles for open/close lines and 30-minute closing ranges for five major sessions. Opens use dotted lines by default; closes use solid lines. Frankfurt session added for European traders.
Customization: Select reference points (session start or midnight day start), timezones, colors, line styles, and lookback limits to control visibility and performance.
Efficiency: Arrays limit drawings to user-defined lookback periods, preventing overload on historical data.
Originality and UsefulnessThis script extends standard timeframe detection by integrating session visuals with granular controls, including the new Frankfurt session for better European market coverage. Unlike generic separators, it uses a modular drawSeparator() function for consistent rendering across MTF and sessions, reducing code redundancy. Closing ranges highlight volatility in the final 30 minutes of each session, serving as dynamic support/resistance—unique for session-based strategies.Ideal for forex traders on instruments like EURUSD futures, where aligning intraday trades with higher-timeframe pivots and session transitions reduces noise. For instance, on a 15-minute EURUSD futures chart, daily separators mark session-aligned opens, while London closing ranges flag potential reversal zones before New York handover. The MTF aspect shines here: A weekly separator (orange solid line) crossing a NY open (blue dotted) signals a high-probability setup.How It WorksMulti-Timeframe SeparatorsDetection: Uses ta.change(time(tf, sess, tzz)) to identify period starts, where tf is the timeframe string (e.g., "1D"), sess is "0000-0000" for day-midnight or empty for session-start, and tzz is the timezone.
Drawing: On change, drawSeparator() creates a vertical line via line.new(x1=x_time, x2=x_time, y1=open, y2=open + syminfo.mintick, extend=extend.both). The mintick offset ensures it's a line, not a point. Lines extend both ways for full visibility.
Management: Pushed to dedicated arrays (e.g., sepArray1); excess trimmed with array.shift() and line.delete() based on lookback.
Visibility: Only plots if higher timeframe (timeframe.in_seconds(tf) > timeframe.in_seconds()).
Session Open and Close LinesDetection: For each session (e.g., Sydney: "2200-0700:1234567"), inSession = not na(time(timeframe.period, sessionStr, sessionTz)). Opens trigger on inSession and not inSession ; closes on not inSession and inSession .
Drawing Opens: Calls drawSeparator(true, sessionColor, sessionOpenWidth, sessionOpenStyle, sessionLookback, sessLinesArray) at time (bar open time). Uses global dotted style/width by default for easy identification of new sessions.
Drawing Closes: Similar call, but at time_close (previous bar close) for precise end-time alignment. Uses global solid style/width. All shared in one sessLinesArray for unified trimming.
Navigation Benefit: Dotted opens act as "entry gates" for session momentum; solid closes as "exit signals." Colors differentiate sessions (e.g., green for Sydney), enabling quick scans—e.g., spot Tokyo open overlaps on EURUSD futures for Asian bias.
Closing RangesDetection: For each closing window (e.g., London: "1630-1700:1234567"), inClose = not na(time(timeframe.period, closeStr, sessionTz)).
Tracking: On entry (inClose and not inClose ), initializes high/low at current bar's values and stores bar_index. During session, updates with math.max/min(nz(var, high/low), high/low).
Drawing: On exit (not inClose and inClose ), creates box.new(left=startBar, right=bar_index-1, top=high, bottom=low, border_color=sessionColor, bgcolor=color.new(sessionColor, 80)). 80% transparency for subtle shading; border matches session color.
Management: Pushed to rangeBoxesArray; trimmed like lines. Only draws if toggle enabled (defaults off to avoid clutter).
Navigation Benefit: Ranges visually encapsulate end-of-session volatility—e.g., on EURUSD futures, a tight NY range signals low-risk continuation, while wide ones warn of gaps. Ideal for range-break trades or as next-session S/R.
All session elements use the dedicated sessionTz for consistency, independent of separator timezone.Installation and UsageAdd via TradingView's Public Library (search "Grandoc's MTF Separators").
Settings Navigation: Separators (#1-4): Toggle/enable timeframes (e.g., D1 default); lookback hidden for simplicity.
Style: Per-separator colors/widths/styles (hidden widths); global open/close styles for sessions.
Preferences: "Session" vs. "Day" reference (tooltips explain EURUSD example); timezone (hidden, Day-only).
Session Settings: Unified timezone for all sessions.
Open Lines (g4): Per-session toggles (all on default).
Close Lines (g7): Per-session toggles (all on default).
Closing Ranges (g5): Per-session toggles (all off default—enable for S/R focus).
Session Times (g8): Edit strings (e.g., adjust for DST on EURUSD futures).
Colors & Lookback (g6): Session colors; shared lookback limits.
Apply to EURUSD futures (e.g., 15-min chart) with defaults: See green daily dots, orange weekly solids, session opens/closes in theme colors.
Pro Tip: On futures, set "Session" reference and exchange TZ for accurate rollover alignment; enable ranges for close-of-day liquidity plays. For MTF depth, layer #3 (monthly) over intraday for long-term bias.
LimitationsLines/ranges may cluster on low-timeframe charts; increase lookback or disable lower separators.
Session times are UTC defaults; manual DST tweaks needed for futures like EURUSD.
Time-based; avoid non-standard charts (e.g., Renko).
No built-in alerts—use TradingView's on line/box conditions.
Example Chart Open-source for community reuse (credit © grandoc). Published October 12, 2025. Questions? Comment below!
Hurst‑Millard FLD Normalized 2.0 – Signals "Hurst-Millard FLD Normalized 2.0 – Signals" indicator. It analyzes price data using a combination of moving averages (MAs) and the Hurst exponent to decompose price movements into trend, swing, and noise components, generating buy and sell signals. Here's a brief overview of its functionality:Inputs and Modes:Offers Auto Mode (cycle-based) and Manual Mode for configuring three moving averages: Long-Term (LT), Mid-Term (MT), and Short-Term (ST).
Auto Mode calculates MA lengths and offsets based on user-defined target cycle lengths (e.g., LT: 400 bars, MT: 100 bars, ST: 25 bars) with predefined offset ratios (0.2, 0.333, 0.5 respectively).
Manual Mode allows direct input of MA lengths and offsets.
Moving Averages:Computes Simple Moving Averages (SMAs) for LT, MT, and ST based on the closing price.
Applies forward-shifting to simulate future price behavior (e.g., maLongFwd shifts the LT MA by the specified offset).
Decomposition:Trend: Derived from the forward-shifted LT MA (maLongFwd).
Swing: Calculated as the difference between MT and LT MAs, scaled as a percentage of the closing price and amplified (using ATR or a manual factor).
Noise: Calculated as the difference between ST and MT MAs, similarly scaled and amplified.
Hurst Exponent:Estimates the Hurst exponent to measure the persistence or mean-reversion of the noise component.
Uses a 50-bar lookback period, smoothed with a 5-period SMA.
Signal Generation:Generates buy signals when the noise component is less than the swing component and their difference is within a user-defined proximity threshold (default: 25% of swing).
Generates sell signals when noise exceeds swing within the same threshold.
Signals are plotted as diamond shapes at the calculated proximity price level.
Visualization:Plots the trend, swing, and noise components as lines with customizable colors and gradient intensity based on their relative strength.
Optional debugging plots for raw forward-shifted MAs and proximity thresholds.
Displays a periodic debug table (every 100 bars) showing key metrics like close price, MAs, trend, swing, noise, Hurst exponent, and more.
Additional Features:Supports ATR-based amplification for scaling swing and noise.
Allows customization of signal colors, diamond offsets, and proximity thresholds.
Includes debugging options to visualize raw MAs and proximity bands.
In summary, this indicator uses cycle-based or manually configured MAs to break down price action into trend, swing, and noise, calculates the Hurst exponent for noise analysis, and generates buy/sell signals based on the relationship between swing and noise within a proximity threshold. It’s designed for traders to identify potential trend reversals or continuations.
QLitCycle QuarterlyQLITCYCLE
QLitCycle is an intraday cycle visualization tool that divides each trading day into multiple segments, helping traders identify time-based patterns and recurring market behaviors. By splitting the day into distinct periods, this indicator allows for better analysis of intraday rhythms, cycle alignment, and time-specific market tendencies.
It can be applied to various markets and timeframes, but is most effective on intraday charts where precise time segmentation can reveal valuable insights.
Dividers Timeframe/Session/Calendar-Based [ARTech]Dividers Timeframe/Session/Calendar-Based
This indicator provides customizable visual dividers for multiple timeframes, trading sessions, and calendar-based periods (daily, weekly, monthly). It helps traders visually separate chart areas by key time boundaries without cluttering the chart with price lines.
Key Features:
Multi-Timeframe Dividers: Select up to 4 timeframes (e.g., 60 min, 4 hours, daily, weekly) to display customizable lines marking the start of each timeframe’s candle.
Session Dividers: Define up to 4 trading sessions with user-defined time zones, colors, and active weekdays. The indicator highlights the session’s highest and lowest price range using a box, and compares the session’s opening and closing prices. Based on this comparison, it displays a green or red emoji to indicate bullish or bearish sessions, making it easy to identify session momentum visually.
Calendar-Based Dividers: Enable daily, weekly, or monthly background color zones, with individual toggles and color settings for each day, week, or month. Perfect for visually distinguishing trading periods.
Why use this indicator?
Divider Indicator helps keep your chart organized by visually segmenting timeframes, sessions, and calendar periods, aiding in better analysis of price action relative to important time boundaries.
How to Use
███████ Timezone ███████
A valid timezone name exactly as it appears in the chart’s lower-right corner (e.g. New York, London).
A valid UTC offset in ±H:MM or ±HH:MM format. Hours: 0–14 (zero-padded or not, e.g. +1:30, +01:30, -0:00). Minutes: Must be 00, 15, 30, or 45.
Examples;
UTC → ✅ Valid
Exchange → ✅ Valid
New York → ✅ Valid
London → ✅ Valid
Berlin → ✅ Valid
America/New York → ❌ Invalid. (Use "New York" instead)
+1:30 → ✅ Valid offset with single-digit hour
+01:30 → ✅ Valid offset with zero-padded hour
-05:00 → ✅ Valid negative offset
-0:00 → ✅ Valid zero offset
+1:1 → ❌ Invalid (minute must be 00, 15, 30, or 45)
+2:50 → ❌ Invalid (minute must be 00, 15, 30, or 45)
+15:00 → ❌ Invalid (hour must be 14 or below)
███████ Timeframe ███████
Use this section to display vertical divider lines at the opening of higher timeframe candles (e.g., 1H, 4H, Daily, Weekly). This helps visually separate price action according to larger market structures.
1. Enable a Timeframe:
Turn on one or more timeframes (e.g., 60, 240, D, W) by checking their respective toggle boxes.
2. Lines Mark Candle Opens:
Each active timeframe will draw a vertical line at the start of its candle , making it easier to align intraday moves with larger timeframe shifts.
3. Customize Line Style:
For each timeframe, you can individually set:
Line Style: Solid, dashed, or dotted.
Line Width: From 1 to 10 pixels.
Line Color: Pick any color to match your chart theme.
Opacity: Use transparent colors to avoid overwhelming the chart.
4. Use Multiple Timeframes Together:
You can enable multiple timeframe dividers simultaneously. To maintain clarity:
Use distinct colors for each timeframe.
Use thinner or dotted lines for lower timeframes and bolder lines for higher ones.
Match line style and color intensity to reflect timeframe importance. (e.g., a thick green solid line for Weekly, a thin gray dotted line for 1H)
5. Visual Tip:
These dividers are especially useful for identifying higher timeframe candle opens during intraday trading, spotting breaks above/below previous candle ranges, or aligning session-based strategies with higher timeframe trends.
███████ Session ███████
Use this section to visually highlight specific trading sessions (e.g., London, New York, Tokyo, Sydney) on your chart using time zones, session ranges, and optional weekday filters. This helps focus your analysis on active market hours.
1. Enable a Session:
Activate up to 4 separate trading sessions. Each session can be named (e.g., "London") and customized independently.
2. Set Session Time and Days:
Define session time using the hhmm-hhmm format. (e.g., 0800-1700)
Select which days of the week the session applies to (Sunday through Saturday)
Set your preferred time zone (UTC, Exchange, etc.) from the global settings.
3. Session Box Drawing:
For each active session, the indicator will:
Draw a background-colored box from the session’s start to end time.
Stretch the box to fit the highest and lowest price within that time window.
Draw an outline using customizable border style and width.
4. Session Labels and Directional Hints:
Optionally display the session’s name as a label.
The indicator compares the session’s opening and closing prices . Based on the result:
📈 Green emoji shows a bullish session (close >= open)
📉 Red emoji shows a bearish session (close < open)
5. Display Options:
Show all sessions, only the last session, or a specific number of previous sessions.
Customize label size, location (top/bottom), and whether it appears inside or outside the box.
Adjust background opacity to blend the sessions neatly into your chart.
6. Visual Tip:
Session boxes are particularly useful for:
Spotting repeated highs/lows during active trading hours.
Recognizing session-based breakouts or consolidations.
Comparing performance across different markets and time zones.
███████ Calendar-Based ███████
This section helps you visually segment your chart based on calendar periods: daily, weekly, and monthly. You can enable background color highlighting for individual days, weeks, or months to better track price movements within these time frames.
1. Enable Daily, Weekly, or Monthly Highlighting:
Toggle on the options for Daily, Weekly, and/or Monthly highlighting according to your needs.
2. Select Specific Days, Weeks, or Months:
For Daily, enable any combination of days (up to 7) to color-code.
For Weekly, enable up to 5 weeks per month to cover partial weeks.
For Monthly, enable up to 12 months with individual toggles and colors.
3. Customize Colors for Each Period:
Assign distinct colors to each day, week, or month for easy differentiation. Choose hues that stand out but avoid colors that are too close in tone for adjacent periods.
4. Background Opacity:
Adjust the opacity level of the background coloring to ensure it complements your chart without obscuring price data.
5. Handling Partial Weeks and Overlaps:
The weekly highlighting accounts for months that span 4 to 6 weeks by allowing toggles up to 5 weeks, including weeks that may partially overlap with previous or next months.
6. Visual Tip:
Calendar-based backgrounds are excellent for:
Quickly identifying price behavior within specific calendar units.
Comparing price action across days, weeks, or months.
Spotting seasonal trends or recurring patterns tied to calendar cycles.
CirclesCircles - Support & Resistance Levels
Overview
This indicator plots horizontal support and resistance levels based on W.D. Gann's mathematical approach of dividing 360 degrees by 2 and by 3. These divisions create natural price magnetism points that have historically acted as significant support and resistance levels across all markets and timeframes.
How It Works
360÷2 Levels (Blue): 5.63, 11.25, 33.75, 56.25, 78.75, etc.
360÷3 Levels (Red): 7.5, 15, 30, 37.5, 52.5, 60, 75, etc.
Both Levels (Yellow): 22.5, 45, 67.5, 90, 112.5, 135, 157.5, 180 - These are "doubly strong" as they appear in both calculations
Key Features
Auto-Scaling: Automatically adjusts for any price range (from $0.001 altcoins to $100K+ Bitcoin)
Manual Scaling: Choose from 0.001x to 1000x multipliers or set custom values
Full Customization: Colors, line widths, styles (solid/dashed/dotted)
Historical View: Option to show all levels regardless of current price
Clean Display: Adjustable label positioning and line extensions
Use Cases
Identify potential reversal zones before price reaches them
Set profit targets and stop losses at key mathematical levels
Confirm breakouts when price decisively moves through major levels
Works on all timeframes and all markets (stocks, crypto, forex, commodities)
Gann Theory
W.D. Gann believed that markets move in mathematical harmony based on geometric angles and time cycles. These 360-degree divisions represent natural balance points where price often finds support or resistance, making them valuable for both short-term trading and long-term analysis.
Perfect for traders who use:
Support/Resistance trading
Fibonacci levels
Pivot points
Mathematical/geometric analysis
Multi-timeframe analysis
Bitcoin NUPL IndicatorThe Bitcoin NUPL (Net Unrealized Profit/Loss) Indicator is a powerful metric that shows the difference between Bitcoin's market cap and realized cap as a percentage of market cap. This indicator helps identify different market cycle phases, from capitulation to euphoria.
// How It Works
NUPL measures the aggregate profit or loss held by Bitcoin investors, calculated as:
```
NUPL = ((Market Cap - Realized Cap) / Market Cap) * 100
```
// Market Cycle Phases
The indicator automatically color-codes different market phases:
• **Deep Red (< 0%)**: Capitulation Phase - Most coins held at a loss, historically excellent buying opportunities
• **Orange (0-25%)**: Hope & Fear Phase - Early accumulation, price uncertainty and consolidation
• **Yellow (25-50%)**: Optimism & Anxiety Phase - Emerging bull market, increasing confidence
• **Light Green (50-75%)**: Belief & Denial Phase - Strong bull market, high conviction
• **Bright Green (> 75%)**: Euphoria & Greed Phase - Potential market top, historically good profit-taking zone
// Features
• Real-time NUPL calculation with customizable smoothing
• RSI indicator for additional momentum confirmation
• Color-coded background reflecting current market phase
• Reference lines marking key transition zones
• Detailed metrics table showing NUPL value, market sentiment, market cap, realized cap, and RSI
// Strategy Applications
• **Long-term investors**: Use extreme negative NUPL values (deep red) to identify potential bottoms for accumulation
• **Swing traders**: Look for transitions between phases for potential trend changes
• **Risk management**: Consider taking profits when entering the "Euphoria & Greed" phase (bright green)
• **Mean reversion**: Watch for overbought/oversold conditions when NUPL reaches historical extremes
// Settings
• **RSI Length**: Adjusts the period for RSI calculation
• **NUPL Smoothing Length**: Applies moving average smoothing to reduce noise
// Notes
• Premium TradingView subscription required for Glassnode and Coin Metrics data
• Best viewed on daily timeframes for macro analysis
• Historical NUPL extremes have often marked cycle bottoms and tops
• Use in conjunction with other indicators for confirmation
DTT Yearly Volatility Grid [Pro+] (NINE/ANARR)Introduction :
This tool is designed to automate the Digital Time Theory (DTT) framework created by Ivan and Anarr and applies the DTT Yearly Volatility Grid to uncover swing trading opportunities by analyzing Time-based statistical market behavior across the 4H to Daily chart.
Description:
Built upon the proprietary Digital Time Theory (DTT) , this advanced version is tailored for traders seeking multi-day to multi-week moves . It equips swing traders with an edge by analyzing macro Time intervals and volatility behavior across higher Timeframes. Applicable to all major asset classes, including stocks, crypto, forex, and futures , this script breaks down the entire yearly range into Higher-Time Frame Time Models and statistical zones .
This version uses daily intervals to track broader volatility waves, highlight the DTT framework, and pinpoint premium/discount areas across swing cycles. Powered by Time-driven data insights, this tool assists traders in anticipating expansions, understanding long-range Time distortions, and positioning around statistically significant zones in the higher-Time frame narrative.
Key Features:
Time-Based Models and Macro Volatility Awareness:
Automatically populates the chart with DTT Yearly Time Models (4H, Daily), engineered to spotlight macro volatility events across broader market sessions. Helps swing traders identify potential inflection points, reversals, or trend continuation zones.
Average Model Range Probability (AMRP):
Measure the average volatility expected over higher Time-based models. Use AMRP Levels and Projections to assess the range potential of each Yearly Model Time window—vital for monitoring reversals, breakouts, or continuation plays across several sessions or weeks.
Digital Root Candles and HTF Liquidity Draws:
For DTT Yearly Models, the Digital Root Candles are calculated as a specific Daily candle, and can be viewed on the Daily or 4H Timeframe. Analysts can frame premium and discount zones, based on where price is trading in relation to the current or previous model's Digital Roots. These areas also act as anchors for institutional price movement, often serving as bases for accumulation/distribution periods or large impulse moves.
Extended Visualization:
Track and project prior model ranges (high, low, equilibrium) into the current swing window. This helps visualize macro support/resistance , range expansion, failure zones, and price gravitation levels for longer-term trade planning.
Lookback Periods and Model Count
Utilize adjustable lookback periods to control the number of past DTT Yearly Models displayed—ideal for swing traders and quarterly outlooks. Whether you’re reviewing one yearly model to focus on the present range or several months’ worth of data for backtesting and confluence, this feature keeps charts clean, structured, and aligned with your preferred historical perspective.
By tailoring how many previous Time-based models appear on the chart, traders can better visualize and backtest repeated behaviors, major volatility clusters, and how key levels evolve over Time.
Detailed Data Table:
View statistical AMRP data for multiple DTT Yearly Models in real-Time. The data table helps confirm whether current price movement exceeds, respects, or fails to reach historical volatility ranges—key for analyzing market compression or expansion phases.
Customization Options:
Toggle inner Time interval, calculate AMRP utilizing a custom model lookback, and display styles (solid/dotted lines), including color coordination per drawing. Easily customize your charts and settings to fit your swing trading system or macro analysis.
How Swing Traders Can Use DTT Yearly Volatility Grid Effectively
Identify Swing Premium and Discount Zones:
Use Root Candles and Yearly Time Model AMRP Zones to evaluate where price is positioned in the current Time Model. Using this tool, traders can plan trades with a longer term horizon for a minimum of 1 to 2-weeks or manage entries/exits around market structure shifts and liquidity pools
Expect Macro Volatility Shifts:
Use the HTF models to forecast when and which volatility models are historically known to create larger market impulses . These tools help spot periods of potential exhaustion or breakout, especially near key economic releases, quarterly closes , or macro liquidity zones .
Avoid Low Volatility Consolidations:
AMRP helps you detect when the market is compressing or coiling within a DTT Yearly Model. If price is trading between Digital Root Candles or the AMRP zones, analysts are likely to notice periods of consolidation, and the inability to reach their historical volatility averages.
Usage Guidance:
Add DTT Yearly Volatility Grid (NINE/ANARR) to your TradingView chart.
Make sure to be on the 4H, or Daily Timeframes depending on your asset class and analysis.
Use the DTT Model elements and the Data Table to track expansion zones, premium/discount extremes, and model range behavior.
Terms and Conditions
Our charting tools are products provided for informational and educational purposes only and do not constitute financial, investment, or trading advice. Our charting tools are not designed to predict market movements or provide specific recommendations. Users should be aware that past performance is not indicative of future results and should not be relied upon for making financial decisions. By using our charting tools, the purchaser agrees that the seller and the creator are not responsible for any decisions made based on the information provided by these charting tools. The purchaser assumes full responsibility and liability for any actions taken and the consequences thereof, including any loss of money or investments that may occur as a result of using these products. Hence, by purchasing these charting tools, the customer accepts and acknowledges that the seller and the creator are not liable nor responsible for any unwanted outcome that arises from the development, the sale, or the use of these products. Finally, the purchaser indemnifies the seller from any and all liability. If the purchaser was invited through the Friends and Family Program, they acknowledge that the provided discount code only applies to the first initial purchase of the Toodegrees Premium Suite subscription. The purchaser is therefore responsible for cancelling – or requesting to cancel – their subscription in the event that they do not wish to continue using the product at full retail price. If the purchaser no longer wishes to use the products, they must unsubscribe from the membership service, if applicable. We hold no reimbursement, refund, or chargeback policy. Once these Terms and Conditions are accepted by the Customer, before purchase, no reimbursements, refunds or chargebacks will be provided under any circumstances.
By continuing to use these charting tools, the user acknowledges and agrees to the Terms and Conditions outlined in this legal disclaimer.
สคริปต์แบบชำระเงิน
HinduTime Choghadiya(Dynamic Day & Night)🕉️ HinduTime Choghadiya (Dynamic Day & Night) — Visualize real-time Choghadiya Muhurat across global timezones with dynamic sunrise/sunset-based day & night cycles. Perfect for astrology-based or Vedic timing strategies.
How to Use:
Add to Chart: Click "Add to chart" from the TradingView script panel.
Select Your Timezone: Use the dropdown to choose your local timezone (e.g., Asia/Kolkata).
Customize Sunrise/Sunset:
Set "Day Start Hour" (typically 6 AM).
Set "Night Start Hour" (typically 6 PM).
Visual Choghadiya Overlay:
Background color represents the current Choghadiya (e.g., Amrit, Shubh, Rog).
Adjusts dynamically by weekday and day/night period.
Use for Timing Entries:
Favorable: Amrit, Shubh, Labh
Neutral: Chal
Avoid: Rog, Kal, Udveg
AlphaSync | QuantEdgeB📢 Introducing AlphaSync by QuantEdgeB
🛠️ Overview
AlphaSync is a comprehensive medium-term market guidance system designed for major assets such as BTC, ETH, and SOL. This system helps traders determine the overall market direction by integrating three universal strategies (EvolveXSync, ApexSync, QBHV Sync) and a Hybrid strategy (HybridSync).
🚀 What Makes AlphaSync Unique?
✅ Multi-Strategy Fusion → A robust blend of technical, economic, on-chain, and volatility-driven insights.
✅ HybridSync Component (90% Non-Price Factors) → Incorporates macro and liquidity signals to balance pure price-based models.
✅ Structured Decision-Making → The Trend Confluence score aggregates all sub-strategies, providing a unified market signal.
__________________________________________________________________________________
✨ Key Features
🔹 HybridSync (Hybrid Model)
Utilizes on-chain, economic, liquidity, and volatility factors to provide a fundamental market risk outlook. Unlike technical models, it derives signals primarily from macroeconomic indicators, risk appetite gauges, and capital flows.
🔹 EvolveXSync, & ApexSync (Technical Strategies)
Both strategies are purely price-based, relying on volatility-adjusted trend models, adaptive moving averages, and statistical deviations to confirm bullish or bearish trends.
🔹 QBHV Sync (Momentum & Deviation-Based System)
A fusion of momentum-deviation and a volatility-driven trend confirmation model, designed to detect shifts in momentum while filtering out market noise.
🔹 Trend Confluence (Final Aggregated Signal)
A weighted combination of all four models, delivering a single, structured signal to eliminate conflicting indicators and refine decision-making.
__________________________________________________________________________________
📊 How It Works
1️⃣ HybridSync – Non-Price Market Structure Analysis
HybridSync is an economic and liquidity-based framework, integrating macro variables, credit spreads, volatility indices, capital flows, and on-chain dynamics to assess risk-on/risk-off conditions.
📌 Key Components:
✔ On-Chain Metrics → Tracks investor behavior, exchange flows, and market cap ratios.
✔ Liquidity Indicators → Monitors global money supply (M2), Federal Reserve balance sheet, credit markets, and capital flows.
✔ Volatility & Risk Metrics → Uses MOVE, VIX, VVIX ratios, and bond market stress indicators to identify risk sentiment shifts.
🔹 Why HybridSync?
• Price alone does not dictate the market; macro liquidity and risk factors are often leading indicators of price movement, especially when it comes to risk assets such as cryptocurrencies.
• Improves decision-making in uncertain market environments, particularly during high-volatility or trendless conditions.
2️⃣ EvolveXSync, & ApexSync – Trend-Following & Volatility Models
Both EvolveXSync, & ApexSync are technical strategies, independently designed to capture trend strength and volatility dynamics.
📌 Core Mechanisms:
✔ VIDYA-Based Trend Detection → Adaptive moving averages adjust dynamically to price swings.
✔ SD-Filtered EMA Models → Uses normalized standard deviation levels to confirm trend validity.
✔ ATR-Adjusted Breakout Filters → Prevents false signals by incorporating dynamic volatility assessments.
🔹 Why Two UniStrategies?
• EvolveXSync, & ApexSync have different calculation methods, providing diverse perspectives on trend confirmation.
• Ensures robustness by mitigating overfitting to a single price-based model.
3️⃣ QBHV Sync – Momentum Deviation & Trend Confirmation
This component blends Bollinger Momentum Deviation (BMD) with a percentile-based trend model to confirm trend shifts.
📌 Core Components:
✔ Bollinger Momentum Deviation → A normalized SMA-SD filter detects overbought/oversold conditions.
✔ Percentile-Based Trend Confirmation → Ensures trends align with long-term volatility structure.
✔ Adaptive Signal Filtering → Prevents unnecessary trade signals by refining thresholds dynamically.
🔹 Why QBHV Sync?
• Adds a statistical layer to trend assessment, preventing whipsaws in volatile conditions.
• Complements HybridSync by ensuring price movements align with broader market forces.
4️⃣ Trend Confluence – The Final Aggregated Signal
AlphaSync blends HybridSync, EvolveXSync, ApexSync, and QBHV Sync into one final output.
📌 How It’s Weighted ? Equal Weight to remove any bias and over-reliance on one input.
✔ HybridSync (Macro & On-Chain Factors) → 25% Weight
✔ UniStrat V1 (Pure Trend) → 25% Weight
✔ UniStrat V2 (Trend + ATR) → 25% Weight
✔ QBHV Sync (Momentum & Deviation) → 25% Weight
🔹 Why Merge These Into One System?
The core philosophy behind AlphaSync is to create a holistic, structured decision-making framework that eliminates the weaknesses of single-method trading approaches. Instead of relying solely on technical indicators, which can lag or fail in macro-driven markets, AlphaSync blends price-based trend signals with macroeconomic, liquidity, and risk-adjusted models.
This multi-layered approach ensures that the system:
✔ Adapts dynamically to different market environments.
✔ Eliminates conflicting signals by creating a structured confluence score.
✔ Prevents over-reliance on a single market model, improving robustness.
📌 Final Signal Interpretation:
✅ Long Signal → AlphaSync Score > Long Threshold
❌ Short Signal → AlphaSync Score < Short Threshold
__________________________________________________________________________________
👥 Who Should Use AlphaSync?
✅ Medium-Term Traders & Portfolio Managers → Ideal for traders who require macro-confirmed trend signals.
✅ Systematic & Quantitative Traders → Designed for algorithmic integration and structured decision-making.
✅ Long-Term Position Traders → Helps identify major trend shifts and capital rotation opportunities.
✅ Risk-Conscious Investors → Incorporates macro volatility assessments to minimize unnecessary risk exposure.
__________________________________________________________________________________
📊 Backtest Mode - Evaluating Historical Performance
AlphaSync includes a fully integrated backtest module, allowing traders to assess its historical performance metrics.
🔹 Backtest Metrics Displayed:
✔ Equity Max Drawdown → Measures historical peak loss.
✔ Profit Factor → Evaluates profitability vs. loss ratio.
✔ Sharpe & Sortino Ratios → Risk-adjusted return metrics.
✔ Total Trades & Win Rate → Performance across different market cycles.
✔ Half Kelly Criterion → Optimal position sizing based on historical returns.
📌 Disclaimer:Backtest results are based on past performance and do not guarantee future success. Always incorporate real-time validation and risk management in live trading.
🚀 Why This Matters?
✅ Strategy Validation → See how AlphaSync performs across various market conditions.
✅ Customizable Analysis → Adjust parameters and observe real-time backtest results.
✅ Risk Awareness → Understand potential drawdowns before deploying capital.
Behavior Across Crypto Majors:
BTC
ETH
SOL
📌 Disclaimer: Backtest results are based on historical data and past market behavior. Performance is not indicative of future results and should not be considered financial advice. Always conduct your own backtests and research before making any investment decisions. 🚀
__________________________________________________________________________________
📌 Customization & Default Settings
📌 AlphaSync Input Parameters & Default Values
🔹 Strategy Configuration
• Color Mode → "Strategy"
• Extra Plots → true
• Long/Cash Signal Label → false
• AlphaSync Dashboard → true
• Enable BackTest Table → false
• Enable Equity Curve → false
• Table Position → "Bottom Left"
• Start Date → '01 Jan 2018 00:00'
• AlphaSync Long Threshold → 0.00
• AlphaSync Short Threshold → 0.00
🔹 QBHV.Sync
• DEMA Source → close
• DEMA Length → 14
• Percentile Length → 35
• ATR Length → 14
• Long Multiplier (ATR Up) → 1.8
• Short Multiplier (ATR Down) → 2.5
• Momentum Length → 8
• Momentum Source → close
• Base Length (SMA Calculation) → 40
• Source for BMD → close
• Standard Deviation Length → 30
• SD Multiplier → 0.7
• Long Threshold → 72
• Short Threshold → 59
🔹 EvolveXSync Configuration
• VIDYA Loop Length → 2
• VIDYA Loop Hist Length → 5
• Vidya Loop Long Threshold → 40
• Vidya Loop Short Threshold → 10
• Dynamic EMA Length → 12
• Dynamic EMA SD Length → 30
• Dynamic EMA Upper SD Weight → 1.032
• Dynamic EMA Lower SD Weight → 1.02
• SD Median Length → 12
• Normalized Median Length → 20
• Median SD Length → 30
• Median Long SD Weight → 0.98
• Median Short SD Weight → 1.04
🔹ApexSync Configuration
• DEMA Length → 30
• DEMA ATR Length → 14
• DEMA ATR Multiplier → 1.0
• G-VIDYA Length → 9
• G-VIDYA Hist Length → 30
• VIDYA ATR Length → 14
• VIDYA ATR Multiplier → 1.7
• SD Kijun Length → 24
• Normalized Kijun Length → 50
• KIJUN SD Length → 32
• KIJUN Long SD Weight → 0.98
• KIJUN Short SD Weight → 1.02
🔹 Risk Mosaic (Macro & Liquidity Component)
• Risk Signal Smoothing Length (EMA) → 8
🚀 AlphaSync is fully customizable to match different market conditions and trading styles
🚀 By default, AlphaSync is optimized for structured, medium-term market guidance.
__________________________________________________________________________________
📌 Conclusion
AlphaSync redefines medium-term trend analysis by merging technical, fundamental, and quantitative models into one unified system. Unlike traditional strategies that rely solely on price action, AlphaSync incorporates macroeconomic and liquidity factors, ensuring a more holistic market view.
🔹 Key Takeaways:
1️⃣ Hybrid + Technical Fusion – Balances macro & price-based strategies for stronger decision-making.
2️⃣ Multi-Factor Trend Aggregation – Reduces false signals by merging independent methodologies.
3️⃣ Structured, Data-Driven Approach – Designed for quantitative trading and risk-aware portfolio allocation.
📌 Master the market with precision and confidence | QuantEdgeB
🔹 Disclaimer: Past performance is not indicative of future results. No trading strategy can guarantee success in financial markets.
🔹 Strategic Advice: Always backtest, optimize, and align parameters with your trading objectives and risk tolerance before live trading.
Simple Parallel Channel TrackerThis script will automatically draw price channels with two parallel trends lines, the upper trendline and lower trendline. These lines can be changed in terms of appearance at any time.
The Script takes in fractals from local and historic price action points and connects them over a certain period or amount of candles as inputted by the user. It tracks the most recent highs and lows formed and uses this data to determine where the channel begins.
The Script will decide whether to use the most recent high, or low, depending on what comes first.
Why is this useful?
Often, Traders either have no trend lines on their charts, or they draw them incorrectly. Whichever category a trader falls into, there can only be benefits from having Trend lines and Parallel Channels drawn automatically.
Trends naturally occur in all Markets, all the time. These oscillations when tracked allow for a more reliable following of Markets and management of Market cycles.


