FX % Change TableFX % Change Table
This tool provides currency strength analysis at a glance, allowing traders to instantly identify which currencies are outperforming or underperforming without the need to manually check each pair. It offers decision support for entries and exits by helping traders align their positions with broader strength and weakness trends, such as buying the strongest currency against the weakest. Its versatility makes it suitable for any timeframe, whether used by scalpers or swing traders. Best of all, it delivers these insights in a clean and simple format, presenting complex multi-pair calculations in an easy-to-read visual display.
This tool is especially helpful for traders who incorporate currency strength analysis, correlation checks, or basket trading into their strategy. It reduces time spent flipping through charts and provides a structured overview for smarter trade decisions.
Unlike traditional single-pair indicators, this tool calculates the percentage change between the current and previous higher timeframe closes for a group of forex pairs. You can choose between two curated groups:
• Majors – EURUSD, GBPUSD, USDJPY, USDCHF, AUDUSD, NZDUSD, USDCAD
• Cross Pairs – A wide basket of EUR, GBP, AUD, NZD, CAD, and CHF crosses
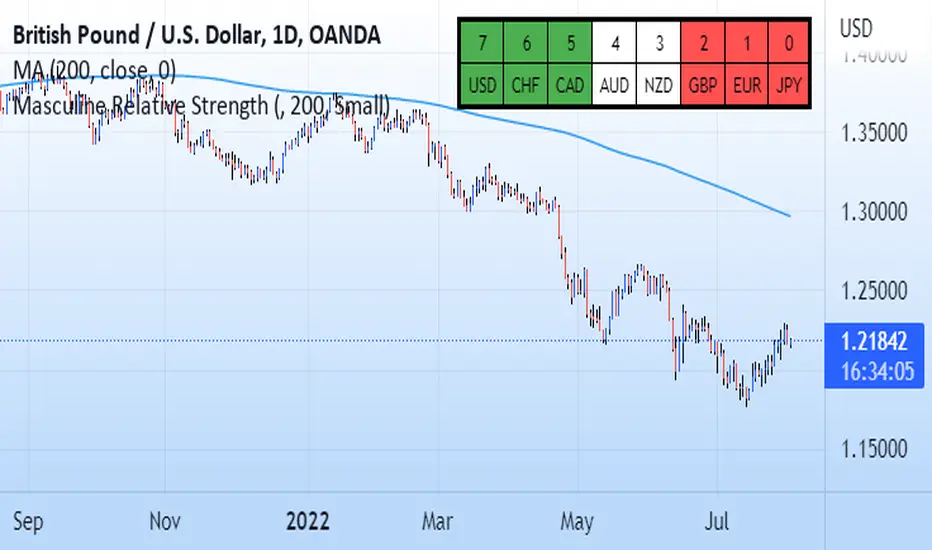
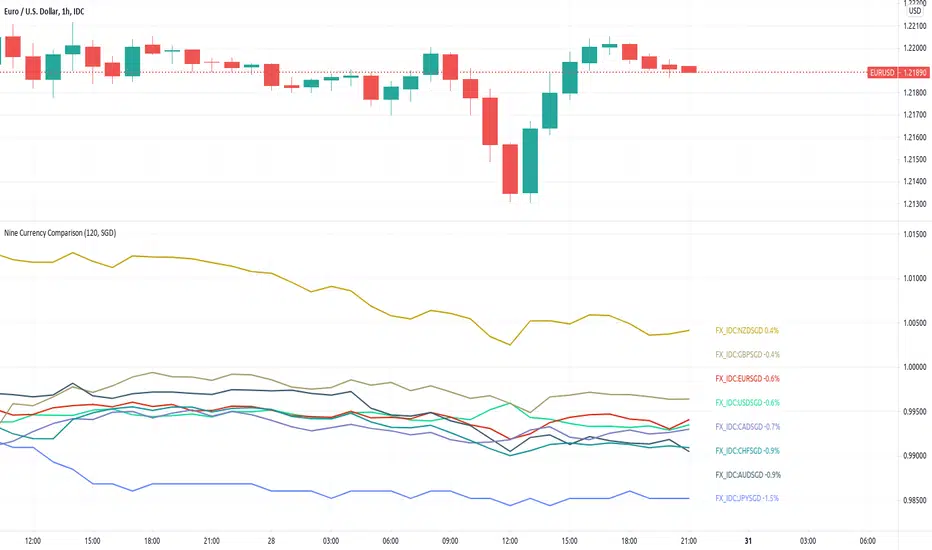
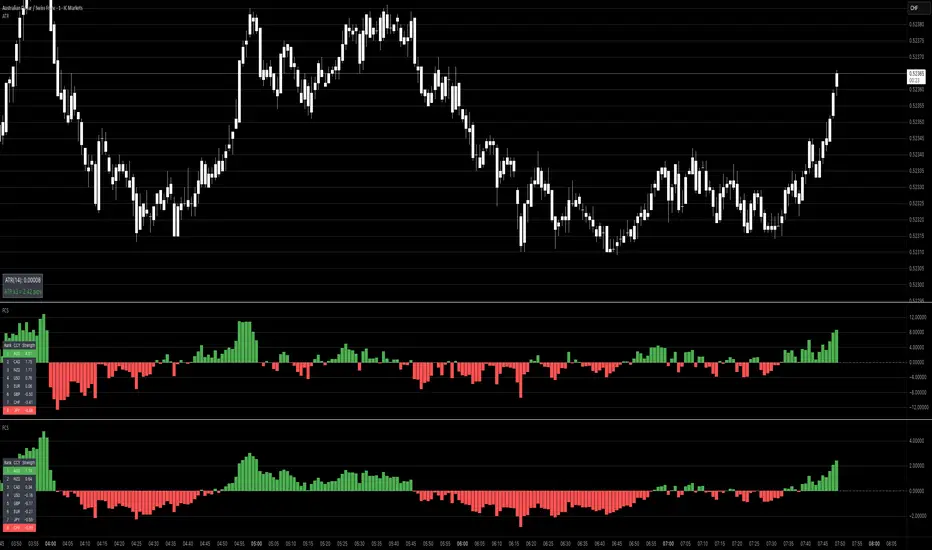
For each symbol, the script requests the selected timeframe’s price data, calculates the percentage change from the previous bar’s close, and then displays it in a neatly formatted table. Green highlights strength, red highlights weakness, and gray shows neutrality — making shifts in momentum instantly recognizable.
How to Use
1. Select your timeframe – For example, "60" (1H) to view hourly change, "240" (4H) for broader moves, or "D" for daily strength/weakness.
2. Choose your group – Focus on the Majors for a macro USD view, or switch to Cross Pairs for secondary flows.
3. Position the table – Place it in any corner of your chart (top-left, top-right, bottom-left, bottom-right) to match your workspace.
The table updates dynamically at the close of each bar, ensuring the displayed data always reflects the most recent market movements.
อินดิเคเตอร์ Pine Script®