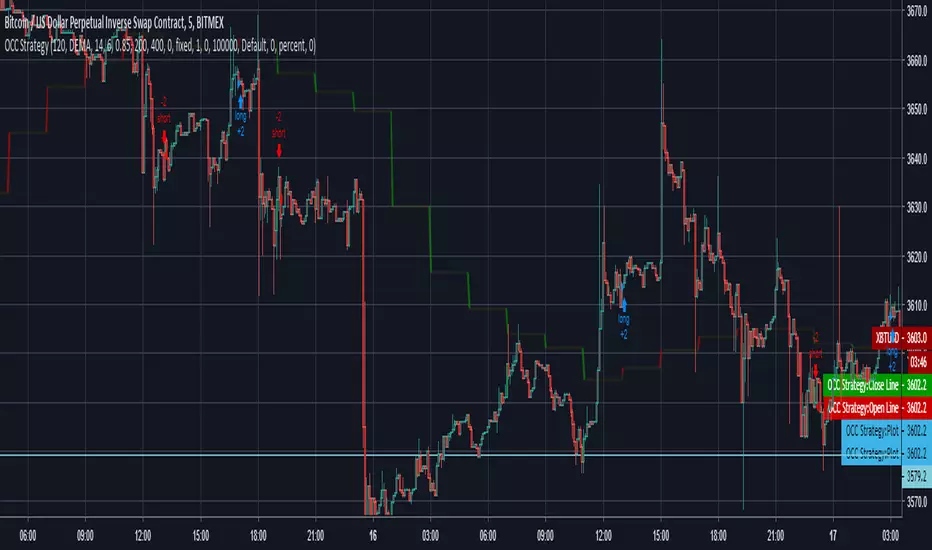
Gap Absorption StrategyLike the nature, markets don't like the void, and this is something we can take advantage of by trading gaps on some markets.
This technique is well known, so I wanted to write a tiny script based on this strategy to get a bit more comfortable with it.
IMPORTANT: Default parameters wont give you good trades on every markets, you need to modify these parameters to see which proportions correspond to the stock you're trading.
This script triggers signals on predefined variation of a stock price after a gap, and allows its user to configure TP and SL prices corresponding to a specific percentage of this gap movement.
Note: We can observe that opening gaps are often the most interesting.
Options
Trigger: the price variation you want to trigger on (in % of the price)
Stop Loss : in % of the gap
Take profit : in % of the gap
A small table is displayed in the top right corner of the chart to give you TP/SL/Signal prices for each opportunity
SL (red line) and TP (green line) are also displayed on the chart when a signal is triggered
Information concerning the current opportunity is given at the bottom of the chart
Note: This script is based on the Gap-Size-Indicator that I published a few weeks ago.
ค้นหาในสคริปต์สำหรับ "Candlestick"

Consecutive Up/Down Strat + alerts via TradingConnector to ForexSoftware part of algotrading is simpler than you think. TradingView is a great place to do this actually. To present it, I'm publishing each of the default strategies you can find in Pinescript editor's "built-in" list with slight modification - I'm only adding 2 lines of code, which will trigger alerts, ready to be forwarded to your broker via TradingConnector and instantly executed there. Alerts added in this script: 12 and 15.
How it works:
1. TradingView alert fires.
2. TradingConnector catches it and forwards to MetaTrader4/5 you got from your broker.
3. Trade gets executed inside MetaTrader within 1 second of fired alert.
When configuring alert, make sure to select "alert() function calls only" in CreateAlert popup. One alert per ticker is required.
Adding stop-loss, take-profit, trailing-stop, break-even or executing pending orders is also possible. These topics have been covered in other example posts.
This routing works for Forex, indices, stocks, crypto - anything your broker offers via their MetaTrader4 or 5.
Disclaimer: This concept is presented for educational purposes only. Profitable results of trading this strategy are not guaranteed even if the backtest suggests so. By no means this post can be considered a trading advice. You trade at your own risk.
If you are thinking to execute this particular strategy, make sure to find the instrument, settings and timeframe which you like most. You can do this by your own research only.

xGhozt Consecutive Candle Count - BacktestxGhozt Consecutive Candle Count with Backtest simply counts consecutive positive or negative candles, and allows you to get the live statistics of how many times this consecutive candle series occurred in the past, with the probabilities of the next candle to be a reversal, and the average past gains from that reversal. You can select the number of consecutive candles you're tracking, and select a start and end date. When your desired pattern is met by the indicator, it will indicate you on the chart if it's worth shorting or longing the next candle.
You also have the possibility to set up alerts when your consecutive candles patterns are met. To do so, go into the indicator's settings, select your time frame, the consecutive number of candles you are tracking, your success rate, and the number this pattern occurred in the past. Once it's done, open the alerts box, and set up your alerts accordingly.
You will have 2 options:
- Green Candles Followed by Red = short next candle.
- Red Candles Followed by Green = long next candle
Now that the backtest is added, you can try different combinations and figure the best outcome to get the best returns!
One thing to note with the backtest: you cannot run the backtest with take profits / stop loss AND candle closing, it has to be one of the two.

Three (3)-Bar and Four (4)-Bar Plays StrategyThis strategy analyzes the three and four-bar play which is when price action has a wide igniting bar that has a full body, then one or two narrow bars which have a relatively equal high for long plays and relatively equal low for short plays, then a continuation bar. You should not take plays that will encounter resistance. The stop loss is placed for long plays below the 2nd bar (or 3rd bar for 4-bar play).
This is commonly used on 1m, 2m, 5m, and 10m charts.
Jared Wesley is one of the more notable traders that use this setup. You can edit as an input the start date, end date, igniting bar size, the body percentage of the igniting bar, the relative equality of the 2nd bar (and 3rd bar for 4-bar play) compared to the igniting bar, and profit multiplier.

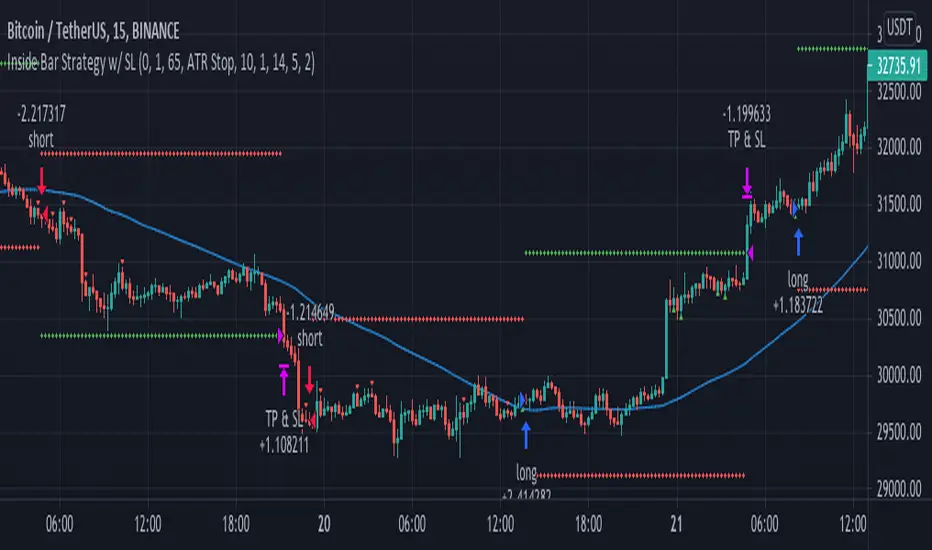
Inside Bar Strategy w/ SL"Inside bars are a two -bar pattern. They can indicate either a continuation of the
existing move or a reversal. A continuation occurs when there is no significant
support or resistance level in sight, while a reversal occurs close to a strong sup-
port or resistance level...
...A lot of traders are aware of inside bars but few manage to make money with
them. Why is this so? It goes back to interpreting price action. A lot of traders look
to trade in geometric ways. What I mean is that they search for fancy shapes on a
chart and think that this is what represents true price action.
This is not the case. A shape is just a shape. The formation by itself means
nothing unless underlying order flow backs it up. This is why it’s extremely
important that you look for inside bars when a trend is already in place.
The best place to look for them is in the beginning of trends."
FTB Strategy (Automated)Hey traders!
This is a profitable strategy script I created to teach my students how to automate their scripts using 3rd party APIs (more info available in my profile link at the bottom of this page).
What Is This?
This strategy is called the "Follow The Bear" strategy.
It's a forex trading strategy designed for one purpose and one purpose only: to take advantage of a recurring pattern on EURUSD's 1-Hour chart during the European market open.
The basic explanation is this:
During the European open we want to see a rally followed by a swing high shooting star / reversal pinbar candle. This typically means that traders buying EURUSD during the European/London open are now trapped long, and as price begins to retrace they are forced to sell, fueling a short-term retracement.
This strategy takes advantage of that pattern by aggressively selling short with a tight stop-loss above the pinbar candle and a conservative target.
There are many ways to trade this pattern, but this script represents my personal method for trading it.
It is not 100% accurate (no strategy is), but it does have a considerably high win rate over the past 6+ years considering its simplicity and I've been trading it for several months and can attest to its edge over the markets (at least through the Oanda data feed which is what I use).
The strategy rules are this:
Market: EURUSD
Timeframe: 1-Hour
Direction: Short Only
Timezone: 6AM-10AM GMT
Days: Tuesday, Wednesday, Thursday
Entry: Close of Pinbar Setup
Stop: 2 pips above signal candle
Target: 1:1
Risk: Up to you (backtest first! I use 1%)
The rule for the pinbar/shooting star candle pattern is that the candle must both open and close in the lower 50% of the bar's total size.
Automation
This script is already prepared to be auto-traded through a 3rd-party API that was created to relay TradingView alerts to your broker to execute and manage trades.
Sorry for the lack of information - due to TradingView's house rules I cannot go into any more detail here, but if you're interested in automating this script there is more info available in the resources offered under my profile link at the bottom of this page.
Disclaimer
The material and the resources offered here are for educational purposes only. Always do your own research and only execute trades based on your own personal judgement.
Trading foreign currencies can be a challenging and potentially profitable opportunity for investors. However, before deciding to participate in the forex market, you should carefully consider your investment objectives, level of experience, and risk appetite. Most importantly, do not invest money you cannot afford to lose.
There is considerable exposure to risk in any foreign exchange transaction. Any transaction involving currencies involves risks including, but not limited to, the potential for changing political and/or economic conditions that may substantially affect the price or liquidity of a currency, investments in foreign exchange speculation may also be susceptible to sharp rises and falls as the relevant market values fluctuate.
The leveraged nature of forex trading means that any market movement will have an equally proportional effect on your deposited funds. This may work against you as well as for you. Not only may investors get back less than they invested, but in the case of higher risk strategies, investors may lose the entirety of their investment. It is for this reason that when speculating in such markets it is advisable to use only risk capital.
Trading foreign exchange on margin carries a high level of risk, and may not be suitable for all investors. Past performance is not indicative of future results. The possibility exists that you could sustain a loss of some or all of your initial investment and therefore you should not invest money that you cannot afford to lose. You should be aware of all the risks associated with foreign exchange trading, and seek advice from an independent financial advisor if you have any doubts.

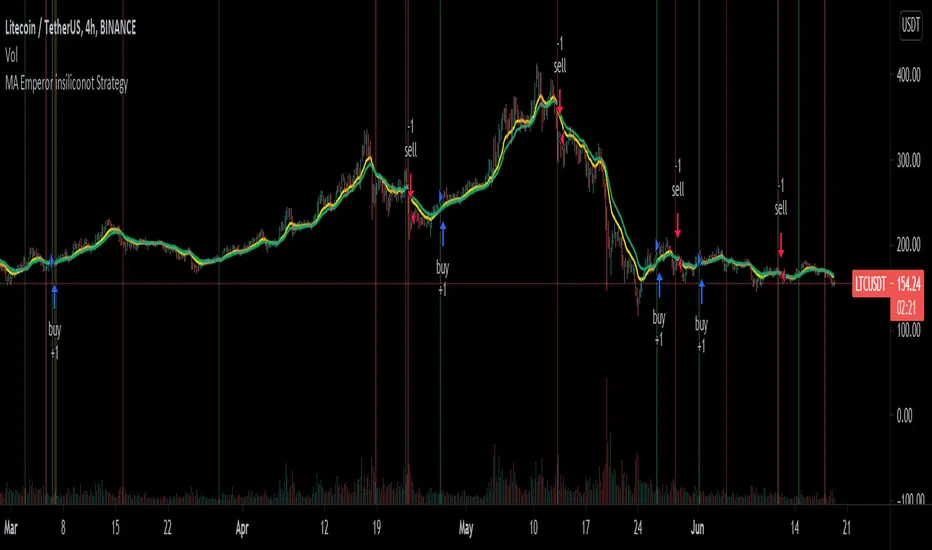
MA Emperor insiliconot StrategyConverted EmperorBTC's EMA crossover indicator for easy backtesting and added ability to:
Specify time period for backtesting
Specify order quantity
Toggle original indicators (default off)
Quoting EmperorBTC:
Entry is to be made when the
1. Cross over gives a P(Positive Sign) and the candle completely closes above the cross-over
2. When the Heikin Ashi turns green and the next green HA candle goes above the previous green HA candle.
3. The price should be at-least above the 0.236 Level from the Swing high.
Kindly note that the strategy only attempts to do check number 1, where it ensures the entry opens above the cross-over.
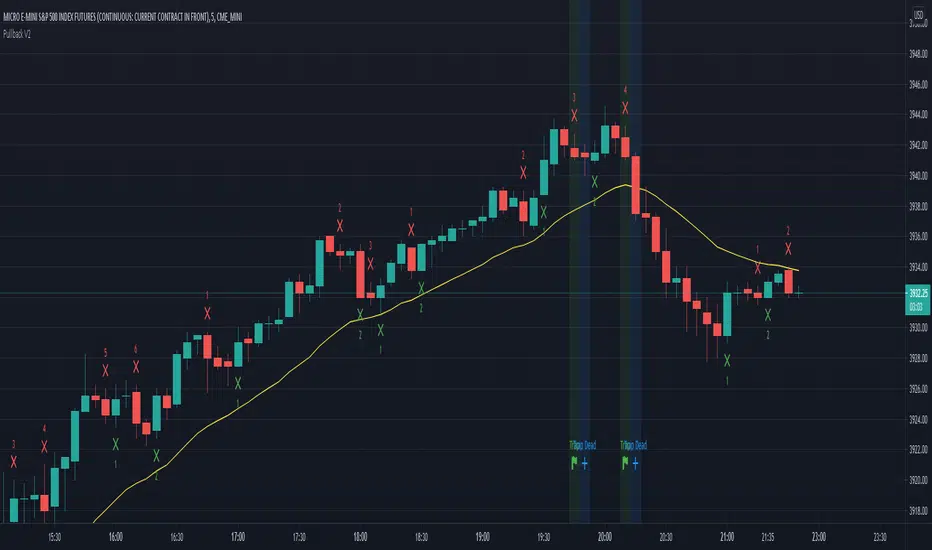
Pullback Traps v. 0.1Trading Strategy for scalping the CME_MINI:ES1! and CME_MINI:MES1! futures on the 5 min. time frame.
The strategy will count legs and look for failed pullbacks and failed second entries where shorters get trapped.
How to use:
When a trap occurs (Marked with green light) place an order one tick above the high of the trap and enter on next candle
If entry doesn't happen on next candle and it has a lower high, move entry to one tick above high of that candle.
Keep doing the above until you enter or until a candle is marked with a blue light and the text Trap Dead.
If you see Trap dead and you haven't entered, quickly cancel your order.
What is green light?
A second or later pullback down away from the uptrend. When the green light is present the shorters haven't made a 1 point profit and short scalpers are trapped.
What is blue light?
1. Shorters made their 1 point profit and trap is dead. Cancel your trade. Or...
2. Shorters hit their stop loss and you're probably in a trade now and about to profit.
Profit and stop loss:
Numbers are done with profit 5 ticks and stop loss 30 ticks.
Should I have a stop loss 6 times greater than profit?
Probably not. The numbers you see here are made with these profit and stop loss figures but I don't advice it in real trading.
The numbers look good on this backtest but in reality a few bad trades would ruin everything.
This was made purely for fun and sim trading - Feel free to do your own testing and show the resulsts.
NYCOB Kill Zone StrategyI have now turned the NYCOB Kill zone into a stand alone strategy!
Fully customizable in regards to time of entry and levels of entry but the standard settings are the best all around.
Original NYCOB Kill Zone text below
This script plots the H and L of the first 2 hours of the NYC session and shades the space between in which i deem the NYC Order Block
It also maps out the First two hours on the chart as well so you can understand when the OB has formed
Over the past 3 years of trading cryptocurrency i have noticed a phenomena that has occurred nearly every day
The H or L will 90% of the time will be posted in the first two hours of this session
knowing this means you understand if you just wait til this time you can better your odds at not getting stop hunted due to poor entry
A few things to take from this study are these.
1. after the OB is formed
2. whichever side gets taken out first (H/L) will 90% define the bias for the day. I have found that using the m13-m15 TF will add some more confirmation with 1-2 closes outside of range H/L/
3. After general bias has formed 2 things can happen
A) PA just takes off and there is really nothing you can do about it unless you had other studies that told you that will happen
B) PA will dip back INTO the OB and create the OTE which is any retracement below the .5 Fibonacci of the shaded OB
4. Typically OTE happens after the session has ended
5. If you used OTE off of the past days NYCOB then you can use the new (forming or just formed) NYCOB to CONFIRM your initial bias presented from the previous days OTE and bias.
6. When PA cannot close outside the NYCOB it presents a range to range play where PA will visit the opposite side of the range to chase liquidity,
7. When the NYCOB is TIGHT then deviation is more likely to result in price expansion, when the NYCOB is WIDE then deviation tends to present more range to range plays.
8. After bias is formed and OTE has been made your stops should always be outside the NYCOB. I use the m30 or H1 ATR to get a slight cushion from the OB to ensure i dont get stop hunted.
Standard TP are all set at the same level but you can adjust them accordingly
Shout out to Elevate-Trading family member Boederzeng for helping me with the code!

Pinescript v4 - The Holy Grail (Trailing Stop)After studying several other scripts, I believe I have found the Holy Grail! (Or perhaps I've just found a bug with Tradingview's Pinescript v4 language) Anyhow, I'm publishing this script in the hope that someone smarter than myself could shed some light on the fact that adding a trailing stop to any strategy seems to make it miraculously...no that's an understatement...incredulously, stupendously, mind-bendingly profitable. I'm talking about INSANE profit factors, higher than 200x, with drawdowns of <10%. Sounds too good to be true? Maybe it is...or you could hook it up to your LIVE broker, and pray it doesn't explode. This is an upgraded version of my original Pin Bar Strategy.
Recommended Chart Settings:
Asset Class: Forex
Time Frame: H1
Long Entry Conditions:
a) Exponential Moving Average Fan up trend
b) Presence of a Bullish Pin Bar
c) Pin Bar pierces the Exponential Moving Average Fan
Short Entry Conditions:
a) Exponential Moving Average down trend
b) Presence of a Bearish Pin Bar
c) Pin Bar pierces the Exponential Moving Average Fan
Exit Conditions:
a) Trailing stop is hit
b) Moving Averages cross-back (optional)
c) It's the weekend
Default Robot Settings:
Equity Risk (%): 3 //how much account balance to risk per trade
Stop Loss (x*ATR, Float): 0.5 //stoploss = x * ATR, you can change x
Stop Loss Trail Points (Pips): 1 //the magic sauce, not sure how this works
Stop Loss Trail Offset (Pips): 1 //the magic sauce, not sure how this works
Slow SMA (Period): 50 //slow moving average period
Medium EMA (Period): 18 //medium exponential moving average period
Fast EMA (Period): 6 //fast exponential moving average period
ATR (Period): 14 // average true range period
Cancel Entry After X Bars (Period): 3 //cancel the order after x bars not triggered, you can change x
Backtest Results (2019 to 2020, H1, Default Settings):
AUDUSD - 1604% profit, 239.6 profit factor, 4.9% drawdown (INSANE)
NZDUSD - 1688.7% profit, 100.3 profit factor, 2.5% drawdown
GBPUSD - 1168.8% profit, 98.7 profit factor, 0% drawdown
USDJPY - 900.7% profit, 93.7 profit factor, 4.9% drawdown
USDCAD - 819% profit, 31.7 profit factor, 8.1% drawdown
EURUSD - 685.6% profit, 26.8 profit factor, 5.9% drawdown
USDCHF - 1008% profit, 18.7 profit factor, 8.6% drawdown
GBPJPY - 1173.4% profit, 16.1 profit factor, 7.9% drawdown
EURAUD - 613.3% profit, 14.4 profit factor, 9.8% drawdown
AUDJPY - 1619% profit, 11.26 profit factor, 9.1% drawdown
EURJPY - 897.2% profit, 6 profit factor, 13.8% drawdown
EURGBP - 608.9% profit, 5.3 profit factor, 9.8% drawdown (NOT TOO SHABBY)
As you can clearly see above, this forex robot is projected by the Tradingview backtester to be INSANELY profitable for all common forex pairs. So what was the difference between this strategy and my previous strategies? Check my code and look for "trail_points" and "trail_offset"; you can even look them up in the PineScript v4 documentation. They specify a trailing stop as the exit condition, which automatically closes the trade if price reverses against you.
I however suspect that the backtester is not properly calculating intra-bar price movement, and is using a simplified model. With this simplfied approach, the trailing stop code becomes some sort of "holy grail" generator, making every trade entered profitable.
Risk Warning:
This is a forex trading strategy that involves high risk of equity loss, and backtest performance will not equal future results. You agree to use this script at your own risk.
Hint:
To get more realistic results, and *maybe* overcome the intrabar simulation error, change the settings to: "Stop Loss Trail Points (pips)": 100
I am not sure if this eradicates the bug, but the entries and exits look more proper, and the profit factors are more believable.

Gap Down Reversal StrategyA "Gap down Reversal" is when the current days candle, opens, below the prior days close, and "finishes up" on the day with the close greater than the open. This type of price action can provide traders with favorable entry points to trade long, as anyone who was short the prior day, can get squeezed or panic out of the trade as they would see profits erode quickly from the gap down at the open.
Strategy results are shown on SHOP with 10k starting capital and 10k per trade. The strategy enters at next days close after the gap down reversal fires off, and a 5% trailing stop order is also executed. This is important to understand when experimenting with different trailing stops on different symbols and observing results to find the most viable strategy. The discretionary trader may choose to enter at the close, or at the next days open, so understand results are not calculated for those entry points.
You also may alter the start date of the strategy, so you can include, or exclude certain dates.
Experiment with different stops and symbols! More volatile symbols most likely will need looser stops and Vice Versa. Concentrate on symbols in up trends, as "the dips" usually get consistently bought in these names, but hard reversals in downtrends can happen as well.
Any questions/concerns please let me know and happy trading.

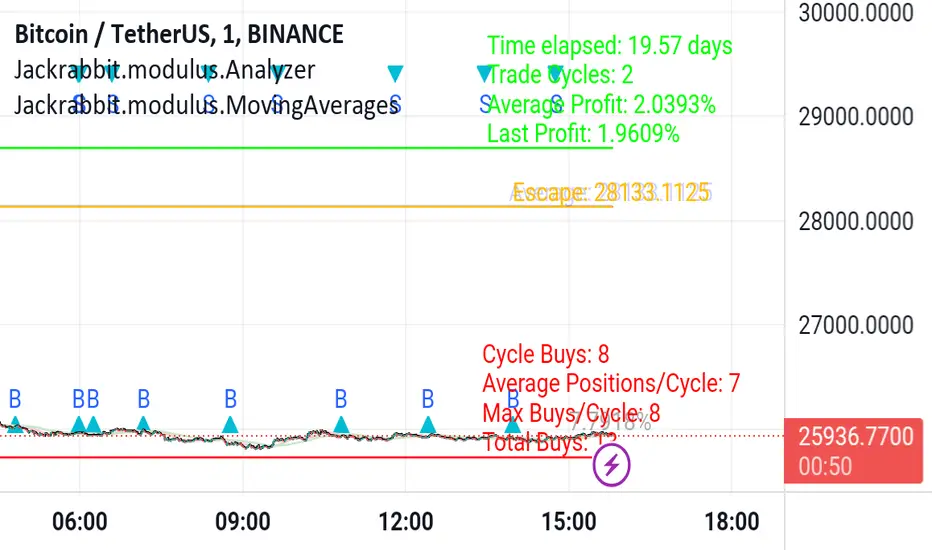
Jackrabbit.modulus.AnalyzerThis is the module Analyzer for the Jackrabbit suite and modulus framework.
As the modulus framework has grown both in size and complexity, it has become ever increasingly difficult to evaluate the profitability a very complex multi-layered modules combined.
The Jackrabbit Analyzer module allows you to do just that. Connect this module to the end of your IoI chain and it will tell you the profitability of your current combination, using TradingView's strategy backtesting capabilities.
With this module connected to your IoI chain, you can literally watch in real time as the analyzer evaluates your current settings and updates each time you make a change in those settings, giving you a better and more realistic approach to what is possible with your current strategy.
While this module is not a substitute for paper trading, it significantly increases the construction and analysis of a multi-layered trading paradigm that can then be taken to a paper trader with a high level of confidence of success.
Only the signal line is displayed.
The Jackrabbit modulus framework is a plug in play paradigm built to operate through TradingView's indicator on indicatior (IoI) functionality. As such, this script receives a signal line from the previous script in the IoI chain, and evaluates the buy/sell signals appropriate to the current analysis.
This script is by invitation only. To learn more about accessing this script, please see my signature or send me a PM. Thank you.
MARUSIA TRADING STRATEGIES [VCRYPTO]Description of MARUSIA TRADING STRATEGIES
«MARUSIA» is a compilation of several strategies.
You may choose the one which best suits your trading habit from options menu.
The strategies are based on indicator’s and bar’s closing level analysis on different timeframes.
At the time being there are 3 types of strategies for BTC on 1H and 3H tf.
+++ BTC 1H 90% Success +++ (Beginner)
Instrument - BTC, timeframe – 1H, exchange – Bitmex.
The advantage of the strategy is a high quantity of profitable trades (90% at the time of publishing).
The Trading View backtest results from 2019:
+ 303% net profit
+ 90% profitable trades
+ 6% drawback
+++ BTC 1H Mega Scalper +++ (Intermediate)
Instrument - BTC, timeframe – 1H, exchange – Bitmex.
The advantage of the strategy is more frequent trades with a good probability of success.
The Trading View backtest results from 2019:
+ 792% net profit
+ 64% profitable trades
+ 5% drawback
+++ BTC 3H Mega Scalper +++ (Expert)
Instrument - BTC, timeframe – 3H, exchange – Bitmex.
The advantage of the strategy is more frequent trades with a good probability of success.
The Trading View backtest results from 2018:
+ 1637% net profit
+ 79% profitable trades
+ 4,4% drawback
HOW TO USE
1. Choose the strategy from the strategy’s option menu on the chart. Pay attention to the instrument and timeframe you are using the selected strategy for.
2. Wait until you see green (above bar) or orange (below bar) label. To receive an alert when these labels (or signals) appear on the chart use ALERT INDICATOR for this strategy.
3. On the opening of the next bar enter the position if the label on the previous bar hasn’t disappeared. Green – for Buy, orange – for Sell. In this case you will see Buy/Sell signal on the chart.
4. Putting TRAILING STOPS
4.1. You should put a trailing stop when the price moves to profit up or down for 1% from your entry. For example, if you are long at 7255 USD and price moves up to 7328 USD (7255*1.01), put trailing stop with a trailing value 0,4% of your entry price, which is 29 USD (7255*0.004).
4.2. Every time when there is a long or short position, you may see a green info label with entry price, trail stop activation level and trail value. You may use this information instead of making a calculation by yourself. Only if your entry is the same as in the label.
5. Position closing maybe by reaching your trailing stop (in this case you may reenter the position on the next bar, if there is a signal label as per step 2 on the bar where your trailing stop is triggered) or when there is a signal for opposite direction.
6. If the signals appear differently than described as above, just refresh the website of Trading View. This happens because mostly take profits are shown only after the current bar is closed.
• The Buy/Sell signal label may move up or down on the bar with price’s movement. Don’t worry it doesn’t mean that your entry is changing.
• The lines on the chart are weekly price levels – the price levels of the previous week –
Green – open, Red – close, Blue – high, Brown – low, Black – hl2 (average of high and low). You may use them as support and resistance levels.
***
+ Trading View backtest results
+No repaint
+ Several strategies to choose which suits your trading habit
+Free testing
+Support with a call
Pm to get access to the strategy.
____________________________________________________________________________
Описание к стратегии "MARUSIA TRADING STRATEGIES "
Сборник нескольких стратегий серии "Marusia"
Выбор конкретной стратегии осуществляется из удобного меню
Основа наших стратегий - совмещение индикаторного анализа и анализа уровня закрытия свечей на разных временных интервалах (анализ уровней).
+++ BTC 1H 90% Success +++ (Beginner)
Стратегия работает на инструменте Bitcoin (BTC) по котировкам биржи BITMEX на 1 часовом таймфрейме (1H).
Основное преимущество данной стратегии - супервысокая успешность сделок (более 90% на момент публикации).
Данная стратегия представляет собой гибрид среднесрочных стратегий по частоте сделок (с 2019 по 12.04.2020 - 204 сделки, в среднем одна сделка раз в 2 дня) и элемент высокочастотных (скальп) стратегий - необходимо выставление использование скользящего стоп-приказа (trailing stop-loss), расчетные данные по которому появляются прямо на экране при открытии сделки.
Статистика по данной стратегии, подтвержденная бэктестом в Trading View
С 2019 года до момента публикации стратегии бектест показывает следующие данные:
+ 303% чистой прибыли
+ 90% успешных сделок
+ 6% макс. единовременная просадка
+++ BTC 1H Mega Scalper +++ (Intermediate)
Стратегия работает на инструменте Bitcoin (BTC) по котировкам биржи BITMEX на 1 часовом таймфрейме (1H)
Основное преимущество данной стратегии - высокочастотные сделки с хорошей вероятностью успеха.
С 2019 года до момента публикации стратегии бектест Trading View показывает следующие данные:
+ 792% чистой прибыли
+ 64% успешных сделок
+ 5% макс. единовременная просадка
+++ BTC 3H Mega Scalper +++ (Expert)
Стратегия работает на инструменте Bitcoin (BTC) по котировкам биржи BITMEX на 3 часовом таймфрейме (3H)
Основное преимущество данной стратегии - высокочастотные сделки с хорошей вероятностью успеха
С 2019 года до момента публикации стратегии бектест Trading View показывает следующие данные:
+ 1637% чистой прибыли
+ 79% успешных сделок
+ 4,4% макс. единовременная просадка
***
Инструкиция по использованию:
1. Вы открываете график с включенной стратегией. Обратите внимание на инструмент и таймфрейм стратегии.
2. Ожидаете появления на графике зеленого (снизу) или оранжевого (сверху) флажка.
Для получения уведомления появления значков (сигналов) используйте АЛЕРТНЫЙ ИНДИКАТОР для данной стратегии.
3. На открытии следующей свечи входите в сделку, если флажек из п.2 остался и не пропал (зеленый флажек - покупка, оранжевый - продажа)
4. Выставление trailing stop-loss
4.1 Trailing stop-loss выставляется, когда цена прошла 1% в профит от цены выхода в сделку (например: покупка 7255 и когда цена будет 7328 (7255*1,01) выставляется плавающий стоп-лосс (trailing stop-loss) в размере 0,4% от цены входа "29" (7255*0,004).
4.2. Как только будет закрыта свеча, на которой Вы вошли в сделку - вы увидете значения из п.4.1 на экране рядом с графиком (вы можете их использовать без самостоятельного расчета, но тогда есть риск, что если цена на свече входа достигнет значения из п. 4.1 - то сделка закроется, а вы это увидите только на следующей свече, когда значение цены может быть менее выгодное)
5. Выход из сделки осуществляется либо по trailing stop-loss (тогда вы можете перезайти в сделку на открытии следующей свечи, если на свече, на которой произошло закрытие по trailing stop-loss появились флажки из п.2), либо по появлению противоположного флажка, тогда вход в сделку, в соответствии с п. 2 и 3
7. Если Вы увидели, что сигналы отличаются от написанного в данной инструкции - просто обновите страницу с Trading View в браузере и все встанет на свои места.
* На свече захода в сделку сигнал "buy/sell" может "плавать" по свече, но если Вы выполнили п.1-3 Вам неочем беспокоиться. Не обращайте на него внимание.
***
Основные отличия от стратегий наших коллег:
+ Результаты бэктеста в платформе Trading View – прозрачная статистика по сделкам, которую вы можете посмотреть самостоятельно
+ Построен на принципах non-repaint basis – сигналы не исчезают (при правильном соблюдении инструкции по использованию)
+ Каждая стратегия серии построена на своем уникальном принципе - вы можете выбрать для себя оптимальный набор стратегий
+ Бесплатный тестовый период
+ Поддержка с возможностью организации телефонного звонка
Для предоставления доступа к данной стратегии - пожалуйста пишите в личные сообщения. Мы быстро с Вами свяжемся.
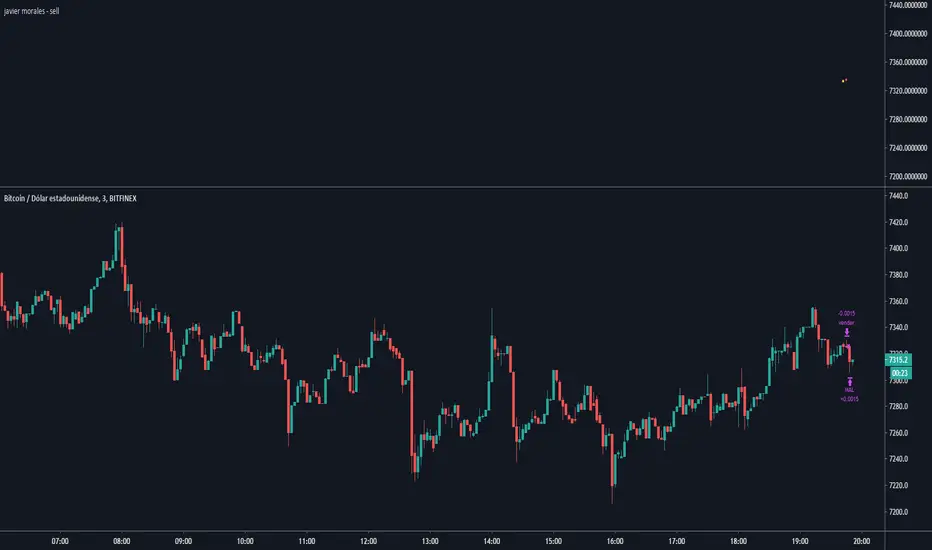
Javier Morales - sellEste script, creado por mi, opera sobre la gráfica BTC/USDT aunque puede ser utilizado en cualquier otra gráfica. Trabaja a la baja, en corto, aplicando una de las técnicas mas simples del trading, siempre que el precio de apertura de la vela anterior sea mayor que el precio de apertura de la vela posterior invierte una cantidad X, al final de la vela actual tanto si el precio ha subido como bajado cerrará la posición, pero si ha subido duplicará la inversión hasta que o bien se acabe el capital inicial o bien obtenga ganancias mayores que cero.
This script, created by me, operates on the BTC / USDT chart although it can be used on any other chart. Work downwards, in short, applying one of the simplest trading techniques, provided that the opening price of the previous candle is greater than the opening price of the subsequent candle invests an amount X, at the end of the current candle both if the price has risen or fallen, it will close the position, but if it has risen, it will double the investment until either the initial capital runs out or it makes profits greater than zero.
Javier Morales.
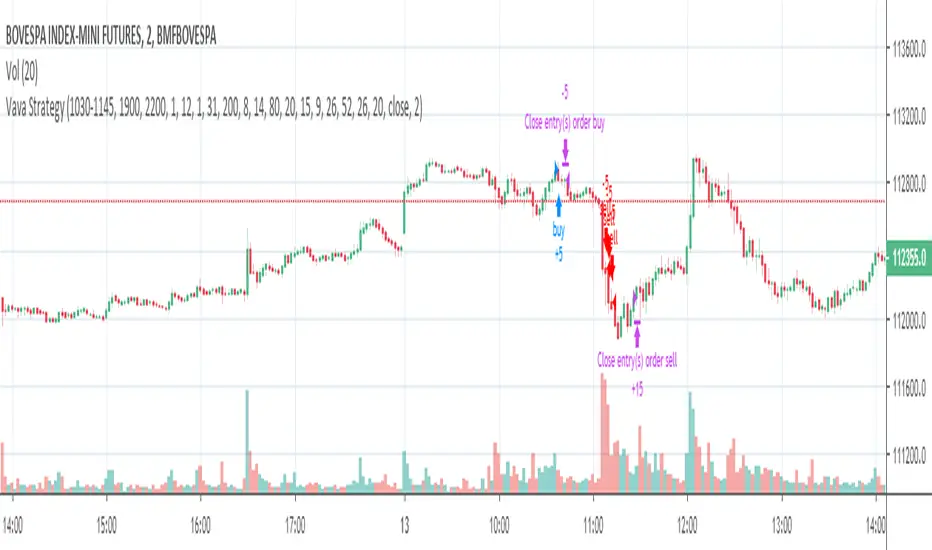
Vava Strategy - Ichimoku Kinko Hyo AdaptedCandlestick
Setup BOVESPA index or mini index, timeframe 2min, Senssion Star: 10:00, Session End:11:45, BB Lenght = 56, pyramiding: 3
Strategy use Ichimoku Cloud, Mfi, trend SMA short and Bollinger Bandas.
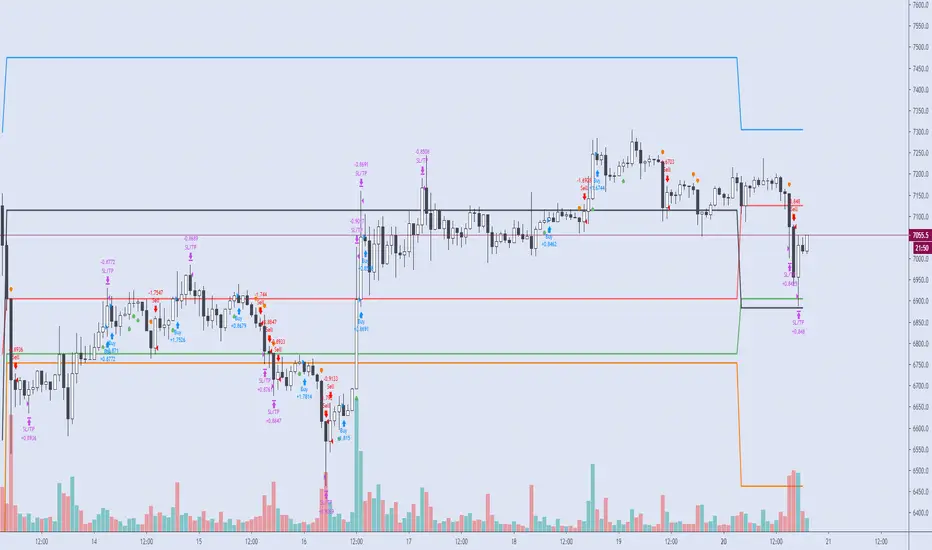
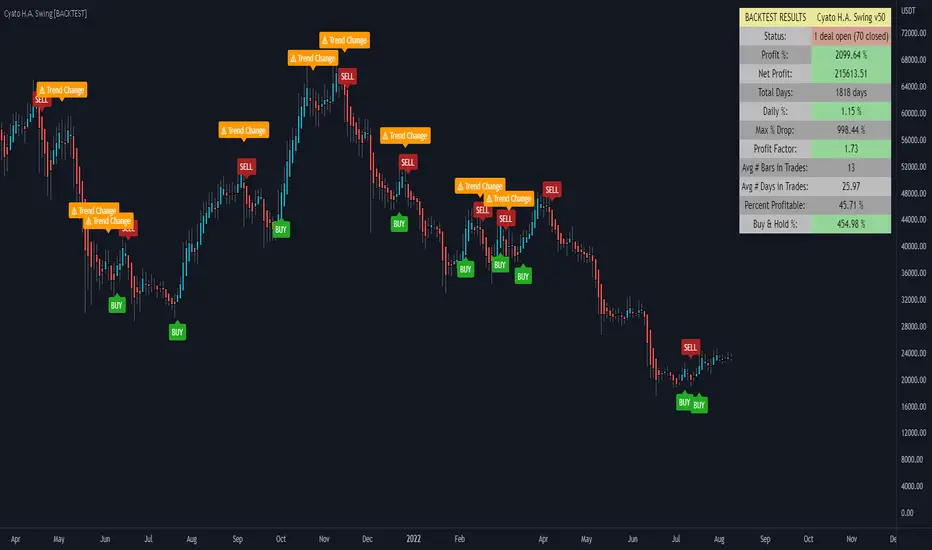
Cyatophilum H.A. Swing [BACKTEST]Hi guys, to celebrate the beginning of a new altcoins cycle, I created a Swing trade Indicator. (It's a joke, there will not be any altcoins cycle)
Cyatophilum Heikin Ashi Swing
This indicator will allow us to create one strategy for each pair and never miss those big swings ever again!
HOW BEAT BUY & HOLD WORKS
This kind of strategy is a safe long term investment , usually played in high timeframes such as 4H, 1D etc.
It is perfect for beginners in trading as the process is very simple: buy and sell when you receive the alert. The high timeframes allows to trade manually by receiving alerts on your phone or email, but you also can automate it if you prefer.
The primary goal of these strategies is to increase your capital faster than someone simply holding the asset .
The trades are made with no leverage and 100% equity . It is for those who want to grow their portfolio fast without risking to lose everything. You can use several strategies at once, in this case split your equity accordingly.
HOW DOES IT WORK?
The Heikin Ashi candles are very usefull. This strategy is built upon H.A. candles but is used on normal candles, because H.A. candles price are an average of real candles and we want to know the real price. I did the trick by recalculating the H.A. open, high, low and close with the original formula based on the real candles's ohlc. This allows me to use the strategy tester and backtest with real results.
HOW TO USE
Creating a signal is as simple as adding the indicator called to your chart and click "Set alert". Select "Once per bar close" for your alert options.
There are 3 alerts:
- BUY
- SELL
- BUY OR SELL (for free TV users)
Sample Backtest results
Bitcoin/Dollar
Ethereum/Bitcoin
Basic Attention Token/Bitcoin
> > Start using the indicator now < <
Note: This version is the BACKTEST. You can find the Alert version in my profile scripts.
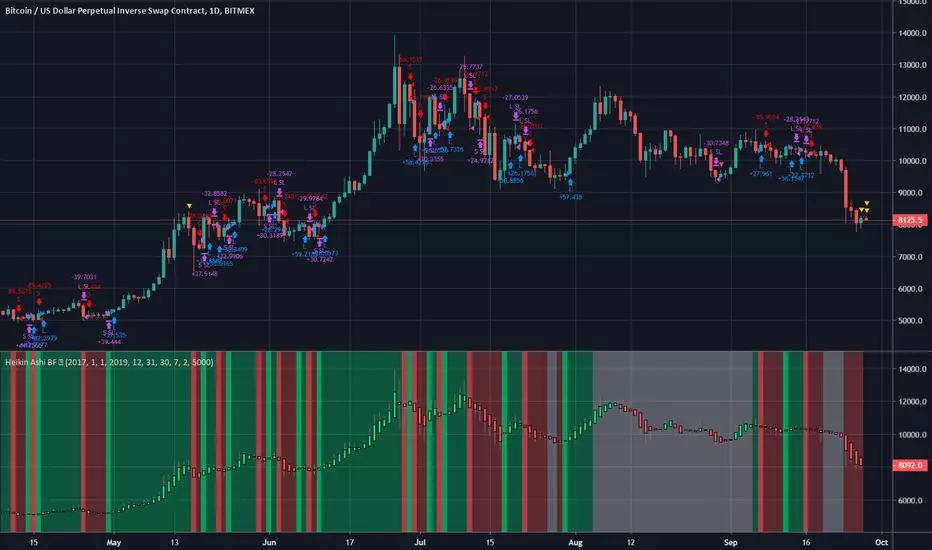
Heiken Ashi BF Heiken Ashi candles help us to identify a trend.
This strategy simply enters a long when the Heiken Ashi candles turn green and a short when they turn red.
Because of the way BTC price moves in medium term trends, this simple strategy seems effective.
There is a rate of change function applied to avoid some of the choppy sideways action (thanks again to kiasaki for the code)
There is a 2% fixed stop loss applied and an optional take-profit setting. You can change both in the settings.
As you can see from the code, this strategy does not enter trades based on the Heiken Ashi closes, rather the actual price close. This is an important distinction since the HA closes are based on an average of the OHLC values so attempting to enter at that price may not always be possible. There are some "strategies" that use this information to try and con people by appearing to have awesome entries that are actually not attainable in all cases.
Green = Long
Red = Short
White = No trade
Renko Plot StrategyThis strategy lets you plot Renko open and close values, based on your preferred Renko size brick, on normal candle chart. You can use it on any timeframe, define your preferred brick size and trailing stop.

ScalperThe scalper allows you to choose entries based on ohlc ratios. Default settings are pyramiding and on order fill. Change the tick value to get acceptable closes for stop orders.
Bearish&Bullish Engulfing (created by LucaBono)Questo indicatore (o price action pattern) stampa sul grafico delle frecce o barre colorate (modificabili dalle impostazioni) quando si verificano entrambi i segnali del Bearish e Bullish Engulfing ufficiali, ovvero quando il corpo della candela è più ampio dell'intera candela precedente.
Il segnale LONG si effettua quando il massimo della Bullish bar viene rotto dalla candela successiva.
Il segnale SHORT viceversa si effettua alla rottura del minimo.
E' più facile trovare questo tipo di segnali su timefrime giornaliero e mercati come azioni, futures e titoli che non stanno aperti 24h.
Consiglio sempre di accompagnare questi segnali ad altri tipi di segnali o analisi per maggiorare le probabilità di successo e di tenuta del trade.
This indicator (or price action pattern) prints on the graph arrows or colored bars (which can be changed from the settings) when both official Bearish and Bullish Engulfing signals occur, ie when the body of the candle is wider than the entire previous candle.
The LONG signal is made when the maximum of the Bullish bar is broken by the next candle.
The SHORT signal, on the other hand, is performed when the minimum is broken.
It is easier to find this type of signals on daily timefrime and markets like stocks, futures and stocks that are not open 24h.
I always advise to accompany these signals to other types of signals or analyzes to increase the chances of success and stability of the trade.

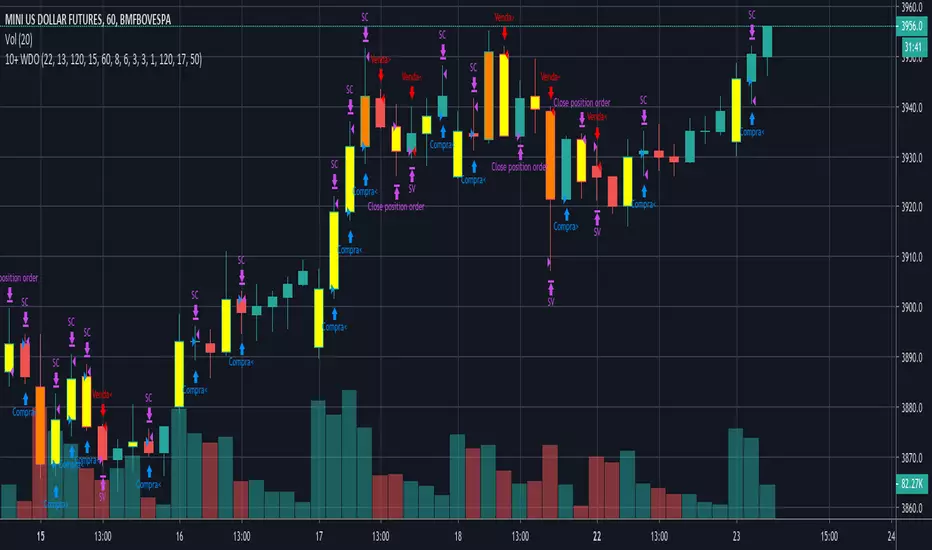
Carlos_Setup 10+ WDOEsta estratégia atua tanto a favor da tendência, quanto contra. O modelo foi criado para ser operado no Dólar e Mini Dólar, mas pode ter as suas configurações ajustadas também para o índice.
O setup padrão é para ser usado no tempo gráfico de 1H, para outros tempos é necessário fazer ajustes nos parâmetros.
Entre as opções que podem ser configuradas estão o Stop Gain e Loss (tanto para as tendências de baixa quanto de alta), Stop Móvel, Ativação para o Stop Móvel e Prejuízo máximo em um dia.
Open Close Cross Strategy // Real Back Test // Not goodI changed close series because, close series doing repaint.
I changed the near series with the previous open series .
but can use for sup and resistance
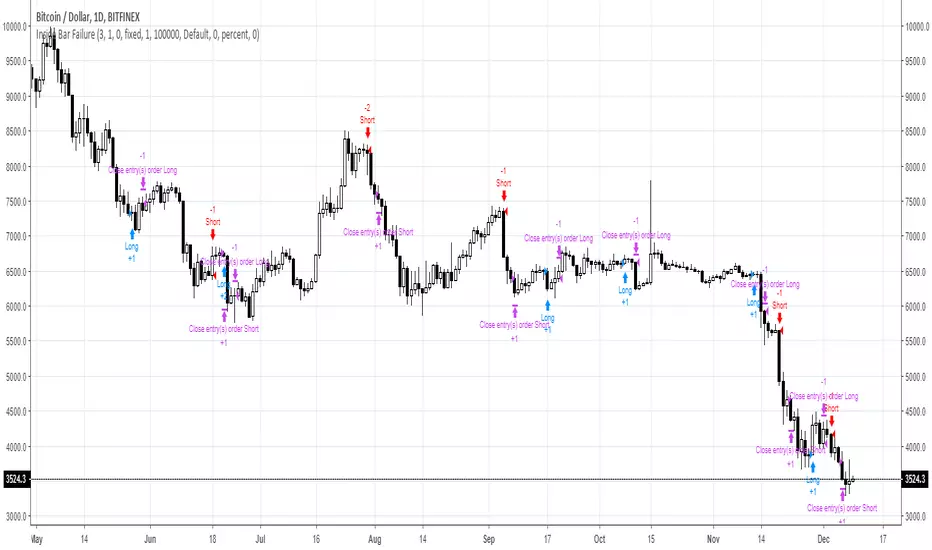
Inside Bar FailureYou can check edge profitability by adjusting the forward looking input, eg. how profitable is this signal after X bars.