MyLibrary_functions_D_S_3D_D_T_PART_1Library "MyLibrary_functions_D_S_3D_D_T_PART_1"
TODO: add library description here
color_(upcolor_txt, upcolor, dncolor_txt, dncolor, theme)
Parameters:
upcolor_txt (color)
upcolor (color)
dncolor_txt (color)
dncolor (color)
theme (string)
Source_Zigzag_F(Source)
Parameters:
Source (string)
p_lw_hg(Source_low, Source_high, Depth)
Parameters:
Source_low (float)
Source_high (float)
Depth (int)
lowing_highing(Source_low, Source_high, p_lw, p_hg, Deviation)
Parameters:
Source_low (float)
Source_high (float)
p_lw (int)
p_hg (int)
Deviation (int)
ll_lh(lowing, highing)
Parameters:
lowing (bool)
highing (bool)
down_ll_down_lh(ll, lh, Backstep)
Parameters:
ll (int)
lh (int)
Backstep (int)
down(down_ll, down_lh, lw, hg)
Parameters:
down_ll (bool)
down_lh (bool)
lw (int)
hg (int)
f_x_P_S123_lw(lw_, hg_, p_lw_, down, Source_low)
Parameters:
lw_ (int)
hg_ (int)
p_lw_ (int)
down (int)
Source_low (float)
f_x_P_S123_hg(lw_, hg_, p_hg_, down, Source_high)
Parameters:
lw_ (int)
hg_ (int)
p_hg_ (int)
down (int)
Source_high (float)
Update_lw_hg_last_l_last_h(lw, hg, last_l, last_h, p_lw, p_hg, down, Source_low, Source_high)
Parameters:
lw (int)
hg (int)
last_l (int)
last_h (int)
p_lw (int)
p_hg (int)
down (int)
Source_low (float)
Source_high (float)
x1_P_y1_P_x2_P_y2_P_x3_P_y3_P_x4_P_y4_P(lw, hg, last_l, last_h, Source)
Parameters:
lw (int)
hg (int)
last_l (int)
last_h (int)
Source (string)
x1_P_os(lw, hg, x2_D, Diverjence_MACD_Line_, Diverjence_MACD_Histagram_, Diverjence_RSI_, Diverjence_Stochastic_, Diverjence_volume_, Diverjence_CCI_, Diverjence_MFI_, Diverjence_Momentum_, Diverjence_OBV_, Diverjence_ADX_, MACD, hist_MACD, RSI, volume_ok, Stochastic_K, CCI, MFI, momentum, OBV, adx)
Parameters:
lw (int)
hg (int)
x2_D (int)
Diverjence_MACD_Line_ (bool)
Diverjence_MACD_Histagram_ (bool)
Diverjence_RSI_ (bool)
Diverjence_Stochastic_ (bool)
Diverjence_volume_ (bool)
Diverjence_CCI_ (bool)
Diverjence_MFI_ (bool)
Diverjence_Momentum_ (bool)
Diverjence_OBV_ (bool)
Diverjence_ADX_ (bool)
MACD (float)
hist_MACD (float)
RSI (float)
volume_ok (float)
Stochastic_K (float)
CCI (float)
MFI (float)
momentum (float)
OBV (float)
adx (float)
x3_P_os(lw, hg, x2_D, x4_D, Diverjence_MACD_Line_, Diverjence_MACD_Histagram_, Diverjence_RSI_, Diverjence_Stochastic_, Diverjence_volume_, Diverjence_CCI_, Diverjence_MFI_, Diverjence_Momentum_, Diverjence_OBV_, Diverjence_ADX_, MACD, hist_MACD, RSI, volume_ok, Stochastic_K, CCI, MFI, momentum, OBV, adx)
Parameters:
lw (int)
hg (int)
x2_D (int)
x4_D (int)
Diverjence_MACD_Line_ (bool)
Diverjence_MACD_Histagram_ (bool)
Diverjence_RSI_ (bool)
Diverjence_Stochastic_ (bool)
Diverjence_volume_ (bool)
Diverjence_CCI_ (bool)
Diverjence_MFI_ (bool)
Diverjence_Momentum_ (bool)
Diverjence_OBV_ (bool)
Diverjence_ADX_ (bool)
MACD (float)
hist_MACD (float)
RSI (float)
volume_ok (float)
Stochastic_K (float)
CCI (float)
MFI (float)
momentum (float)
OBV (float)
adx (float)
Err_test(lw, hg, x1, y1, x2, y2, y_d, start, finish, Err_Rate)
Parameters:
lw (int)
hg (int)
x1 (int)
y1 (float)
x2 (int)
y2 (float)
y_d (float)
start (int)
finish (int)
Err_Rate (float)
divergence_calculation(Feasibility_RD, Feasibility_HD, Feasibility_ED, lw, hg, Source_low, Source_high, x1_P_pr, x3_P_pr, x1_P_os, x3_P_os, x2_P_pr, x4_P_pr, oscillator, Fix_Err_Mid_Point_Pr, Fix_Err_Mid_Point_Os, Err_Rate_permissible_Mid_Line_Pr, Err_Rate_permissible_Mid_Line_Os, Number_of_price_periods_R_H, Permissible_deviation_factor_in_Pr_R_H, Number_of_oscillator_periods_R_H, Permissible_deviation_factor_in_OS_R_H, Number_of_price_periods_E, Permissible_deviation_factor_in_Pr_E, Number_of_oscillator_periods_E, Permissible_deviation_factor_in_OS_E)
Parameters:
Feasibility_RD (bool)
Feasibility_HD (bool)
Feasibility_ED (bool)
lw (int)
hg (int)
Source_low (float)
Source_high (float)
x1_P_pr (int)
x3_P_pr (int)
x1_P_os (int)
x3_P_os (int)
x2_P_pr (int)
x4_P_pr (int)
oscillator (float)
Fix_Err_Mid_Point_Pr (bool)
Fix_Err_Mid_Point_Os (bool)
Err_Rate_permissible_Mid_Line_Pr (float)
Err_Rate_permissible_Mid_Line_Os (float)
Number_of_price_periods_R_H (int)
Permissible_deviation_factor_in_Pr_R_H (float)
Number_of_oscillator_periods_R_H (int)
Permissible_deviation_factor_in_OS_R_H (float)
Number_of_price_periods_E (int)
Permissible_deviation_factor_in_Pr_E (float)
Number_of_oscillator_periods_E (int)
Permissible_deviation_factor_in_OS_E (float)
label_txt(label_ID, zigzag_Indicator_1_, zigzag_Indicator_2_, zigzag_Indicator_3_)
Parameters:
label_ID (string)
zigzag_Indicator_1_ (bool)
zigzag_Indicator_2_ (bool)
zigzag_Indicator_3_ (bool)
delet_scan_item_1(string_, NO_1, GAP)
Parameters:
string_ (string)
NO_1 (int)
GAP (int)
delet_scan_item_2(string_, NO_1, GAP)
Parameters:
string_ (string)
NO_1 (int)
GAP (int)
calculation_Final_total(MS_MN, Scan_zigzag_NO, zigzag_Indicator, zigzag_Indicator_1, zigzag_Indicator_2, zigzag_Indicator_3, LW_hg_P2, LW_hg_P1, lw_1, lw_2, lw_3, hg_1, hg_2, hg_3, lw_hg_D_POINT_ad_Array, lw_hg_D_POINT_id_Array, Array_Regular_MS, Array_Hidden_MS, Array_Exaggerated_MS, Array_Regular_MN, Array_Hidden_MN, Array_Exaggerated_MN)
Parameters:
MS_MN (string)
Scan_zigzag_NO (string)
zigzag_Indicator (bool)
zigzag_Indicator_1 (bool)
zigzag_Indicator_2 (bool)
zigzag_Indicator_3 (bool)
LW_hg_P2 (int)
LW_hg_P1 (int)
lw_1 (int)
lw_2 (int)
lw_3 (int)
hg_1 (int)
hg_2 (int)
hg_3 (int)
lw_hg_D_POINT_ad_Array (array)
lw_hg_D_POINT_id_Array (array)
Array_Regular_MS (array)
Array_Hidden_MS (array)
Array_Exaggerated_MS (array)
Array_Regular_MN (array)
Array_Hidden_MN (array)
Array_Exaggerated_MN (array)
Search_piote_1(array_id_7, scan_no)
Parameters:
array_id_7 (array)
scan_no (int)
ค้นหาในสคริปต์สำหรับ "CCI"

Composite Momentum IndicatorComposite Momentum Indicator" combines the signals from several oscillators, including Stochastic, RSI, Ultimate Oscillator, and Commodity Channel Index (CCI) by averaging the standardized values (Z-Scores). Since it is a Z-Score based indicators the values will be typically be bound between +3 and -3 oscillating around 0. Here's a summary of the code:
Input Parameters: Users can customize the look-back period and set threshold values for overbought and oversold conditions. They can also choose which oscillators to include in the composite calculation.
Oscillator Calculations: The code calculates four separate oscillators - Stochastic, RSI, Ultimate Oscillator, and CCI - each measuring different aspects of market momentum.
Z-Scores Calculation: For each oscillator, the code calculates a Z-Score, which normalizes the oscillator's values based on its historical standard deviation and mean. This allows for a consistent comparison of oscillator values across different timeframes.
Composite Z-Score: The code aggregates the Z-Scores from the selected oscillators, taking into account user preferences (whether to include each oscillator). It then calculates an average Z-Score to create the "Composite Momentum Oscillator."
Conditional Color Coding: The composite oscillator is color-coded based on its average Z-Score value. It turns green when it's above the overbought threshold, red when it's below the oversold threshold, and blue when it's within the specified range.
Horizontal Lines: The code plots horizontal lines at key levels, including 0, ±3, ±2, and ±1, to help users identify important momentum levels.
Gradient Fills: It adds gradient fills above the overbought threshold and below the oversold threshold to visually highlight extreme momentum conditions.
Combining the Stochastic, RSI, Ultimate Oscillator, and Commodity Channel Index (CCI) into one composite indicator offers several advantages for traders and technical analysts:
Comprehensive Insight: Each of these oscillators measures different aspects of market momentum and price action. Combining them into one indicator provides a more comprehensive view of the market's behavior, as it takes into account various dimensions of momentum simultaneously.
Reduced Noise: Standalone oscillators can generate conflicting signals and produce noisy readings, especially during choppy market conditions. A composite indicator smoothes out these discrepancies by averaging the signals from multiple indicators, potentially reducing false signals.
Confirmation and Divergence: By combining multiple oscillators, traders can seek confirmation or divergence signals. When multiple oscillators align in the same direction, it can strengthen a trading signal. Conversely, divergence between the oscillators can warn of potential reversals or weakening trends.
Customization: Traders can tailor the composite indicator to their specific trading strategies and preferences. They have the flexibility to include or exclude specific oscillators, adjust look-back periods, and set threshold levels. This adaptability allows for a more personalized approach to technical analysis.
Clarity and Efficiency: Rather than cluttering the chart with multiple individual oscillators, a composite indicator condenses the information into a single plot. This enhances the clarity of the chart and makes it easier for traders to quickly interpret market conditions.
Overbought/Oversold Identification: Combining these oscillators can improve the identification of overbought and oversold conditions. It reduces the likelihood of false signals since multiple indicators must align to trigger these extreme conditions.
Educational Tool: For novice traders and analysts, a composite indicator can serve as an educational tool by demonstrating how different oscillators interact and influence each other's signals. It allows users to learn about multiple technical indicators in one glance.
Efficient Use of Screen Space: A single composite indicator occupies less screen space compared to multiple separate indicators. This is especially beneficial when analyzing multiple markets or timeframes simultaneously.
Holistic Approach: Instead of relying on a single indicator, a composite approach encourages a more holistic assessment of market conditions. Traders can consider a broader range of factors before making trading decisions.
Increased Confidence: A composite indicator can boost traders' confidence in their decisions. When multiple reliable indicators align, it can provide a stronger basis for taking action in the market.
In summary, combining the Stochastic, RSI, Ultimate Oscillator, and CCI into one composite indicator enhances the depth and reliability of technical analysis. It simplifies the decision-making process, reduces noise, and offers a more complete picture of market momentum, ultimately helping traders make more informed and well-rounded trading decisions.
* Feel free to compare against individual oscillatiors*

Reversion Zone IndexThe Reversion Zone Index (RZI) is an indicator that combines the Commodity Channel Index (CCI), Choppiness Index (CI), and Bollinger Bands Percentage (BBPct) to identify mean reversion signals in the market. It is plotted as an Exponential Moving Average (EMA) smoothed oscillator with overbought and oversold zones, and mean reversion signals are represented by red and green arrows.
The three indicators are combined to benefit from their complementary aspects and create a more comprehensive view of mean reversion conditions. Here's a brief overview of each indicator's benefits:
1. Commodity Channel Index (CCI): CCI measures the current price level relative to its average over a specified period. It helps identify overbought and oversold conditions, as well as potential trend retracements. By incorporating CCI, the RZI gains insights into momentum and potential turning points.
2. Choppiness Index (CI): CI quantifies the market's choppiness or trendiness by analyzing the range between the highest high and lowest low over a specific period. It indicates whether the market is in a trending or ranging phase. CI provides valuable information about the market state, which can be useful in mean reversion analysis.
3. Bollinger Bands Percentage (BBPct): BBPct measures the current price's position relative to the Bollinger Bands. It calculates the percentage difference between the current price and the bands, identifying potential overbought or oversold conditions. BBPct helps gauge the market's deviation from its typical behavior and highlights potential reversal opportunities.
The RZI combines the three indicators by taking an average of their values and applying further calculations. It smooths the combined oscillator using an EMA to reduce noise and enhance the visibility of the trends. Smoothing with EMA provides a more responsive representation of the overall trend and helps filter out short-term fluctuations.
The overbought and oversold zones are marked on the chart as reference levels. When the combined oscillator is above the overbought zone or below the oversold zone, it suggests a potential mean reversion signal. Red and green arrows are displayed to visually indicate these mean retracement signals.
The RZI is a valuable tool for identifying mean reversion opportunities in the market. It incorporates multiple indicators, each providing unique insights into different aspects of mean reversion, such as momentum, volatility, and price positioning. Traders can use this indicator to spot potential turning points and time their trades accordingly.

EventsLibrary "Events"
events()
Returns the list of dates supported by this library as a string array.
Returns: array : Names of events supported by this library
fomcMeetings()
Gets the FOMC Meeting Dates. The FOMC meets eight times a year to determine the course of monetary policy. The FOMC announces its decision on the federal funds rate at the conclusion of each meeting and also issues a statement that provides information on the economic outlook and the Committee's assessment of the risks to the outlook.
Returns: array : FOMC Meeting Dates as timestamps
fomcMinutes()
Gets the FOMC Meeting Minutes Dates. The FOMC Minutes are released three weeks after each FOMC meeting. The Minutes provide information on the Committee's deliberations and decisions at the meeting.
Returns: array : FOMC Meeting Minutes Dates as timestamps
ppiReleases()
Gets the Producer Price Index (PPI) Dates. The Producer Price Index (PPI) measures the average change over time in the selling prices received by domestic producers for their output. The PPI is a leading indicator of CPI, and CPI is a leading indicator of inflation.
Returns: array : PPI Dates as timestamps
cpiReleases()
Gets the Consumer Price Index (CPI) Rekease Dates. The Consumer Price Index (CPI) measures changes in the price level of a market basket of consumer goods and services purchased by households. The CPI is a leading indicator of inflation.
Returns: array : CPI Dates as timestamps
csiReleases()
Gets the CSI release dates. The Consumer Sentiment Index (CSI) is a survey of consumer attitudes about the economy and their personal finances. The CSI is a leading indicator of consumer spending.
Returns: array : CSI Dates as timestamps
cciReleases()
Gets the CCI release dates. The Conference Board's Consumer Confidence Index (CCI) is a survey of consumer attitudes about the economy and their personal finances. The CCI is a leading indicator of consumer spending.
Returns: array : CCI Dates as timestamps
nfpReleases()
Gets the NFP release dates. Nonfarm payrolls is an employment report released monthly by the Bureau of Labor Statistics (BLS) that measures the change in the number of employed people in the United States.
Returns: array : NFP Dates as timestamps
eciReleases()
Gets the ECI The Employment Cost Index (ECI) is a measure of the change in the cost of labor,

SH_LibraryLibrary "SH_Library"
events()
Returns the list of dates supported by this library as a string array.
Returns: array : Names of events supported by this library
fomcMeetings()
Gets the FOMC Meeting Dates. The FOMC meets eight times a year to determine the course of monetary policy. The FOMC announces its decision on the federal funds rate at the conclusion of each meeting and also issues a statement that provides information on the economic outlook and the Committee's assessment of the risks to the outlook.
Returns: array : FOMC Meeting Dates as timestamps
fomcMinutes()
Gets the FOMC Meeting Minutes Dates. The FOMC Minutes are released three weeks after each FOMC meeting. The Minutes provide information on the Committee's deliberations and decisions at the meeting.
Returns: array : FOMC Meeting Minutes Dates as timestamps
ppiReleases()
Gets the Producer Price Index (PPI) Dates. The Producer Price Index (PPI) measures the average change over time in the selling prices received by domestic producers for their output. The PPI is a leading indicator of CPI, and CPI is a leading indicator of inflation.
Returns: array : PPI Dates as timestamps
cpiReleases()
Gets the Consumer Price Index (CPI) Rekease Dates. The Consumer Price Index (CPI) measures changes in the price level of a market basket of consumer goods and services purchased by households. The CPI is a leading indicator of inflation.
Returns: array : CPI Dates as timestamps
csiReleases()
Gets the CSI release dates. The Consumer Sentiment Index (CSI) is a survey of consumer attitudes about the economy and their personal finances. The CSI is a leading indicator of consumer spending.
Returns: array : CSI Dates as timestamps
cciReleases()
Gets the CCI release dates. The Conference Board's Consumer Confidence Index (CCI) is a survey of consumer attitudes about the economy and their personal finances. The CCI is a leading indicator of consumer spending.
Returns: array : CCI Dates as timestamps
nfpReleases()
Gets the NFP release dates. Nonfarm payrolls is an employment report released monthly by the Bureau of Labor Statistics (BLS) that measures the change in the number of employed people in the United States.
Returns: array : NFP Dates as timestamps
eciReleases()
Gets the ECI The Employment Cost Index (ECI) is a measure of the change in the cost of labor,

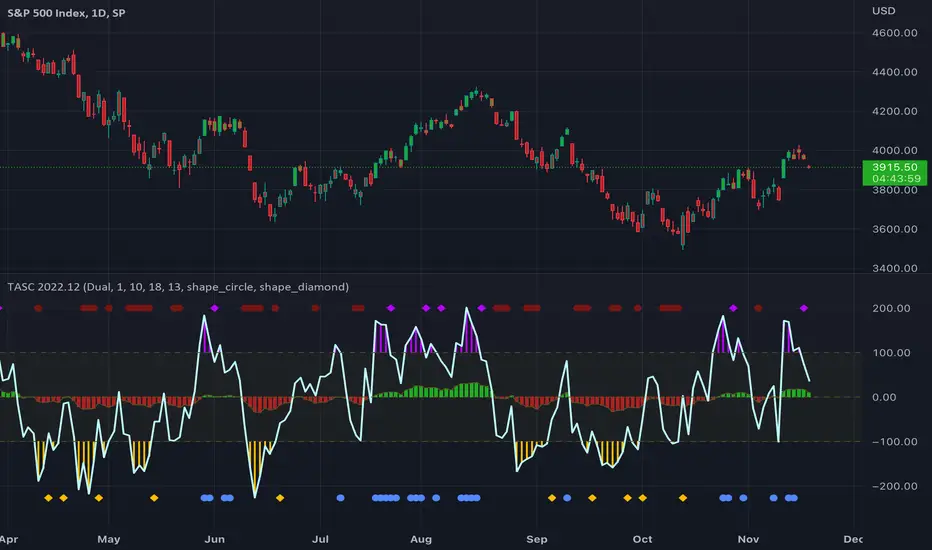
TASC 2022.12 Short-Term Continuation And Reversal Signals█ OVERVIEW
TASC's December 2022 edition Traders' Tips includes an article by Barbara Star titled "Short-Term Continuation And Reversal Signals". This is the code that implements the concepts presented in this publication.
█ CONCEPTS
The article takes two classic indicators, the Commodity Channel Index (CCI) and the Directional Movement Indicator (DMI), makes changes to the traditional ways of visualizing their readings, and uses them together to generate potential signals. The author first discusses the benefits of converting the DMI indicator to an oscillator format by subtracting the −DI from the +DI, which is then displayed as a histogram. Next, the author shows how the use of an on-chart visual framework (i.e., choosing the line style and color, coloring price bars, etc.) can help traders interpret the signals produced the considered pair of indicators.
█ CALCULATIONS
The article offers the following signals based on the readings of the DMI and CCI pair, suitable for several types of trades:
• Short-term trend change signals:
A DMI oscillator above zero indicates that prices are in an uptrend. A DMI oscillator below the zero line and falling means that selling pressure is dominating and price is trending down. The sign of the DMI oscillator is indicated by the color of the price bars (which correlates with the color of the DMI histogram). Namely, green, red and grey price bars correspond to the DMI oscillator above, below and equal to zero . Colored price bars and the DMI oscillator make it easy for trend traders to recognize changes in short-term trends.
• Trend continuation signals:
Blue circles appear near the bottom of the oscillator chart border when the DMI is above the zero line and the price is above its simple moving average in an uptrend . Dark red circles appear near the top of the chart in a downtrend when the DMI oscillator is below its zero line and below the 18-period moving average. Trend continuation signals are useful for those looking to add to existing positions, as well as for traders waiting for a pullback after a trend has started.
• Reversal signals:
The CCI signals a reversal to the downside when it breaks out of its +100 and then returns at some point, crossing below the +100 level. This is indicated by a magenta-colored diamond shape near the top the chart. The CCI signals a reversal to the upside when it moves below its −100 level and then at some point comes back to cross above the −100 level. This is indicated by a yellow diamond near the bottom of the chart. Reversal signals offer short-term rallies for countertrend traders as well as for swing traders looking for longer-term moves using the interplay between continuation and reversal signals.
EconomicCalendarLibrary "EconomicCalendar"
This library is a data provider for important dates and times from the Economic Calendar.
events()
Returns the list of dates supported by this library as a string array.
Returns: array : Names of events supported by this library
fomcMeetings()
Gets the FOMC Meeting Dates. The FOMC meets eight times a year to determine the course of monetary policy. The FOMC announces its decision on the federal funds rate at the conclusion of each meeting and also issues a statement that provides information on the economic outlook and the Committee's assessment of the risks to the outlook.
Returns: array : FOMC Meeting Dates as timestamps
fomcMinutes()
Gets the FOMC Meeting Minutes Dates. The FOMC Minutes are released three weeks after each FOMC meeting. The Minutes provide information on the Committee's deliberations and decisions at the meeting.
Returns: array : FOMC Meeting Minutes Dates as timestamps
ppiReleases()
Gets the Producer Price Index (PPI) Dates. The Producer Price Index (PPI) measures the average change over time in the selling prices received by domestic producers for their output. The PPI is a leading indicator of CPI, and CPI is a leading indicator of inflation.
Returns: array : PPI Dates as timestamps
cpiReleases()
Gets the Consumer Price Index (CPI) Rekease Dates. The Consumer Price Index (CPI) measures changes in the price level of a market basket of consumer goods and services purchased by households. The CPI is a leading indicator of inflation.
Returns: array : CPI Dates as timestamps
csiReleases()
Gets the CSI release dates. The Consumer Sentiment Index (CSI) is a survey of consumer attitudes about the economy and their personal finances. The CSI is a leading indicator of consumer spending.
Returns: array : CSI Dates as timestamps
cciReleases()
Gets the CCI release dates. The Conference Board's Consumer Confidence Index (CCI) is a survey of consumer attitudes about the economy and their personal finances. The CCI is a leading indicator of consumer spending.
Returns: array : CCI Dates as timestamps
nfpReleases()
Gets the NFP release dates. Nonfarm payrolls is an employment report released monthly by the Bureau of Labor Statistics (BLS) that measures the change in the number of employed people in the United States.
Returns: array : NFP Dates as timestamps

Buy / Sell alert indicator [Crypto_BCT]Hello everyone!
I bring to your attention a indicator to determine the point of buy and sell purchase.
It is based on oscillators and a moving average.
It can be used to work with bots, for example 3COMMAS DCA bot.
Signal Condition Settings:
ATR
The current candle is larger than the ATR for this period
EMA
The signal is necessarily below (for buy) and above (for sell) the EMA of the specified period
(Buy) RSI low
The RSI index is below this value
(Sell) RSI High
The RSI index is higher than this value
(Buy) MFI low
The MFI index is below this value
(Sell) MFI High
The MFI index is higher than this value
(Buy) CCI low
CCI index is below this value
(Sell) CCI High
The CCI index is higher than this value
(Buy) Lowest bar from
The closing of the current bar is lower than the closing of the bars back in this range
(Sell) Highest bar from
The closing of the current bar is higher than the closing of bars in this range
(Buy) Lowest EMA bar ago
During a given distance back, the EMA value only decreased
(Sell) Highest EMA bar ago
At a given distance back, the EMA value only increased
I hope it will be useful!

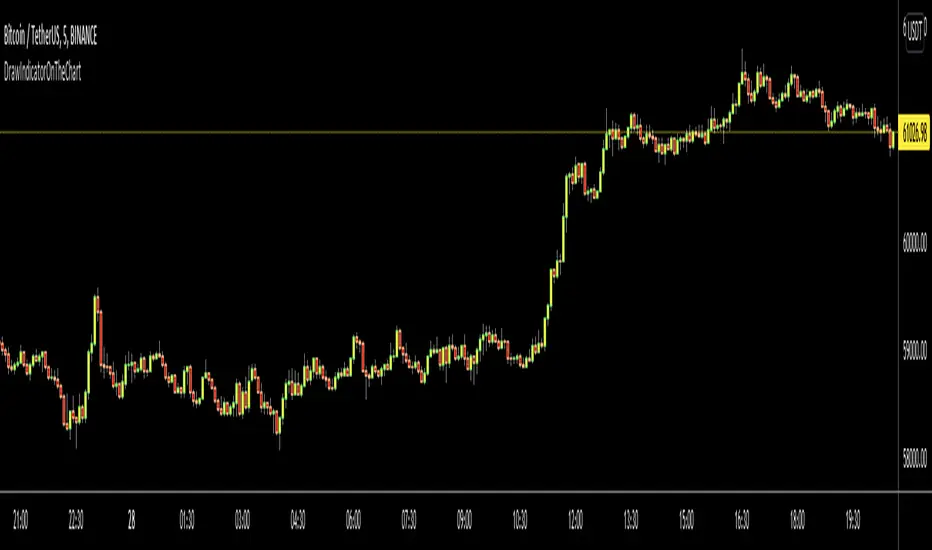
DrawIndicatorOnTheChartLibrary "DrawIndicatorOnTheChart"
this library is used to show an indicator (such RSI, CCI, MOM etc) on the main chart with indicator's horizontal lines in a window. Location of the window is calculated dynamically by last price movemements
drawIndicator(indicatorName, indicator, indicatorcolor, period, indimax_, indimin_, levels, precision, xlocation) draws the related indicator on the chart
Parameters:
indicatorName : is the indicator name as string such "RSI", "CCI" etc
indicator : is the indicator you want to show, such rsi(close, 14), mom(close, 10) etc
indicatorcolor : is the color of indicator line
period : is the length of the window to show
indimax_ : is the maximum value of the indicator, for example for RSI it's 100.0, if the indicator (such CCI, MOM etc) doesn't have maximum value then use "na"
indimin_ : is the minimum value of the indicator, for example for RSI it's 0.0, if the indicator (such CCI, MOM etc)doesn't have maximum value then use "na"
levels : is the levels of the array for the horizontal lines. for example if you want horizontal lines at 30.0, and 70.0 then use array.from(30.0, 70.0). if no horizontal lines then use array.from(na)
precision : is the precision/number of decimals that is used to show indicator values, for example for RSI set it 2
xlocation : is end location of the indicator window, for example if xlocation = 0 window is created on the index of the last bar/candle
Returns: none
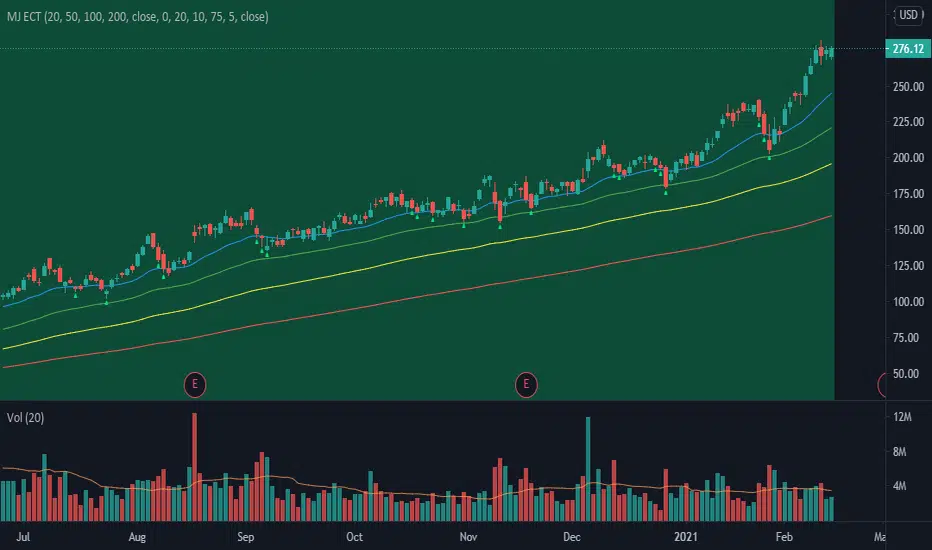
MJ ECT== One Line Introduction ==
ECT is a multi-level, trend focused technical indicator based on a three-step hierarchical approach - comprising the tide, wave, and ripple - to trend identification.
== Indicator Philosophy ==
The author believes that market trends can be understood in a three-step hierarchy, with tide at the top, wave in the middle, and ripple at the bottom, corresponding to long-, middle-, and short-term momentum in the stock price. This indicator therefore comprises three technical indicators which aims to reflect the abovementioned features of a trend. These three components are True Strength Index (TSI), Exponential Moving Averages ( EMA ), and Commodity Channel Index ( CCI ).
== Indicator Components and Breakdown ==
True Strength Index (TSI) -> Tide
A 20-period TSI is used to visualize the bullish or bearish sentiment surrounding the stock. Crossovers above the zero line are interpreted as bullish while crossovers below the zero line are interpreted as bearish . This is painted into the background where green represents bullish and red represents bearish . While the background is red ( bearish ), no bullish positions should be taken. Hence, the TSI painted background acts as a directional bias filter and going against the bias is not recommended. After understanding the directional bias, the user can delve further into the areas of value for the stock in the Wave.
Exponential Moving Averages ( EMA ) -> Wave
Four EMA are used (20, 50, 100, 200) to identify the dynamic support and resistance waves in a trending market. Stock price pullbacks into any of these EMA represent areas of value where the user can consider taking positions. The correct EMA to use depends on individual stock's behavior, with multiple bounces on a specified EMA being the priority. After understanding which wave best reflects the area of value of a stock, the user can move on to the Ripple to time their entries.
Commodity Channel Index ( CCI ) -> Ripple
A 5-period CCI is used to identify short-term oversold conditions where prices are on discount. Discount is defined by the 5-period CCI crossing below -100 as it reflects a weekly oversold condition. The indicator will display a small triangle below the candle when this condition is met.
== Ready To Deploy Field Manual ==
When background is painted red, do nothing.
When background is painted green, begin thinking of bullish opportunities.
Look for the specific EMA that has the most bounces of stock price in recent months, this is the area of value to look for buying opportunity.
For the candles that intersect the EMA you identified above, watch for the appearance of a small triangle below the candle that tells you the entry timing.
When the entry timing signal triangle appears, remember the High of that candle and buy your position when the subsequent candle breaks above this High.
If the High is not broken above in the next immediate candle, remember the newer High of the newer candle (basically follow / trail the latest High until a break above is hit).
If the background turns from green to red, stop following the High and do not enter because the market sentiment has changed to bearish .
If you are holding an existing position and the background turns red, consider exiting the position. You may consider remembering the Low of the candle and exit your position if this Low is broken below on a subsequent candle.
== Best Wishes ==
The author wishes the best success for all users of this technical indicator.
Improved Commodity Channel IndexI took the normal CCI version and I made it better and more pleasantly visual.
At the same time now the CCI changes color based on the direction is going to take
We also have more levels, to define even better the current situation.
Details are simple :
green color cci = uptrend - > buy
red color cci = downtrend - > sell
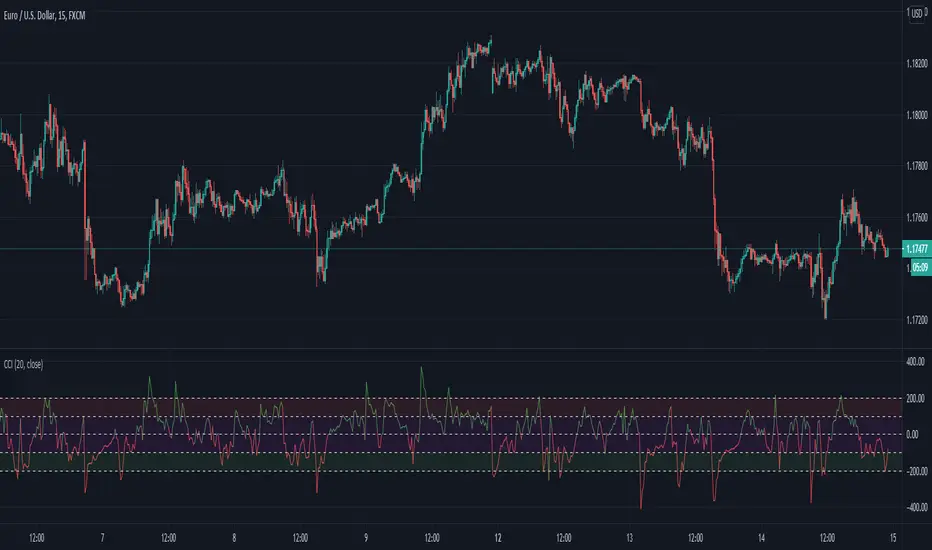
Inverse Fisher Transform COMBOThis indicator is the one scripted and published by KIVANCfr3762 (fr3762 @twitter), only difference is the IFT Stochastic Momentum line to be added and also included for average IFT line calculation. Both IFT CCI and IFT CCI V2 lines are included within this script. With the options/settings menu, the lines can be added/removed for displaying on the chart up to preferences.
İndikatör , Kıvanç ( KIVANCfr3762 (fr3762 @twitter) ) hocamızın daha önceden yayınladığı indikatördür, Buna, IFT Stochastic Momentumu ekledim, ve tabi bu hesaplamayı ortalama IFT çizgisi hesabına da dahil ettim. IFT CCI ve IFT CCI V2 iki çizgi de ayrı ayrı indikatörün içinde bulunmaktadır. İstenilenler ayarlar kısmındaki kutucuklardan işaretlenerek/kaldırılarak grafiğin üzerinde gösterimi sağlanabilir.

CK INDEX Strategy Open-source code, Free, No Cost.Aqui está a tradução fiel e técnica para o inglês, ideal para a descrição do seu script no TradingView:
### 1. Requirements (The 3 Principles)
1. **Study** the code.
2. **Modify** the code.
3. **Distribute** copies or derivative versions (respecting the original credits).
Description: Direction and Strength — CK Index
The **CK Index** is a composite indicator formed by the conceptual sum of two CCIs and the PVT (Price Volume Trend) with an arithmetic mean. Its function is to simultaneously validate direction and accumulated flow.
For a **buy operation**, both CCIs must be above zero, indicating bullish dominance across different time horizons, and the PVT must be above its average. For a **sell operation**, the CCIs must be below zero and the PVT below its average.
It is important to emphasize that it acts as an **entry trigger**: the candle will turn **blue** to indicate a buy, **yellow** for a sell, and **white** when there is neutrality (meaning the color will be white when there is no clear definition—these are my personal settings). In its default form, it uses **green, red, and gray**, respectively.
Good trades, and make the world a better and freer place!

Static K-means Clustering | InvestorUnknownStatic K-Means Clustering is a machine-learning-driven market regime classifier designed for traders who want a data-driven structure instead of subjective indicators or manually drawn zones.
This script performs offline (static) K-means training on your chosen historical window. Using four engineered features:
RSI (Momentum)
CCI (Price deviation / Mean reversion)
CMF (Money flow / Strength)
MACD Histogram (Trend acceleration)
It groups past market conditions into K distinct clusters (regimes). After training, every new bar is assigned to the nearest cluster via Euclidean distance in 4-dimensional standardized feature space.
This allows you to create models like:
Regime-based long/short filters
Volatility phase detectors
Trend vs. chop separation
Mean-reversion vs. breakout classification
Volume-enhanced money-flow regime shifts
Full machine-learning trading systems based solely on regimes
Note:
This script is not a universal ML strategy out of the box.
The user must engineer the feature set to match their trading style and target market.
K-means is a tool, not a ready made system, this script provides the framework.
Core Idea
K-means clustering takes raw, unlabeled market observations and attempts to discover structure by grouping similar bars together.
// STEP 1 — DATA POINTS ON A COORDINATE PLANE
// We start with raw, unlabeled data scattered in 2D space (x/y).
// At this point, nothing is grouped—these are just observations.
// K-means will try to discover structure by grouping nearby points.
//
// y ↑
// |
// 12 | •
// | •
// 10 | •
// | •
// 8 | • •
// |
// 6 | •
// |
// 4 | •
// |
// 2 |______________________________________________→ x
// 2 4 6 8 10 12 14
//
//
//
// STEP 2 — RANDOMLY PLACE INITIAL CENTROIDS
// The algorithm begins by placing K centroids at random positions.
// These centroids act as the temporary “representatives” of clusters.
// Their starting positions heavily influence the first assignment step.
//
// y ↑
// |
// 12 | •
// | •
// 10 | • C2 ×
// | •
// 8 | • •
// |
// 6 | C1 × •
// |
// 4 | •
// |
// 2 |______________________________________________→ x
// 2 4 6 8 10 12 14
//
//
//
// STEP 3 — ASSIGN POINTS TO NEAREST CENTROID
// Each point is compared to all centroids.
// Using simple Euclidean distance, each point joins the cluster
// of the centroid it is closest to.
// This creates a temporary grouping of the data.
//
// (Coloring concept shown using labels)
//
// - Points closer to C1 → Cluster 1
// - Points closer to C2 → Cluster 2
//
// y ↑
// |
// 12 | 2
// | 1
// 10 | 1 C2 ×
// | 2
// 8 | 1 2
// |
// 6 | C1 × 2
// |
// 4 | 1
// |
// 2 |______________________________________________→ x
// 2 4 6 8 10 12 14
//
// (1 = assigned to Cluster 1, 2 = assigned to Cluster 2)
// At this stage, clusters are formed purely by distance.
Your chosen historical window becomes the static training dataset , and after fitting, the centroids never change again.
This makes the model:
Predictable
Repeatable
Consistent across backtests
Fast for live use (no recalculation of centroids every bar)
Static Training Window
You select a period with:
Training Start
Training End
Only bars inside this range are used to fit the K-means model. This window defines:
the market regime examples
the statistical distributions (means/std) for each feature
how the centroids will be positioned post-trainin
Bars before training = fully transparent
Training bars = gray
Post-training bars = full colored regimes
Feature Engineering (4D Input Vector)
Every bar during training becomes a 4-dimensional point:
This combination balances: momentum, volatility, mean-reversion, trend acceleration giving the algorithm a richer "market fingerprint" per bar.
Standardization
To prevent any feature from dominating due to scale differences (e.g., CMF near zero vs CCI ±200), all features are standardized:
standardize(value, mean, std) =>
(value - mean) / std
Centroid Initialization
Centroids start at diverse coordinates using various curves:
linear
sinusoidal
sign-preserving quadratic
tanh compression
init_centroids() =>
// Spread centroids across using different shapes per feature
for c = 0 to k_clusters - 1
frac = k_clusters == 1 ? 0.0 : c / (k_clusters - 1.0) // 0 → 1
v = frac * 2 - 1 // -1 → +1
array.set(cent_rsi, c, v) // linear
array.set(cent_cci, c, math.sin(v)) // sinusoidal
array.set(cent_cmf, c, v * v * (v < 0 ? -1 : 1)) // quadratic sign-preserving
array.set(cent_mac, c, tanh(v)) // compressed
This makes initial cluster spread “random” even though true randomness is hardly achieved in pinescript.
K-Means Iterative Refinement
The algorithm repeats these steps:
(A) Assignment Step, Each bar is assigned to the nearest centroid via Euclidean distance in 4D:
distance = sqrt(dx² + dy² + dz² + dw²)
(B) Update Step, Centroids update to the mean of points assigned to them. This repeats iterations times (configurable).
LIVE REGIME CLASSIFICATION
After training, each new bar is:
Standardized using the training mean/std
Compared to all centroids
Assigned to the nearest cluster
Bar color updates based on cluster
No re-training occurs. This ensures:
No lookahead bias
Clean historical testing
Stable regimes over time
CLUSTER BEHAVIOR & TRADING LOGIC
Clusters (0, 1, 2, 3…) hold no inherent meaning. The user defines what each cluster does.
Example of custom actions:
Cluster 0 → Cash
Cluster 1 → Long
Cluster 2 → Short
Cluster 3+ → Cash (noise regime)
This flexibility means:
One trader might have cluster 0 as consolidation.
Another might repurpose it as a breakout-loading zone.
A third might ignore 3 clusters entirely.
Example on ETHUSD
Important Note:
Any change of parameters or chart timeframe or ticker can cause the “order” of clusters to change
The script does NOT assume any cluster equals any actionable bias, user decides.
PERFORMANCE METRICS & ROC TABLE
The indicator computes average 1-bar ROC for each cluster in:
Training set
Test (live) set
This helps measure:
Cluster profitability consistency
Regime forward predictability
Whether a regime is noise, trend, or reversion-biased
EQUITY SIMULATION & FEES
Designed for close-to-close realistic backtesting.
Position = cluster of previous bar
Fees applied only on regime switches. Meaning:
Staying long → no fee
Switching long→short → fee applied
Switching any→cash → fee applied
Fee input is percentage, but script already converts internally.
Disclaimers
⚠️ This indicator uses machine-learning but does not predict the future. It classifies similarity to past regimes, nothing more.
⚠️ Backtest results are not indicative of future performance.
⚠️ Clusters have no inherent “bullish” or “bearish” meaning. You must interpret them based on your testing and your own feature engineering.

Delta Zones Buy/Sell Pressure UT Plus Delta Zones Buy/Sell Pressure: All-in-One Smart Trading Indicator
💡 Summary: This Indicator is designed as a powerful All-in-One analysis tool, consolidating 4 crucial trading strategies: Delta Zones (Extreme Pressure), Orderblocks & Breaker Blocks (Market Structure), Multi-Indicator Signals (RSI/CCI/Stoch), and UT Bot Alerts (Trend Signals). It provides a comprehensive trading setup on a single chart.
🔎 Key Features:
Delta Zones (Extreme Buy/Sell Pressure): Utilizes Standard Deviation to spot candles with abnormal Buy/Sell Pressure, often indicating institutional activity or stop hunts.
Orderblocks & Breaker Blocks: Automatically analyzes Market Structure Shifts (MSS) to draw Orderblocks and convert them into Breaker Blocks, serving as key support/resistance zones.
Multi-Indicator Signals (RSI/CCI/Stoch): Provides confirmed Buy/Sell signals when RSI, CCI, and Stochastic are in Oversold/Overbought conditions and show reversal action (Users can select the combination).
UT Bot Alerts: Includes a ATR-based Trailing Stop system and secondary Buy/Sell signals for trend confirmation.
🚀 How to Use:
Use the "BUY/SELL" signals from the Multi-Indicator section as the primary trigger.
Use the Delta Zones or Orderblocks/Breaker Blocks as high-confidence confirmation zones for entry/exit, and as precise Stop Loss placement areas.
⚠️ Note on Performance: This Indicator uses complex logic (especially Array and Box drawing functions) and may be resource-intensive on lower timeframes.

The Ultimate Price Action & SMC Toolkit: Delta Zones, MTF IndicaThis is an All-in-One Pine Script indicator that seamlessly combines three advanced trading concepts:
Delta Zones (Wick Pressure): Uses Standard Deviation to identify extreme buying/selling pressure within the candlestick wicks, signaling potential stop hunts or liquidity absorption. These are plotted as critical Buy/Sell Boxes.
Multi-Timeframe (MTF) Indicators: Confirms signals using popular indicators (RSI, CCI, Stochastic) calculated from a separate, user-selected Timeframe or the current chart timeframe. This adds a crucial layer of context and momentum confirmation.
Smart Money Concepts (SMC): Automatically detects and plots Orderblocks (OBs) and Breaker Blocks based on confirmed Market Structure Breaks (MSB). This helps locate high-probability Supply and Demand zones.
Key Features:
Integrated plotting for combined indicator signals.
Flexible MTF selection for all standard oscillators.
Automatic Swing High/Low detection for SMC analysis.
Comprehensive Alert system for Delta Pressure, Orderblocks, and Breaker Zones.
Option 2: Focusing on SMC and Flow (Concise)
Title: "SMC Delta Flow: Advanced Orderblock, Breaker, and Wick Reversal Zones with MTF Filter."
Description:
An essential tool for sophisticated SMC traders. This indicator provides high-precision zones:
Smart Money Blocks: Plots Orderblocks and Breaker Blocks following Market Structure Shifts (MSS). Includes a "Chop Control" feature to invalidate re-used or weak Breakers.
Delta Reversal Zones: Pinpoints candles showing extreme high-deviation wick pressure. Use these zones to confirm reversals and identify precise entry points where liquidity was captured.
MTF Confirmation: Incorporates configurable Multi-Timeframe (MTF) RSI, CCI, and Stochastic indicators to act as a momentum filter or confirmation tool.
Add this indicator to unify your analysis of Liquidity, Market Structure, and Momentum on a single chart!
SMC, SmartMoneyConcepts, Orderblock, BreakerBlock, MTF, MultiTimeframe, Delta, Wick, Liquidity, PriceAction, RSI, Stochastic, CCI

TrendMaster V2TrendMaster V2 is a comprehensive Pine Script indicator designed for TradingView. It combines multiple technical indicators and an advanced scoring logic to provide actionable trading signals. The script is highly customizable, allowing users to adjust trading modes, color themes, and signal filters according to their preferences and risk tolerance.
Key Features
Composite Scoring System:
The script calculates a composite score based on trend, momentum, pattern recognition, volume, volatility, divergence, Pearson correlation, and the CCI index. This score helps identify the best buy or sell opportunities.
Customizable Parameters:
Users can choose between “Aggressive,” “Balanced,” or “Conservative” trading modes, adjust indicator periods, and customize the color scheme of all visual elements.
Confluence Analysis:
The script evaluates the number of matching bullish or bearish signals, providing a confluence summary for higher-confidence trades.
Visual Signals:
Clear visual cues (triangles, circles, crosses) are displayed on the chart for strong buy/sell signals, confluences, and divergences.
Information Panels:
Two panels display real-time data such as score, RSI, volume, volatility, Pearson, CCI, trend, signal, and mode, along with the confluence status for quick reference.
Alert Conditions:
The script supports alerts for strong buy/sell signals, confluences, and divergences.
How It Works
Main Configuration:
Users select a trading mode (Aggressive, Balanced, or Conservative) and a color theme (Dark or Light).
Custom colors can also be set for bullish, bearish, strong, neutral, and signal elements.
Technical Indicators
Moving Averages (SMA/EMA) for trend analysis.
RSI to assess momentum and overbought/oversold conditions.
MACD for trend confirmation.
Volume and Volatility (ATR) for market activity evaluation.
Advanced Indicators
Pearson Correlation to measure trend strength.
CCI for cyclic momentum analysis.
Pattern Recognition
The script identifies common bullish and bearish reversal patterns (e.g., engulfing, hammer, morning/evening star) and continuation patterns (e.g., three white soldiers/black crows).
Composite Score
Each indicator contributes to a composite score, weighted according to the selected trading mode.
The score determines the strength of buy/sell signals.
Confluence Analysis
The script counts the number of matching bullish or bearish signals, providing a confluence summary for higher-confidence trades.
Visual Signals and Alerts
Strong buy/sell signals: triangles
Confluence signals: circles
Divergences: crosses
Alerts are triggered for strong buy/sell signals, confluences, and divergences.
Usage Instructions
Add the script to your TradingView chart.
Adjust the settings in the configuration panel to match your trading style.
Monitor the information panels and visual signals to spot trading opportunities.
Set up alerts for your preferred signal types.

Composite Momentum System⚙️ Composite Momentum System — RSI + CCI + Momentum + MFI + (DI·ADX) × MACD² (4-Color Smoothed Signal)
This advanced indicator fuses multiple momentum, volume, and trend components into one unified oscillator, dynamically visualized around a zero line. It helps traders identify powerful directional moves, trend reversals, and momentum exhaustion far earlier than traditional MACD or RSI alone.
🧩 Core Formula
Composite = ((RSI + CCI + Momentum + MFI) + (((DI− × −1) + DI+) × ADX)) × (MACD²)
RSI – captures relative strength and short-term momentum
CCI – measures deviation from price mean (volatility & cycles)
Momentum – shows raw velocity of price change
MFI – volume-weighted momentum, adds money flow confirmation
DI / ADX – directional strength and market trend intensity
MACD² – amplifies strong momentum moves and filters weak noise
🌈 Visual Design & Features
Zero-Centered Histogram:
Green = Bullish momentum, Red = Bearish momentum
MACD Signal Line (4 Colors):
🟢 Positive & Rising → strong up momentum
🟡 Positive & Falling → weakening uptrend
🔴 Negative & Falling → strong downtrend
🟠 Negative & Rising → possible bearish fade or reversal
Adjustable Signal Smoothing:
Choose MA type (SMA, EMA, RMA, WMA, VWMA) and custom smoothing length for cleaner visualization.
ATR Normalization:
Optional setting to keep MACD and composite values consistent across instruments.
Centering Options:
RSI and MFI can be centered (−50/+50) to balance oscillation around zero.
🎯 How to Use
Above 0: Bullish composite energy → favor long setups.
Below 0: Bearish composite energy → favor short setups.
Signal line color changes highlight momentum acceleration or slowdown.
Crosses through zero often precede major shifts or breakout moments.
⚡ Best Practice
Use this indicator as a momentum strength filter in confluence with price action or volume patterns.
Combine it with VWAP, higher-timeframe trend, or support/resistance zones for high-probability entries.

Adaptive Trend CatcherAdaptive Trend Catcher is an original indicator that combines Hull Moving Average smoothing, ATR-based volatility bands, and a CCI filter within an adaptive logic framework. It’s built to react intelligently to changing market conditions rather than applying fixed parameters.
The system uses hysteresis to confirm trend flips only after several consistent signals, minimizing noise and false reversals. During strong momentum bursts, it automatically tightens its internal deadzone and step size to stay responsive while maintaining stability in quieter periods.
The result is a dynamic trend engine that plots a color-shifting adaptive line — green for bullish, red for bearish — that adjusts smoothly with volatility. Optional upper/lower ATR bands can be displayed for added context.
How to use: Watch for confirmed trend color flips with supporting momentum. Bullish flips occur when price regains the lower band and CCI turns positive; bearish flips when price falls below the upper band and CCI turns negative.
Includes alert conditions for both reversals.
For educational purposes only. Not financial advice.

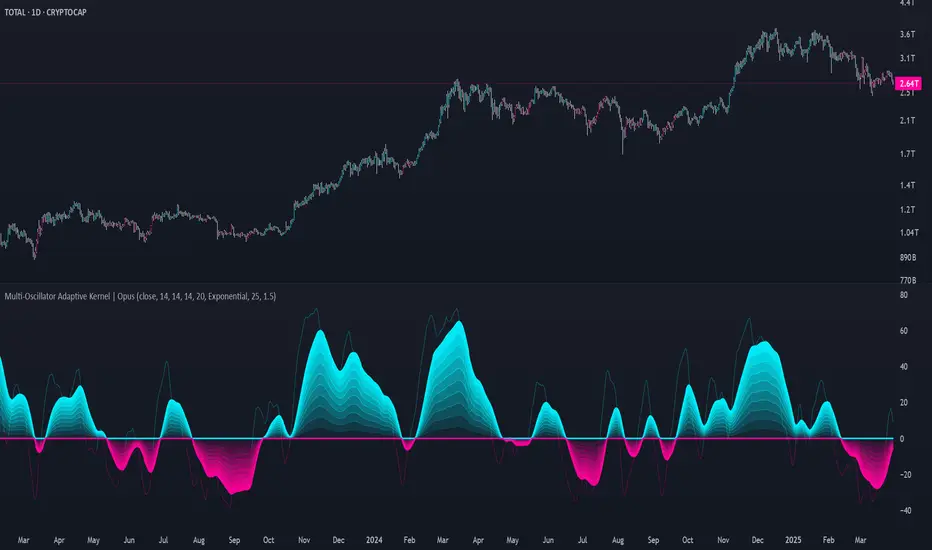
Multi-Oscillator Adaptive Kernel | AlphaAlgosMulti-Oscillator Adaptive Kernel | AlphaAlgos
Overview
The Multi-Oscillator Adaptive Kernel (MOAK) is an advanced technical analysis tool that combines multiple oscillators through sophisticated kernel-based smoothing algorithms. This indicator is designed to provide clearer trend signals while filtering out market noise, offering traders a comprehensive view of market momentum across multiple timeframes.
Key Features
• Fusion of multiple technical oscillators (RSI, Stochastic, MFI, CCI)
• Advanced kernel smoothing technology with three distinct mathematical models
• Customizable sensitivity and lookback periods
• Clear visual signals for trend shifts and reversals
• Overbought/oversold zones for precise entry and exit timing
• Adaptive signal that responds to varying market conditions
Technical Components
The MOAK indicator utilizes a multi-layer approach to signal generation:
1. Oscillator Fusion
The core of the indicator combines normalized readings from up to four popular oscillators:
• RSI (Relative Strength Index) - Measures the speed and change of price movements
• Stochastic - Compares the closing price to the price range over a specific period
• MFI (Money Flow Index) - Volume-weighted RSI that includes trading volume
• CCI (Commodity Channel Index) - Measures current price level relative to an average price
2. Kernel Smoothing
The combined oscillator data is processed through one of three kernel functions:
• Exponential Kernel - Provides stronger weighting to recent data with exponential decay
• Linear Kernel - Applies a linear weighting from most recent to oldest data points
• Gaussian Kernel - Uses a bell curve distribution that helps filter out extreme values
3. Dual Signal Lines
• Fast Signal Line - Responds quickly to price changes
• Slow Signal Line - Provides confirmation and shows the underlying trend direction
Configuration Options
Oscillator Selection:
• Enable/disable each oscillator (RSI, Stochastic, MFI, CCI)
• Customize individual lookback periods for each oscillator
Kernel Settings:
• Kernel Type - Choose between Exponential, Linear, or Gaussian mathematical models
• Kernel Length - Adjust the smoothing period (higher values = smoother line)
• Sensitivity - Fine-tune the indicator's responsiveness (higher values = more responsive)
Display Options:
• Color Bars - Toggle price bar coloring based on indicator direction
How to Interpret the Indicator
Signal Line Direction:
• Upward movement (teal) indicates bullish momentum
• Downward movement (magenta) indicates bearish momentum
Trend Shifts:
• Small circles mark the beginning of new uptrends
• X-marks indicate the start of new downtrends
Overbought/Oversold Conditions:
• Values above +50 suggest overbought conditions (potential reversal or pullback)
• Values below -50 suggest oversold conditions (potential reversal or bounce)
Trading Strategies
Trend Following:
• Enter long positions when the signal line turns teal and shows an uptrend
• Enter short positions when the signal line turns magenta and shows a downtrend
• Use the slow signal line (area fill) as confirmation of the underlying trend
Counter-Trend Trading:
• Look for divergences between price and the indicator
• Consider profit-taking when the indicator reaches overbought/oversold areas
• Wait for trend shift signals before entering counter-trend positions
Multiple Timeframe Analysis:
• Use the indicator across different timeframes for confirmation
• Higher timeframe signals carry more weight than lower timeframe signals
Best Practices
• Experiment with different kernel types for various market conditions
• Gaussian kernels often work well in ranging markets
• Exponential kernels can provide earlier signals in trending markets
• Combine with volume analysis for higher probability trades
• Use appropriate stop-loss levels as the indicator does not guarantee price movements
This indicator is provided as-is with no guarantees of profit. Always use proper risk management when trading with any technical indicator. Nothing is financial advise.
Multi-Timeframe RPM Gauges with Custom Timeframes by DiGetIntroducing the **Multi-Timeframe RPM Gauges with Custom Timeframes + RSI Combos (mod) by DiGet** – a cutting-edge TradingView indicator meticulously crafted to revolutionize your market analysis.
Imagine having a dynamic dashboard right on your chart that consolidates the power of nine essential technical indicators—RSI, CCI, Stochastic, Williams %R, EMA crossover, Bollinger Bands, ATR, MACD, and Ichimoku Cloud—across multiple timeframes. This indicator not only displays each indicator’s score through an intuitive gauge system but also computes a combined metric to provide you with an at-a-glance understanding of market momentum and potential trend shifts.
**Key Features:**
- **Multi-Timeframe Insight:**
Configure up to four custom timeframes (e.g., 1, 5, 15, 60 minutes) to capture both short-term fluctuations and long-term trends, ensuring you never miss critical market moves.
- **Comprehensive Signal Suite:**
Benefit from a harmonious blend of signals. Whether you rely on momentum indicators like RSI and CCI, volatility measures like Bollinger Bands and ATR, or trend confirmations via EMA, MACD, and Ichimoku, every metric is normalized into actionable percentages.
- **Dynamic, Color-Coded Gauge Display:**
A built-in table presents all your data in a clear, color-coded format—green for bullish, red for bearish, and gray for neutral conditions. This visual representation allows you to quickly gauge market sentiment without sifting through complex charts.
- **Customizable Layout:**
Tailor your experience by toggling individual table columns. Whether you want to focus solely on RSI or dive deep into combined metrics like RSI & CCI or RSI & MACD, the choice is yours.
- **Optimized Utility Functions:**
Proprietary functions standardize indicator values into percentage scores, making it simpler than ever to compare different signals and spot opportunities in real time.
- **User-Friendly Interface:**
Designed for both beginners and seasoned traders, the straightforward input settings let you easily adjust technical parameters and timeframes to suit your personal trading strategy.
This indicator is not just a tool—it’s your new trading companion. It equips you with a multi-dimensional view of the market, enabling faster, more informed decision-making. Whether you’re scanning across various assets or drilling down on a single chart, the Multi-Timeframe RPM Gauges empower you to interpret market data with unprecedented clarity.
Add this indicator to your TradingView chart today and experience a smarter, more efficient way to navigate the markets. Join the community of traders who have elevated their analysis—and be ready to receive countless thanks as you transform your trading strategy!

AI Adaptive Oscillator [PhenLabs]📊 Algorithmic Adaptive Oscillator
Version: PineScript™ v6
📌 Description
The AI Adaptive Oscillator is a sophisticated technical indicator that employs ensemble learning and adaptive weighting techniques to analyze market conditions. This innovative oscillator combines multiple traditional technical indicators through an AI-driven approach that continuously evaluates and adjusts component weights based on historical performance. By integrating statistical modeling with machine learning principles, the indicator adapts to changing market dynamics, providing traders with a responsive and reliable tool for market analysis.
🚀 Points of Innovation:
Ensemble learning framework with adaptive component weighting
Performance-based scoring system using directional accuracy
Dynamic volatility-adjusted smoothing mechanism
Intelligent signal filtering with cooldown and magnitude requirements
Signal confidence levels based on multi-factor analysis
🔧 Core Components
Ensemble Framework : Combines up to five technical indicators with performance-weighted integration
Adaptive Weighting : Continuous performance evaluation with automated weight adjustment
Volatility-Based Smoothing : Adapts sensitivity based on current market volatility
Pattern Recognition : Identifies potential reversal patterns with signal qualification criteria
Dynamic Visualization : Professional color schemes with gradient intensity representation
Signal Confidence : Three-tiered confidence assessment for trading signals
🔥 Key Features
The indicator provides comprehensive market analysis through:
Multi-Component Ensemble : Integrates RSI, CCI, Stochastic, MACD, and Volume-weighted momentum
Performance Scoring : Evaluates each component based on directional prediction accuracy
Adaptive Smoothing : Automatically adjusts based on market volatility
Pattern Detection : Identifies potential reversal patterns in overbought/oversold conditions
Signal Filtering : Prevents excessive signals through cooldown periods and minimum change requirements
Confidence Assessment : Displays signal strength through intuitive confidence indicators (average, above average, excellent)
🎨 Visualization
Gradient-Filled Oscillator : Color intensity reflects strength of market movement
Clear Signal Markers : Distinct bullish and bearish pattern signals with confidence indicators
Range Visualization : Clean representation of oscillator values from -6 to 6
Zero Line : Clear demarcation between bullish and bearish territory
Customizable Colors : Color schemes that can be adjusted to match your chart style
Confidence Symbols : Intuitive display of signal confidence (no symbol, +, or ++) alongside direction markers
📖 Usage Guidelines
⚙️ Settings Guide
Color Settings
Bullish Color
Default: #2b62fa (Blue)
This setting controls the color representation for bullish movements in the oscillator. The color appears when the oscillator value is positive (above zero), with intensity indicating the strength of the bullish momentum. A brighter shade indicates stronger bullish pressure.
Bearish Color
Default: #ce9851 (Amber)
This setting determines the color representation for bearish movements in the oscillator. The color appears when the oscillator value is negative (below zero), with intensity reflecting the strength of the bearish momentum. A more saturated shade indicates stronger bearish pressure.
Signal Settings
Signal Cooldown (bars)
Default: 10
Range: 1-50
This parameter sets the minimum number of bars that must pass before a new signal of the same type can be generated. Higher values reduce signal frequency and help prevent overtrading during choppy market conditions. Lower values increase signal sensitivity but may generate more false positives.
Min Change For New Signal
Default: 1.5
Range: 0.5-3.0
This setting defines the minimum required change in oscillator value between consecutive signals of the same type. It ensures that new signals represent meaningful changes in market conditions rather than minor fluctuations. Higher values produce fewer but potentially higher-quality signals, while lower values increase signal frequency.
AI Core Settings
Base Length
Default: 14
Minimum: 2
This fundamental setting determines the primary calculation period for all technical components in the ensemble (RSI, CCI, Stochastic, etc.). It represents the lookback window for each component’s base calculation. Shorter periods create a more responsive but potentially noisier oscillator, while longer periods produce smoother signals with potential lag.
Adaptive Speed
Default: 0.1
Range: 0.01-0.3
Controls how quickly the oscillator adapts to new market conditions through its volatility-adjusted smoothing mechanism. Higher values make the oscillator more responsive to recent price action but potentially more erratic. Lower values create smoother transitions but may lag during rapid market changes. This parameter directly influences the indicator’s adaptiveness to market volatility.
Learning Lookback Period
Default: 150
Minimum: 10
Determines the historical data range used to evaluate each ensemble component’s performance and calculate adaptive weights. This setting controls how far back the AI “learns” from past performance to optimize current signals. Longer periods provide more stable weight distribution but may be slower to adapt to regime changes. Shorter periods adapt more quickly but may overreact to recent anomalies.
Ensemble Size
Default: 5
Range: 2-5
Specifies how many technical components to include in the ensemble calculation.
Understanding The Interaction Between Settings
Base Length and Learning Lookback : The base length determines the reactivity of individual components, while the lookback period determines how their weights are adjusted. These should be balanced according to your timeframe - shorter timeframes benefit from shorter base lengths, while the lookback should generally be 10-15 times the base length for optimal learning.
Adaptive Speed and Signal Cooldown : These settings control sensitivity from different angles. Increasing adaptive speed makes the oscillator more responsive, while reducing signal cooldown increases signal frequency. For conservative trading, keep adaptive speed low and cooldown high; for aggressive trading, do the opposite.
Ensemble Size and Min Change : Larger ensembles provide more stable signals, allowing for a lower minimum change threshold. Smaller ensembles might benefit from a higher threshold to filter out noise.
Understanding Signal Confidence Levels
The indicator provides three distinct confidence levels for both bullish and bearish signals:
Average Confidence (▲ or ▼) : Basic signal that meets the minimum pattern and filtering criteria. These signals indicate potential reversals but with moderate confidence in the prediction. Consider using these as initial alerts that may require additional confirmation.
Above Average Confidence (▲+ or ▼+) : Higher reliability signal with stronger underlying metrics. These signals demonstrate greater consensus among the ensemble components and/or stronger historical performance. They offer increased probability of successful reversals and can be traded with less additional confirmation.
Excellent Confidence (▲++ or ▼++) : Highest quality signals with exceptional underlying metrics. These signals show strong agreement across oscillator components, excellent historical performance, and optimal signal strength. These represent the indicator’s highest conviction trade opportunities and can be prioritized in your trading decisions.
Confidence assessment is calculated through a multi-factor analysis including:
Historical performance of ensemble components
Degree of agreement between different oscillator components
Relative strength of the signal compared to historical thresholds
✅ Best Use Cases:
Identify potential market reversals through oscillator extremes
Filter trade signals based on AI-evaluated component weights
Monitor changing market conditions through oscillator direction and intensity
Confirm trade signals from other indicators with adaptive ensemble validation
Detect early momentum shifts through pattern recognition
Prioritize trading opportunities based on signal confidence levels
Adjust position sizing according to signal confidence (larger for ++ signals, smaller for standard signals)
⚠️ Limitations
Requires sufficient historical data for accurate performance scoring
Ensemble weights may lag during dramatic market condition changes
Higher ensemble sizes require more computational resources
Performance evaluation quality depends on the learning lookback period length
Even high confidence signals should be considered within broader market context
💡 What Makes This Unique
Adaptive Intelligence : Continuously adjusts component weights based on actual performance
Ensemble Methodology : Combines strength of multiple indicators while minimizing individual weaknesses
Volatility-Adjusted Smoothing : Provides appropriate sensitivity across different market conditions
Performance-Based Learning : Utilizes historical accuracy to improve future predictions
Intelligent Signal Filtering : Reduces noise and false signals through sophisticated filtering criteria
Multi-Level Confidence Assessment : Delivers nuanced signal quality information for optimized trading decisions
🔬 How It Works
The indicator processes market data through five main components:
Ensemble Component Calculation :
Normalizes traditional indicators to consistent scale
Includes RSI, CCI, Stochastic, MACD, and volume components
Adapts based on the selected ensemble size
Performance Evaluation :
Analyzes directional accuracy of each component
Calculates continuous performance scores
Determines adaptive component weights
Oscillator Integration :
Combines weighted components into unified oscillator
Applies volatility-based adaptive smoothing
Scales final values to -6 to 6 range
Signal Generation :
Detects potential reversal patterns
Applies cooldown and magnitude filters
Generates clear visual markers for qualified signals
Confidence Assessment :
Evaluates component agreement, historical accuracy, and signal strength
Classifies signals into three confidence tiers (average, above average, excellent)
Displays intuitive confidence indicators (no symbol, +, ++) alongside direction markers
💡 Note:
The AI Adaptive Oscillator performs optimally when used with appropriate timeframe selection and complementary indicators. Its adaptive nature makes it particularly valuable during changing market conditions, where traditional fixed-weight indicators often lose effectiveness. The ensemble approach provides a more robust analysis by leveraging the collective intelligence of multiple technical methodologies. Pay special attention to the signal confidence indicators to optimize your trading decisions - excellent (++) signals often represent the most reliable trade opportunities.
