Vix FIX / Stochastic Weights StrategyThis script is based off of Chris Moody's Vix Fix Indicator modified by OskarGallard and BigBitsIO's Stochastic Weights.
This script is a compilation of several different stochastic indicators (and RSI ) where the K value of each indicator is equally weighted. The purpose of the indicator is to combine many indicators together in a fashion that weights them easier. By default, the Stochastic and Stochastic RSI are both enabled - the idea is to speed up the relatively slower Stochastic and to slow down the relatively fast Stochastic RSI . BigBitsIO's Stochastics are also available that can also be added to the weighted calculation. Only the K value is weighted, as the D value is just a moving average of the weighted K.
- Why is this modifed stochastic useful?
- To weight multiple indicators together so that you can attempt to find optimal values shared amongst the indicators. Ex: If Stochastic RSI is 100 and Stochastic is 50, K would be 75 and not particularly high. If you add in a 50 RSI , the K would be 67 in this example. If we weight indicators together that all have a high value they could potentially help find elements that align together to produce a stronger signal.
In this script we have the red "S" triangles which are Exits (overbought stochastic crosses).
Added alerts for stochastic exit signals. Alerts are Pre-Set to only Alert on Bar Close.
The "Williams Vix Fix" is one of the most reliable indicators in history for finding market bottoms. The Vix Fix is simply a code from Larry Williams creating almost identical results for creating the same ability the Vix has to all assets.
The VIX has always been much better at signaling bottoms than tops. Simple reason is when market falls retail traders panic and increase volatility , and professionals come in and capitalize on the situation. At market tops there is no one panicking... just liquidity drying up.
The FE green triangles are "Filtered Entries".
The AE green triangles are "Aggressive Filtered Entries".
Added Alerts to Williams Vix Fix (Aggressive Entry and Filtered Entry). Alerts are Pre-Set to only Alert on Bar Close.
Added "Ehlrers StochCCI" indicator of user @glaz
The Ehlrers StochCCI is a variation of Ehlers Stochastic RSI replaced with CCI.
The John Ehlers' article in August, 2006, "Modeling The Market = Building Trading Strategies," describes a process for extracting trend and cyclic elements from market data, then recombining them for trading purposes. He used the Stochastic RSI denoted the cyclic elements.
Added ability to show Dots when StochCCI Crosses.
Sell: fuchsia dots.
Buy: green dots.
Added alerts for (Buy / Sell) StochCCI. Alerts are Pre-Set to only Alert on Bar Close.
DISCLAIMER: For educational and entertainment purposes only. Nothing in this content should be interpreted as financial advice or a recommendation to buy or sell any sort of security or investment including all types of crypto. DYOR, TYOB.
ค้นหาในสคริปต์สำหรับ "Buy sell"

Trend MasterThis is a trend aggregator for confirmation and trend signals. It basically aggregates many buy/sell signals and confirmation and by combining them provides a strong buy/sell signal or trend confirmation.
The actual layout idea and trend confirmation is derived from Trend Meter and this indicator uses few other indicator, such as Chandelier Exit, WaveTrend, QQE Signals, Parabolic SAR and AlphaTrend. This indicator aggregates signal from different methods to find out more powerful and confirmed Trend and combines them into one Signal. It also uses Technical Ratings from TradingView team to filter out false signal, it tremendously opts out false signals and improve profitability.
The first seven dots are these
All 3 Trend Meters Now Align
MACD Crossover - Fast - 8, 21, 5
RSI 13: > or < 50
RSI 5: > or < 50
MA Crossover
MA Crossover
Chaikin Money Flow
Alphatrend
Technical Ratings
Then trend
Chandelier Exit
WaveTrend
QQE Signals
Parabolic Sar
All 3 Trend Meters aligns and A signal from trend i
Instructions
Change buy/sell policy based on market trend
Works on all TimeFrame but gives more accuracy on 4H, 1D.
Buy when green big dot appears at the bottom.
Sell when red big dot appears at the bottom.
Red/green dot at the top line appears when three trend meter is aligned and this is a good confirmation.
Any red/green dot below horizontal bars are trend signals.
Big red/green got at the bottom appears whenever there's a good confirmation from trend meter and a buy/sell signal comes from any trend signals.
Also look on the technical ratings bar, green means buy, red means sell and yellow means neutral.
Look for Support or Resistance Levels for price to be attracted to.
Find confluence with other indicators.
The more Trend meters are lit up the better.
Alert
01 Buy Signal = Strong Buy Signal
02 Sell Signal = Strong Sell Signal
03 Buy Signal = Strong Buy Signal
04 Sell Signal = Strong Sell Signal
Thanks to TradingView Technical Ratings authors, evergot, Lij_MC, KivancOzbilgic for their work. This indicator was heavily inspired from their work.

Deadly Trio V2.0Overview:
This is a fully featured StochRSI, RSI & Bollinger Bands customisable indicator with custom conditions and alerts that can be taken advantage of using automated solutions such as Autoview, 3Commas or using it alongside/testing BUY/SELL conditions against your favourite markets to maximise gains. Finally you can use this a standalone manual general purpose signals indicator to scalp or accumulate your chosen market.
Time Frame:
This Indicator is specially customize for 5min time frame, but you can use it on Higher Time Frames as well, such as 15min, 1hr, 4hr and 1Day.
How to Use:
Long Position:
When the RSI is in Oversold (below 30) in 5min time frame, and Deadly Trio shows BUY Signal, then enter in the trade with long position.
Take Profit for Long Position:
When the candle touches the middle line (White Line) then it will be consider as the Target 1 Hit. When the candle touches the Upper Band then it will be consider as the Target-2 Hit. Always book some profit on Target-1. To play safe, you can close your trade in profit when the Target-1 Hit.
Short Position:
When the RSI is in Overbought (above 70) in 5min time frame and Deadly Trio Indictor shows SELL Signal, then enter in the trade with short position.
Take Profit for Short Position:
When the candle touches the middle line (White Line) then it will be consider as the Target 1 Hit. When the candle touches the Lower Band then it will be consider as the Target-2 Hit. Always book some profit on Target-1. To play safe, you can close your trade in profit when the Target-1 Hit.
How to do DCA (Dollar Cost Averaging):
If you want to maximize your profit, or you want to exit your trade always in profit then DCA (Dollar Cost Averaging) is very necessory. For DCA, always buy in parts. If you are in Long Position and another BUY signals appears on Deadly Trio, then Buy some more as per your financial conditions. Same condition apply for Short Position when SELL signal appears.
When to EXIT the Trade:
If you are in Long Position/Short Position and SELL / BUY Signal appears on the candle then close your Long Position/Short Position. You can also use this condition as a STOP LOSS.

[UPRIGHT Trading] OrderZones - Supply & Demand (Predictive) (cc)Hello Traders,
This is one that I've been working on a very, Very long time. As easy as it is to draw after the fact, as someone well versed in Supply and Demand; it's a bit more difficult to create all the calculations to show them, code them out, and then I went a step further — attempting to predict future ones as well.
Let's talk about what Supply & Demand Zones are. They are a pattern and technical analysis technique used in day and swing trading. Demand zone represents the area with strongest buying pressure and Supply zone represents selling pressure. Often these zones will show Institutional/Large buyers and sellers executing their orders causing price to move up or down very quickly, creating a long wick on a small and sometimes momentum that feeds into the larger timeframes. Therefore, in the simplest terms, the Supply and Demand Orderzones are the zones the price often gets rejected from or returned to; when Demand exceeds Supply, price jumps up and vice versa.
Unlike lines of support and resistance , these are zones more closely than precise lines, but can help gauge Support and Resistance on the fly.
Richard Wykoff was one of the first market analysts to explain the interaction of these phases, giving them four labels. It is in the understanding of Wyckoff's explanation of market price action, that supply and demand zones are also known as Accumulation and Distribution zones (Accumulation, Markup, Distribution, Markdown).
Shows potential entries on break from zone. Pivots. Large breakdowns or breakouts signalling possible trend change.
Super Fast Real-time Orderzone creation. Resistance line at Supply, shows multiple dimensions of each zone when large enough.
Different calculation, line, transparency settings
Minimalist mode with autobox
Features:
Multiple calculation modes with different lengths and displays.
AutoBox (Predictive Orderzones).
Buy/Sell Highlights.
UPRIGHT – Ultimate Reversals (Support/Resistance version).
Breakouts/Breakdowns + Signals.
Pivot Labels (HH, HL, etc).
Pivot Bar.
Pivot Buy /Sell Signals.
Fully Customizable—Change line types, transparency, colors, etc).
I am still working on the calculations for one more addition, but as it is, this should help anyone automate their S/D technical analysis.
Please see author instructions for access.
Cheers,
Mike
(UPRIGHT Trading)

Candles Colored Green/Red According To Buy & Sell PressureCANDLES COLORED GREEN OR RED ACCORDING TO BUY & SELL PRESSURE
This indicator paints each candle green, red or blue depending on whether the buy/sell pressure for that candle is bullish, bearish or neutral.
***TURN OFF NORMAL CANDLE COLORS***
For this script to show properly on the chart, make sure you go to chart settings(gear icon in top right corner) and in the symbol tab, uncheck body, borders and wick.
***HOW TO USE***
When the directional movement index indicator shows more buying pressure than selling pressure, the candle will appear lime green. This indicates bullish buying pressure.
When the directional movement index indicator shows more selling pressure than buying pressure, the candle will appear red. This indicates bearish selling pressure.
When the directional movement index indicator shows the same amount of buy and sell pressure, the candle will appear blue. This indicates neutral buy/sell pressure.
Use the color changes to see if there is more buying or selling to pinpoint reversals and understand current market buying. Wait to enter or exit positions until the candles turn the opposite color.
***MARKETS***
This indicator can be used as a signal on all markets, including stocks, crypto, futures and forex.
***TIMEFRAMES***
This DMI color coded candlestick indicator can be used on all timeframes.
***TIPS***
Try using numerous indicators of ours on your chart so you can instantly see the bullish or bearish trend of multiple indicators in real time without having to analyze the data. Some of our favorites are our Auto Fibonacci, Directional Movement Index, Color Coded Buy & Sell Pressure Volume Profile, Auto Support And Resistance and Money Flow Index in combination with this Buy & Sell pressure Candle indicator.

TradingGroundhog - Fundamental Bot Automation - Fractal/Wave -V1PLEASE READ THE DESCRIPTION - AS THE SCRIPT IS USED FOR AUTOMATION AND TRADING PAIR SWITCH THE MECHANISM CAN BE COMPLICATED TO UNDERSTAND
#-- Pairs Switching - No Repaint - Fractals - Wavetrend --
This strategy uses my fractal/wavetrend previous methods in order to buy/sell.
However, it has been designed in order to switch automatically the pairs on which it trades to reduce the loss and risk.
#-- Synopsis --
To do so, the script uses a Daily wavetrend oscillator. The oscillator is used to find uptrend periods.
From it, the number of uptrend days are counted.
#-- Wavetrend --
For exemple, if BTC/EUR goes from downtrend to uptrend, the script will start to count since how many days the market is uptrend.
Then, if BTC/EUR goes from uptrend to downtrend, the counter will be reset to 0.
The script only trades during uptrend periods.
#-- Pairs --
Up to 35 pairs can be used at the same time. The user can enable of disable to trade on certain pairs.
Uptrend days are counted for each one of those pairs. The user can define on how many pairs the script can trade at the same time.
The select which pairs will be trade, the script sort all the enabled pairs based on their uptrend days counters.
#-- Trade organization --
For exemple if we set 5, as the number of maximum pairs to trade on.
Trades will be conducted on the 5 pairs being in uptrend for the longest time.
Therefore, to organize the money placement on each pair, the equity is used.
For 100% of equity, 10% are kept if losing trades occur.
The remaining 90% are divided by the number of maximum pairs to trade on.
If we chose 5, we will have (90/5) 18% of our capital placed in each bot.
#-- Setting it --
As explained before, this script is used for automation.
For exemple, lets say you are interested by 15 pairs with promising evolution and you set the number of maximum pairs to trade on to 5.
You will have to set alerts for the script on each of the 15 pairs.
You will receive alerts for when to buy and sell.
Note that the script has to be set for each of the selected pairs, it is not able to trade on 15 pairs (thus, webpages) if only set on one Tradingview webpage.
#-- Plot--
Once launch, you can see a plot.
The plot represent the Uptrend days counter for 20 pairs. It also project the organization of the ENABLED pairs.
If a pair is part of the one with the highest number of uprend days. It's name will be displayed under the plot in a yellow comment box.
Four other box are projected to the right of the plot:
White comment : All the pairs sorted from highest number of uptrend days to the lowest.
Red comment : Pairs with the lowest number of uptrend days.
Blue comment : Interesting pairs which will may be uptrend for a long time.
Green comment : Actual pairs with active trading (thus, the pairs with the maximum number of uptrend days)
#-- Bot automation --
If you use 3commas or other trading bot platforms, you will have to set as comments the BUY/SELL alerts. <= Which is what I am doing with it.
Doing so make you trade on multiple pairs, automatically.
However, you will need to set as input the 3commas signal.
For the moment, the script will be needed for it.
However, I will soon release a V2 taking as input the 3commas strategy comments.
For the moment, you can set the script in different webpages and follow BUY/SELL orders by eyes of alerts. ;)
#-- Parameters --
*** Parameters have been intensively optimized using 35 cryptocurrency pairsin order to have potent efficiency for each of them. I would recommend to only change the METHOD SETTINGS. For the others, I don't recommend any modifications. If you need precision on the other parameters of if you want to modify them, more informations can be found in my previous scripts and ***
Filtering method :
Used to reduce or not the risks. If you set Wavetrend, less trades will be conducted as the wavetrend filter from will be used. If you choose Fractal, no Wavetrend signals will be used.
(I prefer to use Fractal as I am using 1 or 3 minutes timeframes for the moment.)
Market Pairs : You can select on which markets the script will trade by enabling it's checkbox.
*** Also, for the moment, due to Pinescript limitation, I cannot set as input the number of active pairs. So I set 5, after optimization, as the default number of maximum pairs to trade on. Thus, you should open webpage for each ENABLED pairs and load the script in each on them. 5 Tradingview webpage will always be active. ***
#-- Timeframe --
You can use the script for Short or Long term trading:
For Short term, you will have to use 1 or 3 minutes timeframes, depending on the volatility of the market. (What I am using)
For Long term, you will have to use 5 or 15 minutes timeframes, depending on the volatility of the market.
#-- Strategy abilities and results for more than a month of activity -- *** !!! IMPORTANT SECTION !!! ***
I have simulated the profit for the 21 ACTIVE pairs I selected has been potent with my Fractal strategy. Different maximum number of trading pairs were used in order to find the best one. The script was run for the last 46 or 30 days.
Different timeframe have been used as pairs have different volatility.
*** If you use the script, SET IT UP with the following pairs and the following timeframes. ***
-------------------------------------------------------------------------------------------------------
Parameters | Maximum number of trading pairs
-------------------------------------------------------------------------------------------------------
Timeframe | Pairs | 1 2 3 5 6 10
-------------------------------------------------------------------------------------------------------
3M | SHIB | 0 0.98 3.63 2.17 2.56 2.56
1M | SOL | 0 1.5 1.08 1.26 0 0
3M | XRP | 10.5 4.56 3.29 2.19 1.52 1.52
3M | ETH | 9.94 6.97 4.55 3.45 2.19 2.19
3M | BTC | 1.7 2.32 1.74 1.88 1.33 1.33
3M | DOT | 0 3.5 2.32 2.27 1.99 1.99
1M | DOGE | 0 0 0 3.14 1.93 1.93
1M | LUNA | 0 0 0 0.23 2.35 2.35
3M | AVAX | 8.92 0 0.53 3.63 1.17 1.17
1M | HOT | 0 0 2.12 7.96 4.69 4.69
3M | GRT | 0 -1.09 -0.82 0.25 -0.191 0
1M | LINK | 0 0 0 0 0 0
1M | CHZ | 0 0 0.4 0.85 1.89 1.91
3M | WIN | 0 0 0.52 5.89 2.8 2..8
3M | ENJ | 32.63 15.65 12.55 10.31 5.62 5.62
3M | RUNE | 0 4.68 3.42 -1.18 2.3 2.3
3M | LTC | 0 -0.06 1.1 1.29 3.49 3.49
3M | BTT | 0 0 0 0.85 1.63 1.63
3M | BCH | 0 0 0 1.36 2.36 2.36
3M | WRX | 0.26 4.66 5.36 4.29 3.01 3.01
3M | ETC | -0.92 0 0 3.6 3.31 3.56
-------------------------------------------------------------------------------------------------------
Net profit % | 63.03 43.67 37.24 55.69 45.949 43.61
Number of days | 46 30 30 46 46 46
Net profit % per day | 1.38 1.46 1.25 1.22 1.00 0.95
-------------------------------------------------------------------------------------------------------
*** Therefore, we are around more than 1% per day in each case. ***
#-- Choosing pairs --
I selected the 35 cryptocurrencies which can be exchange with EUR and evaluated the ability of my Fractal script on them. The on which have been ENABLED (true) are the best.
BINANCE:SHIBEUR | true
BINANCE:SOLEUR | true
BINANCE:XRPEUR | true
BINANCE:ETHEUR | true
BINANCE:BTCEUR | true
BINANCE:DOTEUR | true
BINANCE:ENJEUR | true
BINANCE:DOGEEUR | true
BINANCE:LUNAEUR | true
BINANCE:VETEUR | false
BINANCE:BNBEUR | false
BINANCE:AVAXEUR | true
BINANCE:HOTEUR | true
BINANCE:EGLDEUR | false
BINANCE:GRTEUR | true
BINANCE:MATICEUR | false
BINANCE:LINKEUR | true
BINANCE:CHZEUR | true
BINANCE:ICPEUR | false
BINANCE:UNIEUR | false
BINANCE:WINEUR | true
BINANCE:ADAEUR | false
BINANCE:RUNEEUR | true
BINANCE:TRXEUR | false
BINANCE:THETAEUR | false
BINANCE:EOSEUR | false
BINANCE:LTCEUR | true
BINANCE:XLMEUR | false
BINANCE:BTTEUR | true
BINANCE:SXPEUR | false
BINANCE:LAZIOEUR | false
BINANCE:YFIEUR | false
BINANCE:BCHEUR | true
BINANCE:WRXEUR | true
BINANCE:ETCEUR | true

Jerry Romine Momentum Dream With Risk ManagementThe Momentum Dream Indicator with Risk Management is really two powerful indicators combined in one.
The Momentum Dream Indicator is a volatility and momentum indicator that measures the relationship between the Bollinger Bands and Keltner Channels to help identify consolidations and signal potential breakouts.
MOMENTUM DREAM INDICATOR:
SIGNALS AND ZONES:
Green Arrow = Post Squeeze Buy Triggered = GREEN ⇧ shows squeeze out on upward momentum (often a good time to buy)
Orange Arrow = Post Squeeze Sell Alert = ORANGE ⇩ shows squeeze out on downward momentum (often a good time to sell or NOT buy)
Green Dot on Chart - Day one of the buy zone
Green Shading - Buy Zone
Pink Dot on Chart - Day one of warning zone
Red Shading - Warning zone. Often a good time not to buy or to consider selling.
LABELS (Color Indicates Direction):
Momo Up / Down = Current momentum direction.
Squeeze = Squeeze is on and squeeze line dots are red.
Dots = number of day or bars the squeeze has been in red(on)
Squeeze Fired = Green or Orange arrow shows squeeze fired direction.
Stacked = Fibonacci 8, 21, 34, 55, 89 EMA are stacked up or down
SQUEEZE LINE COLOR DEFINITIONS:
Dark Red = Extra Squeeze (In & Out)
Red = Original Squeeze (In & Out)
Pink = Pre-Squeeze (In)
Yellow = Pre-Squeeze (Out)
Green = Bollinger Bands are officially outside of Keltner Channels
STRATEGY
There are multiple ways the Momentum Dream Indicator can be used.
1. Buy/Sell during the squeeze (generally lower volatility and lower option premiums)
2. Buy/Sell when the squeeze fires to catch the breakout (volume/volatility often increase)
3. Use Buy/Sell Zones with other signals for entering positions
4. Use Momentum to assist with position direction
5. Use fading momentum to tighten stops or close positions.
* The labels only show when certain criteria are met. For example if a squeeze fired the label only shows on that day but the indicator arrow will always show. For this reason the labels on the chart above will vary from day to day and only alert you when needed. :)
RISK MANAGEMENT INDICATOR
Risk management is a vital part of investing and this indicator provides 2 recommended positions sizes. One based on the classic 1-2% risk rule where you never risk more than X% of your account. A second based on position size not exceeding X% of your account.
The Risk Management Indicator does all of the hard math and provides you with a realistic trading plan, position size, and trail stop based on your customizable criteria. If you’ve ever wondered how much of a stock to buy, when to sell and when to take profits this indicator is for you!
Please Use the link below for more information or to purchase.

CPR by PIVOT EDGEIntroduction to the Indicator "CPR by PIVOT EDGE - with AUTO BUY SELL Triggers"
The Foundation layout for this indicator is based on PIVOT's strategy which are nothing but the most important levels that the price has respected in the past. The values for the pivots are derived from the key attributes of the price in any timeframe such as the previous OPEN, HIGH, LOW and CLOSE. These define the mood of the price and where it intends to move in relation to the previous range formed. Earlier HIGH - LOW i.e the RANGE indicates the possible movement that a stock can make in the current session and as per the calculated pivots we can possible find out the tentative supports and resistances. In addition to this indicator, It is advisable to use the price action theory which helps in taking a right decision for entries.
This indicator by itself is complete in nature, i.e it guides the user for possible entry levels and the projected targets that we can achieve and also the likely stop loss limit in case the price reverses. So beforehand even before entering into a trade position, the user can ascertain what can be his loss or max profit and then he can chose an optimum position size for favorable results. This Indicator also comes with labels for all PIVOTS like CPR , TC , BC , S1,R1, PDH , PDL etc.. which makes it easier to understand levels and trade
The beauty of this Indicator lies in the fact that it can be used for all types of trading styles like Scalping, Intra day, Swing or Positional and Investments also. It works on all timeframes and across all market segments like EQUITY, COMMODITIES , FUTURES , FOREX etc. This indicator can be used for any exchange and any time zone also without any changes or adjustments needed.
Now let us understand the features of this Indicator in detail.
TIMEFRAME - It has options to choose between Day, week and month as timeframe. By default it is set to Day timeframe - Though this Indicator works on all timeframes, it is advisable to work on ,15,30 mins Intraday and 1H,2H, 4H for Swing and D,W candles for Positional trades.
DISPLAY CPR BAND - This displays the CPR range that consists of Pivot , TC and BC . This Band or Range is the core of this indicator and this gives a detailed information about the tentative range and momentum of the market for the present period
as well a prediction for next session and also can tell you the history of its prior period. This level acts as both support and resistance based on the direction of the trend. The unique feature built in this indicator is that
the CPR Band changes its color based on whether it is ascending or descending CPR or in other works if it is higher value relation or lower value relation compared to previous session. Green for Higher and red for lower relation.
DISPLAY SUPPORT RESISTANCE - This indicates the important support and resistance levels for the day which is derived from the price details of prior period that is based on HIGH / LOW / CLOSE of prior period.
DISPLAY PREVIOUS HIGH / LOW / CLOSE - I have included Daily / Weekly. It is important to know the earlier highs / lows and close since price respects it very much just like support and resistance .
DISPLAY TOMORROW CPR - This displays the CPR band and support / resistance for tomorrow. It give an advance information of tomorrows trend and momentum today itself if you study the CPR concepts you can be prepared for tomorrows' market and can very well know in advance if it will be a sideways market or a trending day.
PMA - Pivot Moving averages are an important combination of 3 Fibonacci series based moving averages. Here I have used 9,14 & 23 as the series which I found gave best results after long period of back testing and finetuning. It clearly gives you the mid term trend of the price and if you just follow the color of the band then you wont go wrong. Always try to take entries whenever price finds support or resistance close to the curve and avoid taking entries whenever price is too far from these curves.
These curves and the area are also color coded to depict buying and selling zones.
MAJOR TREND - This displays the prevailing major trend in the market and I have used as 200 period moving average by default which you can change to suit your needs. You can check the major trend of the market by using higher timeframes above 1Hr.
MARKET BIAS INDICATOR - One more unique feature of this Indicator is the background color which denotes on which medium trend currently the market is i.e whether Buying is favorable or selling is favorable. Light blue if for Buying zone and Light yellow is for selling zone.
BUY SELL triggers - This is going to be the most unique and advanced feature of this indicator. I have carefully studied and created a special trigger system which will alert the user whenever a BUY or SELL opportunity is presented in the stock. This is the result from a lot of study of the pivot strategies, CPR techniques, Price action theory, Candle stick patterns , market structure and my trading experience all put together. You can set the automatic alerts to any number of stocks to whichever timeframe you prefer either for Intraday or even swing & positional trading. ( Depends on the type of Trading view account you hold). Please note that this Indicator trigger's works even for the free trading view account and you do not need paid version.
Color classification - Buy triggers bars will be colored in Parrot green or Lime green color, Sell triggers bars will be colored in pink color. Regular Bullish and bearish candles will remain as Green and red.
ALERTS - I have coded automatic alert system in trading view and named them as ENTRY SIGNALS. You can add alerts to any of the stocks at whichever timeframe you prefer so that whenever there is a BUY or a SELL condition met, you will get notification or Desktop / Mobile app / Email etc.
IMPORTANT NOTE : This indicator does not guarantee any favorable results nor protect your from any loss. You own the complete risk of your trades. It is suggested that you use this indicator and do back testing for considerable period to understand how it works the the potential win rate it can give.

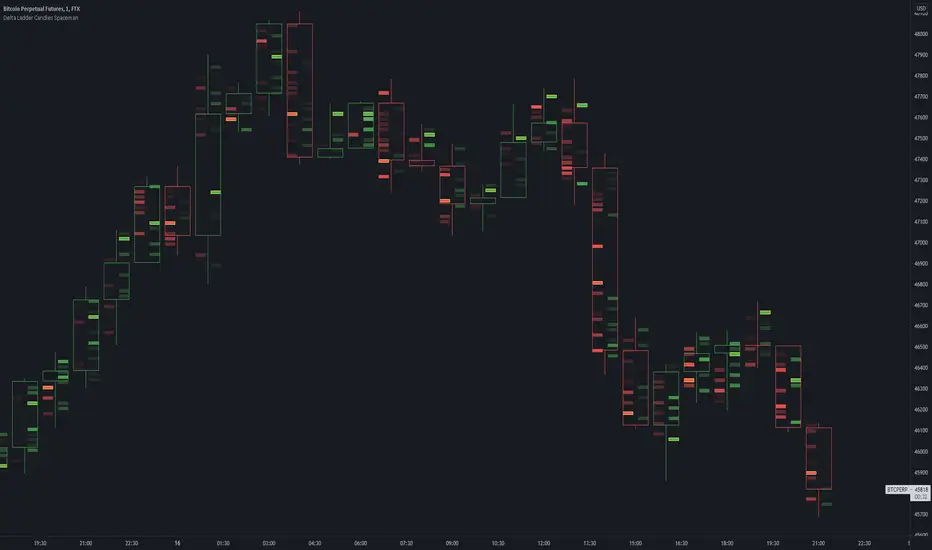
Delta Ladder Candles SpacemanDelta Ladder Candles Spaceman
This is a tool thats very useful for traders primarily a goal to provide all types of traders some confluence to price action trading.
Using calculation of time and volume, the candles are created for the higher timeframe adjusted for buying and selling delta volume.
This tool is useful for determining an increase in buy or sell pressure as well as possibly to show trapped buyers and sellers when near points of extremes such as swing highs and lows.
Auto tick size takes into account exisiting volatility and finding an average to generate a size that is likely applicable to the timeframe selected whilst also allowing
the indicator to generate data accurately on all potential charts.
To generate the data it creates a candle profile essentially with an empty body to allow for a look into the general formation of a candle.
The logic is to provide a simpler version of volume metrics for tv charts without compramising.
TO DO:
Consider a non delta variant setting.
Look back period increase potential, perhaps allow for set periods to create candles on ignoring all other data points.
Potetial intrabar state component to give a more accurate buy/sell delta
Volume Play This is going to be my first published indicator on Trading View. Thanks for TradingView for providing us this great platform And thanks for all of those who helps me to built this indicator and share there ideas.I cannot mention everyone name here believe me that list going to be huge.Everyone’s idea and help is much appreciated.This is how our TradingView community is growing day by day with kindness and knowledge. Every time I take so much from community in form knowledge that every time somewhere I feel that I also need to do something for community and finally day arrived .A gift from my side to community.A gift of indicator-VOLUME PLAY
This volume based indicator has High Relative Volume bar Background, Low Relative Volume bar background ,Volume Labels of Buying volume, Selling volume and Total volume count with percentage, Highest Volume in Percentage and Highest 5x volume count and 10x volume count of bar.Plus I have did column scaling to take Down pan input so you can switch pane or add in existing pane without any major problem And all this works on any time frame. Isn’t it good idea?
This indicator displays the volume of each session in a similar manner of the default volume indicator.However it add on the last bar Green and Red bar colours. Green means buying is more than selling and Red means selling is more than buying.On top of Some bar If number appears That means that’s volume is highest multiple volume of 5 and if number appears with label means highest multiple volume of 10.So simple without label volume counts means 5x and with label means 10x.
Now some of bars has background colour of Mint green , Pastel red and White.That’s highlight high relative volume bars with a highly buying activity range in Green and high relative volume bars with a highly selling activity range in Red And white background is low relative volume for that timeframe bar.
I am kind of person who don’t keep show indicator value enable all time.So it’s come in mind why not plot this values without enabling it.So I decided to show this values of buying, selling and total volumes on top near middle pane.Interesting thing is that I made a label with the help of pine script Table feature.Thanks a lot to Pine Team to add this new great feature! It’s great alternative for labels feature.Because of this feature I am able to locate buying, selling and total volume at right place where in most of scenario it will adjust.
Please note that all values are estimate.It’s not accurate.I show volumes in K,M form.Plus with volume I also try to show Buying And Selling volume in percentage form to get rough idea about what’s going on in instrument.Idea is to get better view of volume by splitting it into Buying , Selling and Total volume.This allows you to see are the bulls or bears in-control in relation to the overall Volume.
By default this indicator overlay is false but you can move this indicator pane to existing upper or lower pane.It will help to save space as well.If combine with two indicator at same pane then it will create two value scale at right side.So you will not loose any indicators values.By default I used 50% of vertical space in indicator scale factor.
I tried to make this indicator as accurate as inbuilt volume indicator with added extra feature.The main aim of indicator to get Idea of volume role in that symbol with that specific timeframe.Result might not be accurate but I expect somewhat nearby to accurate.
Kept source code open purposely for learners of pine script. Please avoid misuse or selling of this indicator.Remember Sharing Is Caring. If someone has suggestions or any addition then please comment below.Wishing you all abundance of health, wealth, and prosperity.
After all its all about VOLUME PLAY.
Disclaimer:-This indicator is not meant for buy or sell signals.This post and the script don’t provide any financial advice. This indicator/code IS NOT intended to be a formal investment advice or recommendation by the author, nor should be construed as such. Users will be fully responsible by their use regarding their own trading vehicles/assets.

{Gunzo} Bulls Power vs. Bears PowerBulls Power vs. Bears Power is a unique tool that displays on each candle the balance between the bears (sellers) and the bulls (buyers).
OVERWIEW :
This indicator is mainly based on the popular indicator “Elder ray” made by Dr. Alexander Elder in 1989. This indicator has been developed in order to determine the strength of the competing groups of buyers and sellers in the markets.
CALCULATION :
To measure the competing power of bulls and bears, the indicator compares the current high (maximum power of the bulls) and current low (maximum power of the bears) to the average price using a exponential moving average.
Bull Power = Current High – EMA 13 (closing)
Bear Power = Current Low – EMA 13 (closing)
This Elder ray indicator can also tell us more information about market conditions :
If the current high and current low are above the EMA 13, the bulls are totally in control on the market
If the current high and current low are under the EMA 13, the bears are totally in control of the market
If the EMA 13 is in between of the current high and current low, there is strong fight about controlling the market, there is possible reversal in this configuration
SETTINGS :
Fast MA Period : Fast moving average period (only used for buy sell signal)
Slow MA Period : Slow moving average period (only used for buy sell signal)
Display candle labels : Show/hide candle labels on the chart
Display only bear labels above X : Exclude all top candle labels on the chart below the value specified.
Display only bull labels above X : Exclude all bottom candle labels on the chart below the value specified.
Display opposite values : Show all candle labels on top (bearish) and bottom (bullish) or only show the candle labels for the winning force on the candle.
Display box for last candle : Show/hide the dominance boxes (red and blue) after last candle showing the last bear and bull power.
Display box after X candles : How many candles in the future the dominance boxes should be displayed.
Display slow / fast crossover (o) : Display crossover signals (circles) between fast line and slow line.
Display bear / bull fighting (x) : Display fighting signals (crosses) between bull and bears.
VISUALIZATIONS :
This indicator has 3 possible complementary visualizations:
Candle labels : The labels on top are the percentage of the bears on the candle, while the labels on the bottom are the percentage of the bulls on the candle. When the bulls are winning the labels are blue, when the bears are winning the labels are red, silver otherwise.
Box after last candle : The blue and red boxes after the last candle are the percentage of bears and bulls on the last candle of the chart. That boxes can be disabled in the settings if you feel it is redundant with the labels.
Signals : The signals are displayed at the bottom of the main area of trading. The orange “x” represents an area where bulls and bears are fighting hard. The blue “o” represents a buy signal (fast line crosses over the slow line) and the red “o” represents a sell sinal (fast line crosses under the slow line).
USAGE :
The most important rule in the usage of this indicator is :
“The higher the current bull power is (or bear power), the higher the chances are the next candle will also be bullish (or bearish).”
When the prices is increasing, it is very interesting to follow the bull power to verify that it is either stable or increasing. If the bull power keeps decreasing candle after candle, there is chances that in the next candles there will be a reversal.
When there is orange crosses in the signal area (bottom of the screen), it means that there is a big fight between bulls and bears and that the current price of the asset is probably stable. During these fighting areas, reversals are more likely to happen.
When there is a blue circle in the signal area (or red signal), it can be considered as a buy signal (or sell signal). These signals are determined by the crossover of the fast and slow lines of the total power of the bulls plus the bears.
LIMITATIONS :
As Pine script only allows to display about 50 drawings on the chart, the labels on the candles can not be printed on all the historical candles. The option “Display opposites” could be useful to hide unnecessary labels and then be able to display more older labels.
As the Elder ray indicator uses an average price (EMA 13 of closing price), the indicator may be lagging in some situations, but most of the time it will help to filter the bad signals contrary to the indicators that are too reactive.

Agisko Crypto Scalper v4.2 (BUY/SELL)Indicator that generates BUY and SELL shapes with alerts.
OSC scale can be configured to visualize the oscillator better. Nothing required, just for visualization.
DMI mark is by default 10 which is fine for most situations.
DMI range is the buffer zone where BUY orders will be created. E.g.: DMI mark 10 and DMI range 1 will create a zone for BUY when DMI+ is between 9 and 11 (10-1 and 10+1).
This works perfect on the 5 minute chart and is suggested to use the SELL alert for exits or use a take profit (TP) of 1% with optional trailing if you use bots like 3 commas.
Stoploss is the same. Use the SELL alert or set a manual stoploss of 2-5%.
Recent Trades - Real-Time Volume AnalysisRecent Trades - Real-Time Volume Analysis 📈
Another orderflow tool to add to the arsenal.
It works with trading pairs with volume data (i.e. it doesn't work for price indexes).
It is independent of the chart timeframe.
The interval can be set to a value between 1 to 1440 minutes (check settings).
It is possible to choose a different symbol than the one on the current chart (check settings).
This makes it easy to analyze multiple pairs at once .
Volume Chart
The Volume Chart shows the last 100 trades.
The chart scale can be either standard or zero-centred, and it can be compact or take the whole main chart area.
Trades Counter
The Trades Counter shows the Ratio of Buys and Sells for the chosen interval.
The % Percentage value for Buys & Sells, the trades Size and their number are also shown.
Trades Feed
The Trades Feed can show up to 50 recent trades (check settings).
The Trades can be filtered by min & max limits.
Set min & max values and type of trade to filter the Large Trades. They can be highlighted in the feed.
The Trades Feed colours may not work on some OSystems (e.g. Mac). It can be fixed in settings.
▪ Available trade info:
- elapsed Time since the trade was recorded
- Price at which the trade was executed
- Size of the trade
▪ Various Metrics are available at the bottom:
- Chosen Interval
- Chosen Symbol (Exchange & Pair)
- CVD direction
- Volume Delta amount
- Buys & Sells Ratio
- Total Trades and their Speed
- Total Volume and its Speed
- Number of Significant Trades, their % Percentage and their Speed
- Total Significant Volume, its % Percentage and its Speed
▪ The Numbers are formatted for better reading.
▪ Alerts:
- CVD direction change (⚠️this can trigger too often)
- Ratio level +/-
- Buy Volume - % Percent
- Sell Volume - % Percent
- New Trade (⚠️this can trigger too often if the volume is not filtered)
- Trades - Speed Limit
- Volume - Speed Limit
- New Large Trade
- Large Trades - Speed Limit
- Large Volume - Speed Limit
- Large Trades - % Percent
- Large Volume - % Percent
▪ ⚠️Some metrics can have abnormal values at the start of the interval.
To avoid triggering alerts in such conditions, set the number of seconds to wait before checking whether they should fire.
▪ Note:
- Initially, the Recent Trades panel is positioned to the far right of the chart, so it may be hidden in the future. Drag the chart to the left to reveal it.
- The panel Position can be adjusted in settings.
▪ Related Studies:
- Volume Delta
- CumulativeVolumeDelta-CVD
- Counters Ratio
- Heatmap-Support-Resistance-Volume-Clusters
▪ Some layout examples:

Phát Support and resistant This indicator provides basicSupport and Resistance Levels to the user whilst displaying Break signal tags. It also has the ability to let the user display more significant breaks
Only more significant breaks of these basic levels are displayed to the user when optimized which avoids noise and messy signals.
It will also display breaks with candles it deems to be bullish (e.g. having a longer upper or lower wick).
Notation
The notation of "Buy/Sell" denotes a break of either a Support or Resistance level with a volume greater than the threshold.
The notation of "Buy breakout/sellbrekout" denotes a bullish or bearish candle on the break.
Usage & Details:
Knowing when S/R level is broken with significance can be of great help to a trader. Many times significant levels may not be broken with significant force and the move is therefore weaker and possibly not worth trading.
Buy_Sell_Pressure_v0.62This is a script that I've been using for some time, which covers Volume for me.
It shows the total volumes in typical Column format, however this script attempts to suss out the details of WHERE that volume went (buying or selling), how EFFECTIVE that volume was at moving the price, and finally a COMPARISON of Buy vs. Sell volume MA's showing us the average buying and selling pressure over time, to assist us with determining the timing of a reversal.
The oscillator portion shows us the Volume Columns and the MA's with shadow or offset MA's to detect reversals and crossovers of self, and on the bar/candle chart the bars are colored according to which volume is more dominant at that time.
Alert conditions are available for the following events:
- Buying Crosses over Selling (Bar Color Change)
- Selling Crosses over Buying (Bar Color Change)
- Sell Pressure Cross Up / Down (Single MA Direction Change)
- Buy Pressure Cross Up/ Down (Single MA Direction Change)

[DS]Entry_Exit_TRADE.V01-StrategyThe proposal of this script is to show the possible trading points of BUY and SELL based on the 15-minute chart of the Nasdaq Future Index. The start point of the strategy was schedule for 2021/01/01 and until the time of this publication (2021/01/31), for 1 index contract the results presented area a Gross Profit of 2.97% with a Net Profit of 1.35%.
█ FEATURES
The indicator shows on the graph the position of the MACD and TSI indicators that are the places of strength among Buyers and Sellers.
It's possible to observe a sharp fall or rise in the price of these positions.
On the current candle, a label is displayed containing the value of the William %R Mod indicator, which will display the OverBought position (dark red) and OverSold position (dark green). The other colors like light red and green are the regions where the price makes the decision of which direction to go.
There are also other indicators:
a) The positions of the BUY (light green) and SELL areas (light red);
b) The label with the position of BUY (dark green) and SELL (dark red) with the line that connects these points;
c) DEMA 72 (orange);
d) EmaOchl4 in the color green for BULL and red for BEAR market;
e) Pivots high and low
f) Maximum (purple light) and minimum areas (blue light)
█ FUNCTIONS AND SETTINGS
The indicator uses the following functions:
(1) DEMA - Double Exponential Moving Average (08,17,34, 72)
(2) ema () - Exponential Moving Averge (72, ohlc4)
(3) plot()
(4) barcolor()
(5) cross()
(6) pivots ()
(7) William R% Md (OverBought = -7, OverSold=-93)
(8) Maximum and Minimum Value
(9) fill()
(10) macd () - Moving Average Convergence Divergence (Fast Lengt=12, Slow Length=26, Source=close, Signal Smoothing=9)
(11) tsi() - Trading Strenght Indicator==> Índice de Força Real ( IFR ) (Long Length=72, Short Length=17, Signal Length=17)
(12) Buy and Sell TRADE Points
█ PERFORMANCE AND ERRORS
The positions of BUY and SELL points are defined through the crossing of the Dema 34 candles with the Ema Ohcl4. As it is an indicator, it can present different positions from de market direction. Thus there is a need to observe the direction of the market in order to verify whether the indicate decision is really acceptable. The decision to BUY or SELL an asset must be well studied to avoid financial losses. The indicator will only help you in this decision, is your responsibility the decision of entering or leaving an asset.
█ THANKS TO
PineCoders for all they do, all the tools and help they provide, and their involvement in making a better community. All the PineCoders, Pine Pros, and Pine Wizards, people who share their work and knowledge for the sake of it and helping others, I'm very happy and grate full indeed.
█ NOTE
If you have any suggestions for improving the script or need help using it, please send a message in the comments

Precise_SignalThis signal combines a portion of Chris Moody's 2014 SlingShot and my 2017 MTF Indicators. Both of our prior scripts over indicated Buy and Sell Points. This signal indicates a buy or sell point much less than our prior scripts did but with absolute precision.
I would say it is 100% accurate, but that is because I am yet to find a timeframe and symbol where the Buy signal failed to see the equity move up or the Sell signal failed to see the equity move down over the next 5 bars. I have tested 2000 charts so far. To be safe, I would rather state this indicator is accurate nearly 100% of the time.
The indicator is made up of 2 main portions and both of them have to agree on a buy or sell in order to indicate such with a vertical green or maroon bar beneath the chart. If there is a failure to agree, nothing is signaled.
Indicator 1 combines a stochastic of a 3 hour chart and a daily chart to determine when the stochastics are in agreement on direction. When there is agreement, both of them MUST cross from a buy state to a sell state and vice versa at exactly the same time. This is difficult to achieve and it is already rare for this occurrence to produce a signal. When a signal is produce it is combine with Chris Moody's 2014 SlingShot Indicator which conservatively determines Buy and Sell signals based on EMAs and market direction. Signals from his SlingShot are infrequent.
BUY Signal
When my MTF signals Buy at the same time that the SlingShot signals a Buy, a vertical green bar will appear in the window containing this script. The vertical bar is based on the close price of the equity and is only final when the close price is final. A BUY signal means the equity will move up potentially as early as the next bar and achieve a higher value from the close price on the signal bar.
SELL Signal
Likewise, a sell signal from the MTF at the same time as a sell signal from the SlingShot will create a maroon bar in the window containing this script. The vertical bar is based on the close price of the equity and is only final when the close price is final. A SELL signal means the equity will move down potentially as early as the next bar and achieve a lower value from the close price on the signal bar.
The default values for this script are hard-coded into this script. You can edit any of the value you would like to play with other timeframes, stochastic, and moving average lengths.
I have played with these values and have hard-coded the ones that are most accurate. Please let me know if you find others that work.
Hopefully this becomes an extra tool in your technical trading toolkit.

Trend Chaser Pro Trend Chaser Pro( TCP ) is a powerful indicator that is made using several years of experience in trading and coding with a lot of backtesting. it can be used as a Stand-Alone indicator as well as in combination with other indicators to provide more confluence when trading. The main purpose of TCP is to help market participants by providing buy and sell signals as well as indication of Tops and Bottoms in any trading market.
- There are 3 main components to TCP :
1.Top/Bottom Indicators:
Tops are indicated with "❖". There are two colours that are used. light red for Tops and dark red for Max Tops
Bottoms are indicated with "✦". There are also two colours that are used to demonstrate Bottom conditions. light green indicates Bottoms and dark green indicates Max Bottoms
2. Buy/Sell indicator:
Buy signals are indicated with a green "●" and Sell signals are indicated with a red "●" using price volatilities with
calculation of price movement in trending and ranging environments .
3.Bars colour
for a clearer visualisation of Buy/Sell indicator signals , colour of bars change from light blue to orange and vice versa.
light blue bar colour is an indication of uptrend and provides buy signal
orange bar colour is an indication of downtrend and provides sell signal
p.s. Period can be changed to have more aggressive (if decreasing the number) or more conservative( if increasing the number) signals.
(*please always remember that past performance of this indicator is not an indication of its future performance and you always need to do your own research before taking action in financial markets*)
(** PM to request access**)

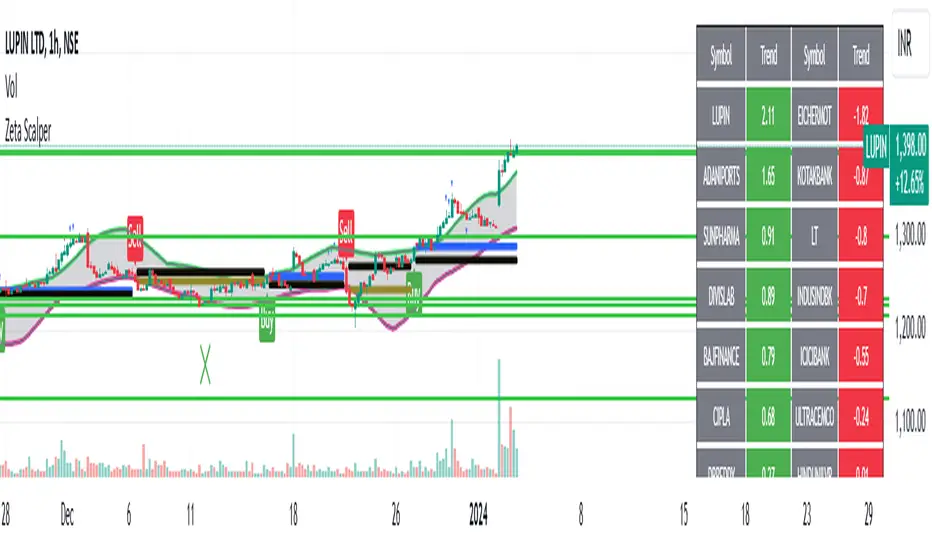
Zeta ScalperWhat is Scalping?
Scalping is a trading strategy aimed at profiting from quick momentum in a volatile index or stock.
Traders who use such strategies place anywhere from 10 to a few hundred trades in a single day.
The idea behind such type of trading is that small moves in an index or stock price are much easier to capture than the larger moves.
Traders who use such strategies are known as scalpers. When you take many small profits a number of times, say 10 points scalped 20 times per day, they can easily add up to large gains.
An Option Buyer's Biggest Enemy is Time Decay and when you scalp, you do not allow the time decay to eat your Option Premium as your Entry and Exit is often quick enough.
What is Zeta Scalper?
Zeta Scalper indicator is a momentum based indicator which tries to detect momentum based upon a number of Candle Stick Patterns.
When it thinks a move has the potential to turn into a big move, it generated its Buy/Sell Signals.
It is a well known fact that actual drivers of the market are Big Institutions, Mutual Funds & Big Guys with deep pockets.
They have large amounts of money to invest and they buy & sell in bulk.
When they buy, often their objective is to buy at lower levels (below average price of the day) & when they sell they sell at higher levels (above average price of the day).
Zeta Scalper seeks to detect this activity. When aggressive buying or selling starts where Buying & Selling Forces become unequal, the Price starts moving in one direction with candles making Higher Highs or Lower Lows.
Zeta Scalper detects these Higher Highs or Lower Lows and generates Buy or Sell signals when this happens.
In order to use this indicator, simply deploy this on your chart, and wait for Buy/Sell signals.
It works on all time frames including 1 min. 3min. 5min. & 10min. etc.
When a Buy Signal is followed by Sell signal (let it be after 3 - 4 candles or after many candles) or vice-versa, you have to switch your position to make most of the reverse move.
It is a general purpose indicator and may be used on stocks, commodities and currencies alike and is not meant for any specific market.
How to Take Buy/Sell Entry with Zeta Scalper?
Whenever you see a Buy Signal, mark its closing price with a horizontal line and as soon as a candle breaks this candle's High, it is time for you to take Entry.
Your STOP LOSS could be just 0.5% below your Entry Price, hence, no big loss even if things go wrong.
Keep moving your STOP LOSS up as the price moves in your favour and when market turns around and you see a SELL signal, it is time to book your BUY position profit and take Entry on SELL Side now and so on.
How to get this indicator?
This is invite-only indicator. Get in touch with us using information given below in Signature field to try this tool FREE.
Cryptowale - LynxWhat is Lynx?
Lynx is trend following centered oscillator, which accurately tells when to buy and when to sell, where to book partial profits, and when to rebuy for continuation trades.
Signals
BUY: this indicates to buy
SELL: this indicates to sell
CL: this indicates Continuation trade for BUY, in simple words BUY
CS: this indicates Continuation trade for Sell, in simple words SELL
TP: this indicates to take profit
Strategy
Use this indicator on higher timeframes only(above 4 hour charts)
Always wait for confirmation of signal. Signal confirms on candle close. You can filter signals with baseline in Lynx settings.

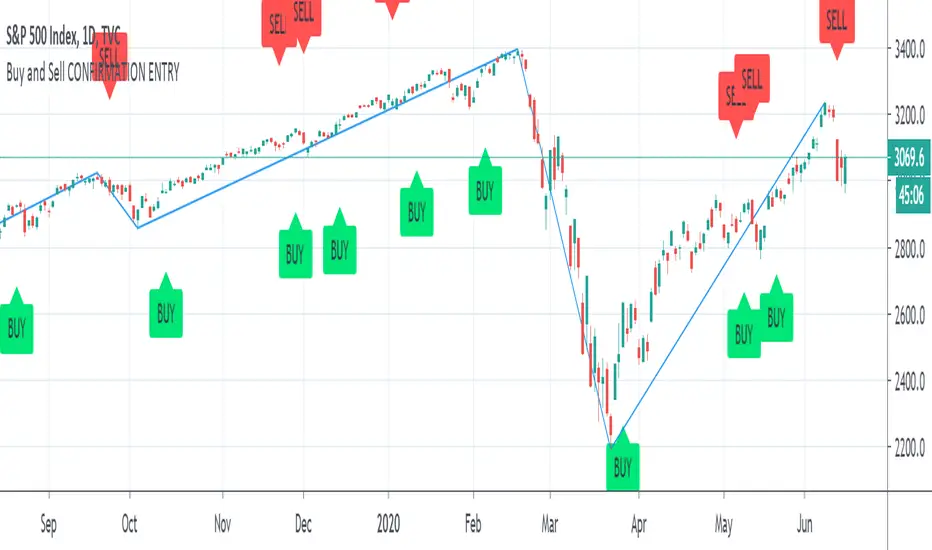
Buy and Sell CONFIRMATION ENTRY"Buy and Sell CONFIRMATION ENTRY" Product Description:
The indicator identifies market trends with visual buy/sell alerts on the chart.
Useful on higher timeframes available on Tradingview (ex: 4 hours, 1 Day).
The "Buy and Sell Confirmation" Indicator combines Moving Average Convergence Divergence and Relative Strength Index, which triggers technical signals when it crosses above (to buy) or below (to sell) its signal line. The crossovers transformed in buy and sell indicators is also taken as a signal of a market is overbought or oversold. The swing lines help you draw Elliott Waves to understand better where the market is heading.
The indicator can be used for every type of market: indices, stocks, cryptocurrencies, currencies and others.
This study is not a guarantee profit. You should backtest or trade virtual money before using this study on your real portfolio, as it is intended to be a tool and not a fortune teller.
Disclaimer: Trading and investing in the stock market and cryptocurrencies involves substantial risk of loss and is not suitable for every investor. The content covered in this videos is NOT to be considered as investment advice. I’m NOT a financial adviser. All trading strategies are used at your own risk.
Please send me a private message on TradingView to gain access to the script.
Volume strength with Accumulation Distribution in Cycle of understanding psychology behind candle formation, i posted my script which is intended to determine the buying and selling pressure with candle wicks.
Idea behind wicks was although buyer and seller tried to make price high and low but it did not sustain indicating weakness in strength.
in this script i have tried to see the volume along with candle formation and structure. i tried to measure and derive volume information with body length of candle. Also plotted Williams Accumulation distribution to understand real trend ( Demand( Accumulation ) vs Supply ( Distribution ) )
Once can see difference in Usual volume indicator and information derived from this custom indicator with combination of WAD.

McMillan Volatility Bands w/ Buy & Sell Signals [optstrategist]BACKGROUND
McMillan Volatility Bands are an alternative approach to John Bollinger's "Bollinger Band" study and developed by world-renowned options trader and author Lawrence G. McMillan. Given his background in options trading, it was natural for Lawrence to approach any volatility-based study in the same manner options are priced --using Black-Scholes model. This model of pricing assumes a financial asset's volatility should be measured in percentage change rather than absolute value change.
OVERVIEW
The McMillan Volatility Bands indicator for TradingView will plot the 3 and 4-standard deviation bands around a 20-day moving average. This is how Larry has always used this system. The user can, however, change the standard deviation value as well as the moving average length to their preferred setting. This indicator can be used on any asset and on any timeframe.
Furthermore, the indicator will plot buy and sell signals based on a trading system used by Larry in his flagship newsletter publication The Daily Strategist. The system gives a signal when price closes outside the 4-sigma band and then closes back within the 3-sigma band. That 'signal bar' will be colored red or green for a sell or buy signal setup, respectively.
Finally, an arrow will be plotted on the chart where the system would actually enter the trade. This is determined when price trades a little beyond the extreme of the 'signal bar'. The level by which price has to go beyond the 'signal bar' is an input parameter and can be adjusted by the user. We've chosen the default value of 0.34. This means, the indicator will not give a buy or sell entry until the price moves: 1/3 x beyond the extreme signal bar. This is to prevent getting whipsawed by some setups that never really move in your favor. We've found it successfully removes the less-valuable trade setups.
PARAMETERS
ma_length => length of the moving average that the volatility bands work off of
outside_sigma => standard deviation of outer volatility band
inside_sigma => standard deviation of inner volatility band
entry_trigger_cushion => this refers to the percentage of the signal bar's range. The default value is 0.34. This means price will need to move 1/3 (~34%) of the signal bar's range beyond the high (for a buy) or low (for a sell) of the signal bar to trigger a buy/sell entry. This entry plots the arrow on the chart. We have found requiring this extra move in price eliminates many of the less-desirable signals at the expense of entering the better signals a little later.
WANT TO PURCHASE OR NEED MORE INFORMATION ON McMILLAN VOLATILITY BANDS?
Visit the link below to see purchasing options as well as screenshots of the indicator and how we trade it at McMillan Analysis Corp.
