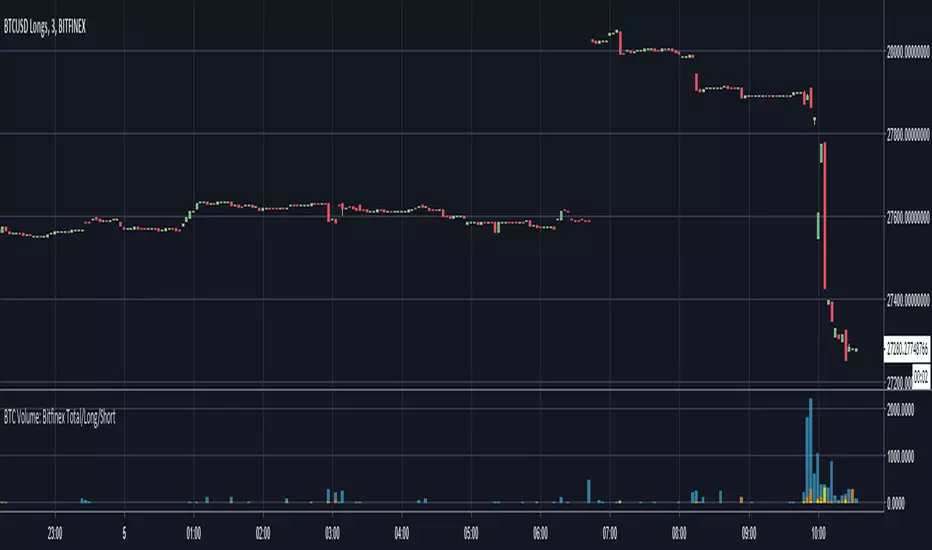
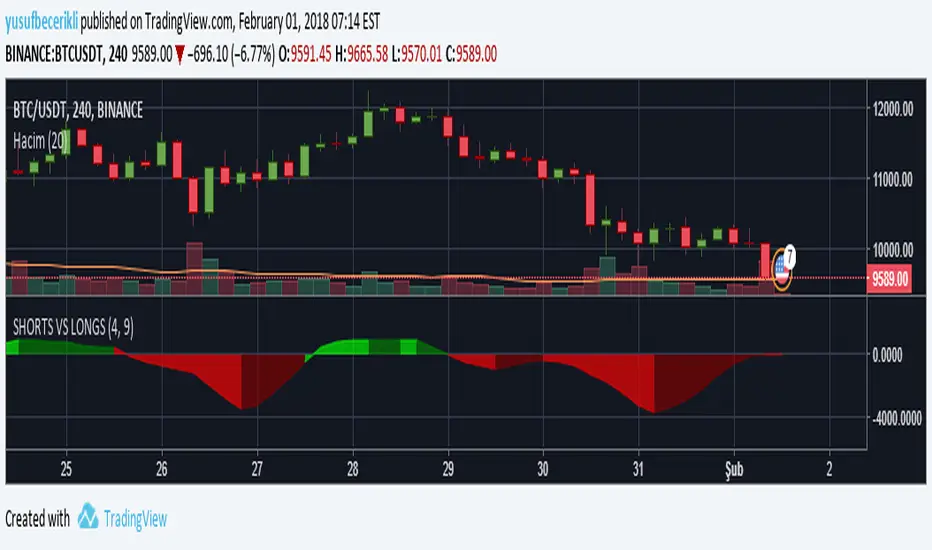
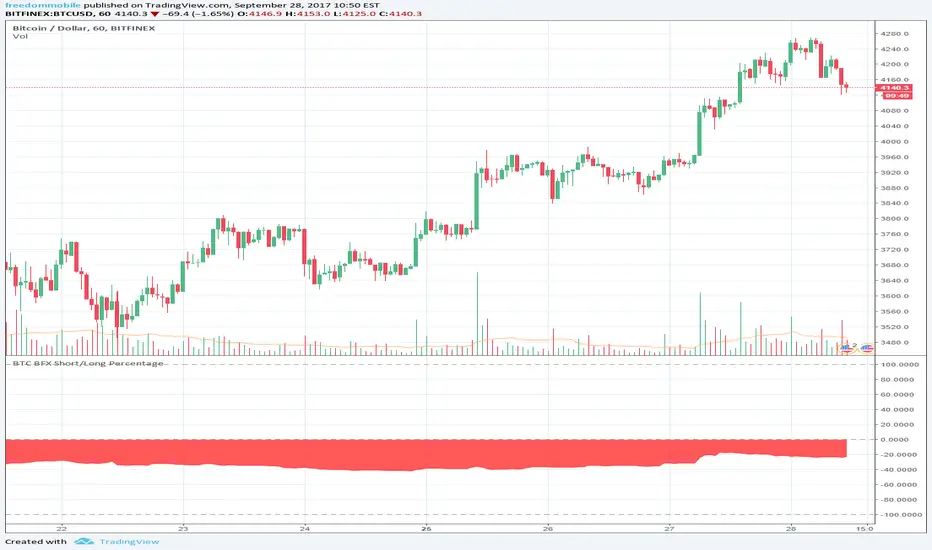
BTC Volume: Bitfinex Total/Long/ShortQuick little script to show Bitfinex LONG/SHORT positions in context to overall volume on the TF. Works best on small TFs to eliminate fluctuation in margin positions impacting the 'accuracy' of volume.
Base Color Scheme
Blue: Total Bitfinex traded volume
Yellow: Assumed Volume of BTCUSDLONGS (Close Position - Open Position)
Orange: Assumed Volume of BTCUSDSHORTS (Close Position - Open Position)
Work is based on conversations and community interaction through Crypto Traders Pro.
ค้นหาในสคริปต์สำหรับ "BTC"
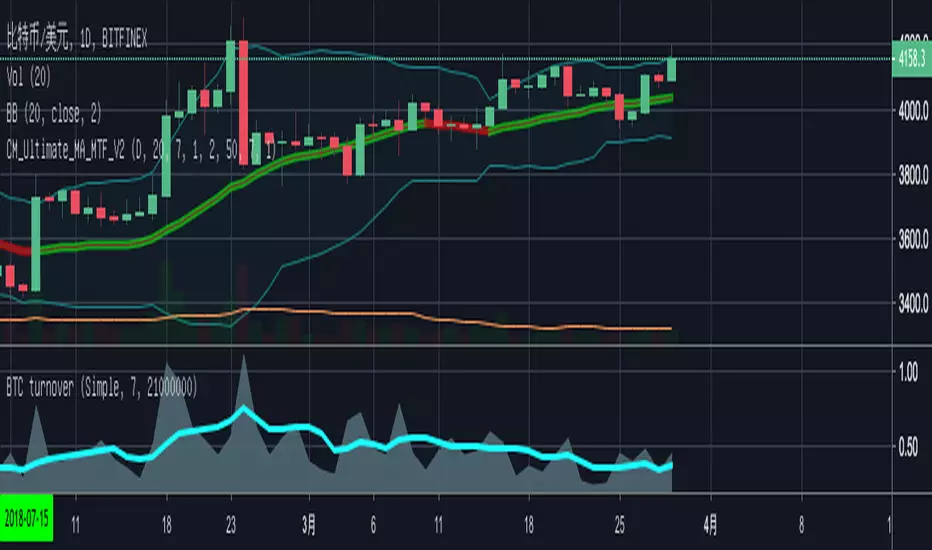
BTC Turn Over Rate (Multi-Exchange) [v2018-08-22]Turnover rate is used to judge the period when the main chip is concentrated and dispersed.


BTC Prices (BFX,BITS,CB,BINANCE)Minimal price tracker. Publishing just in case it deletes itself two times. Haha.
Color coded. It will be easy to add other exchanges if need be.

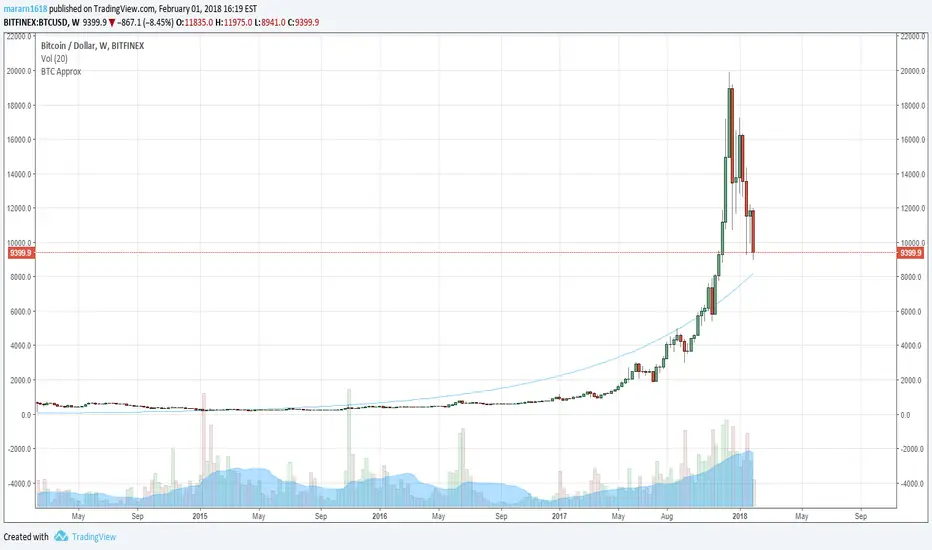
BTC Approximation (BETI) - Bitcoin Exponential Trend//based on
//https://www.wolframalpha.com/input/?i=e+%5E+(+0.00331836433279664++(+number+of+seconds+since+jul+17,+2010+12pm+UTC%2F86400%2Fseconds+)+-0.120774828196607+)
//https://bitcointalk.org/index.php?topic=470453.680
BTC Price Spread - Coinbase & Futs - Premiums & DiscountsThis indicator takes the price of Bitcoin on Coinbase and the futures price on Mex, and compares it the average price of Bitcoin across other major exchanges.
This essentials give us a spread at which Bitcoin is going for.
In turn, this could be a possible tool to help determine market sentiment.
This indicator was created for experimental purposes.
Use at your own digression.

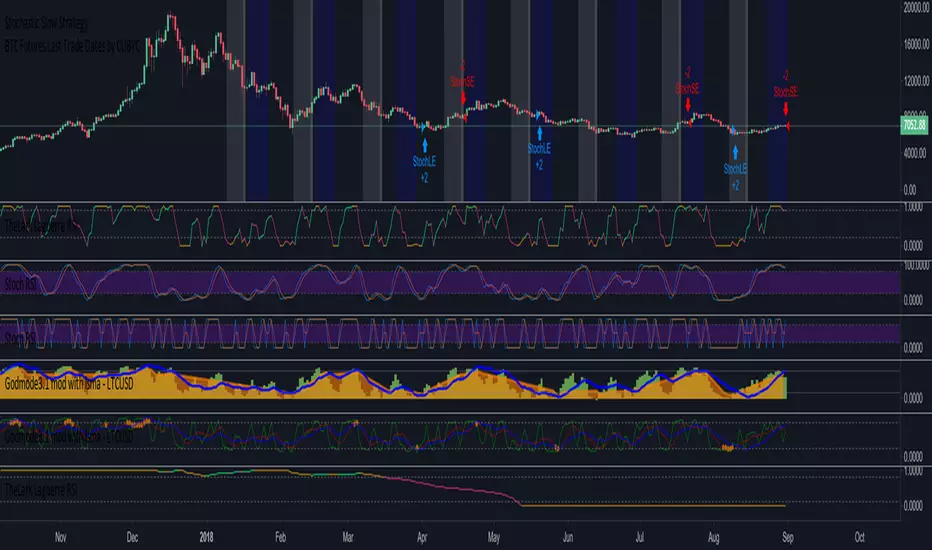
BTC Futures Settlement DatesShows the CBOE and CME settlement dates as horizontal lines, with the option to show a 7 day warning in the background. This should hopefully give ample warning.
I intend to update the script as new dates become available but please PM if I've forgotten.

BTC: CME Futures vs. Exchange SpreadsAs you can see, this script plots the current (10-min. delayed) CME Futures price versus Bitfinex, Bitstamp, and Coinbase prices.
It's displayed here on a 30 minute view because at the time of writing the futures have been alive for approximately one day. The script will likely be more useful on longer time frames as a macro-level indicator.
It's pretty simple to adapt this to additional exchanges


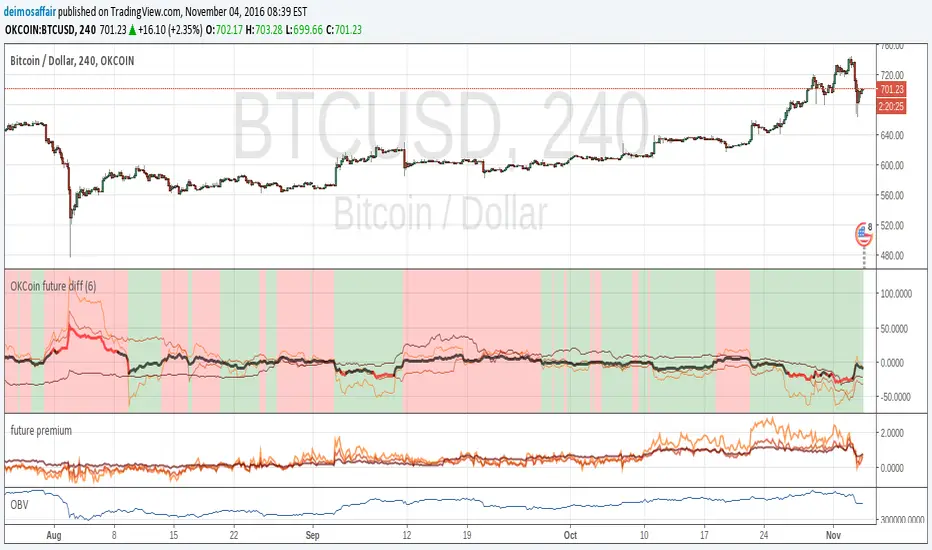
OKCoin future diffThis indicator checks the accuracy of okcoin futures against the current index. Example, check how the 1W future from 7 days ago matches the current spot value. The matches are on the 1W, 2W, 3M futures
The indicator bundles them together, makes a weighted average and shows it all.
the thin lines are the futures deltas for each of the futures(check the code to see the color of each).
the thick line is the compound indicator, the line is red when the value is too far off the spot price, black when it's <5%
background is green on "bullish", red for "bearish", take it as you want with many grains of salt :)
there is an input value (default = 1) to adjust time scales. the value is a multiplier for the number of periods in a day.
Example:
1D chart, input = 1
4h chart, input = 4h * 6 = 24h
using the incorrect adjustment for the wrong time scale, makes the indicator (even more) meaningless ;)
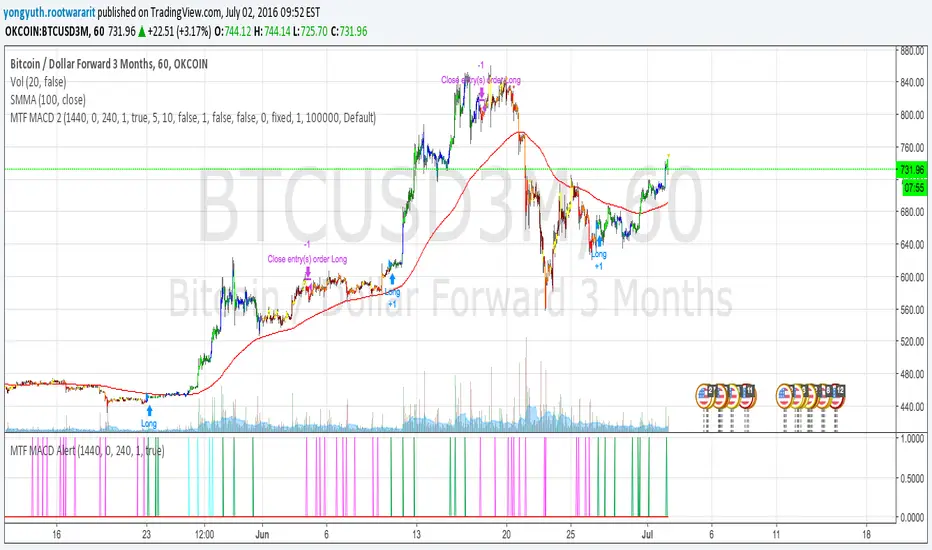
MTF MACD 2 By YuthavithiIf you want a good strategy without repaint. This one might be for you. Excellent profitable for BTCUSD3M for OKCoin.
It uses multiple time frame MACD for trading decision. To avoid repaint, set the delay period = 1 for both long term and midterm.
The idea is that, if long term, mid term and current time frame all agree on traidng direction, the trade will take place.
I also uses it in my automated trading bot with good result.
www.tradingview.com
(CRISIS) aggregateBTCvol v0.2.4Aggregate multiple exchange volumes into single indicator
This update adds:
*Moving Average
*Add/change/disable to up 6 securities without touching code.
*Monochrome mode for dark themes.

BTC Volume Index 1.1 beta [Dia]Indicator calculates total volume across multiple bitcoin exchanges. The influence of each exchange can be adjusted seperately.
0 fee exchanges default to 50%
0 fee futures default to 10%
Define custom lookback periods for price breakout detection.
Look for low-volume price reversals in those candles immediately following high volume peaks. The lower the volume and the greater the open/close price difference of that 2nd candle is compared to the previous one, the higher the likelihood of a local top/bottom being in.
Note:
Bar highlighting is still experimental, future versions will include better filtering options.
Use for confirmation only, not as standalone trading system.


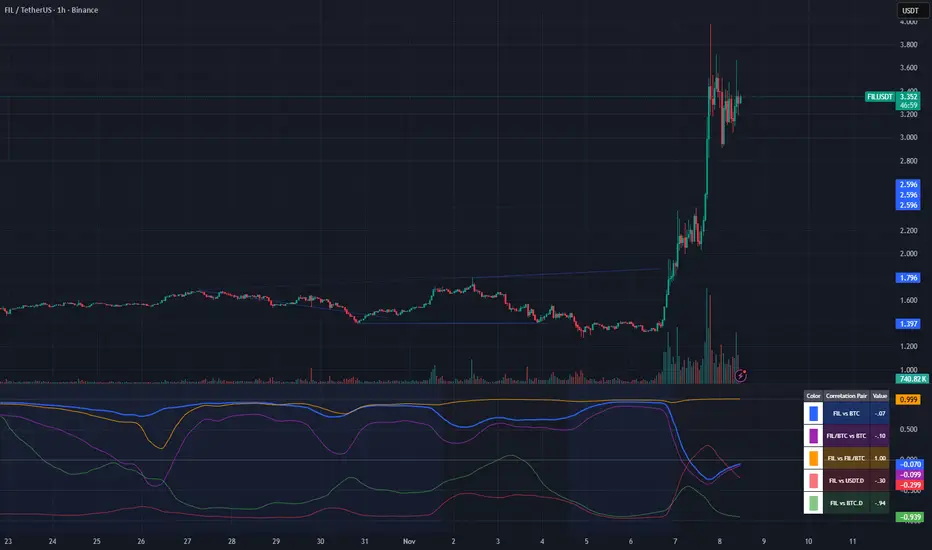
Crypto Correlation Oscillator# Crypto Correlation Oscillator
**Companion indicator for Tri-Align Crypto Trend**
## Overview
The Crypto Correlation Oscillator helps you identify **alpha opportunities** and **market regime changes** by showing how closely your coin follows Bitcoin and other assets over time. It displays rolling correlations as an oscillator in a separate pane below your price chart.
## What It Does
This indicator calculates **Pearson correlations** between different trading pairs on a rolling window (default: 100 bars). Correlations range from **-1.0** (perfect inverse relationship) to **+1.0** (perfect positive relationship), with **0** meaning no correlation.
### The 5 Correlation Lines
1. **Blue (thick line) - Coin vs BTC**: The most important metric
- **High correlation (>0.7)**: Your coin is just following BTC - no independent movement
- **Low correlation (<0.3)**: Your coin has **alpha** - it's moving independently from BTC
- **Negative correlation**: Your coin moves opposite to BTC (rare but powerful)
2. **Purple - Coin/BTC vs BTC**: Inverse relationship check
- **Negative values**: When BTC rises, your coin weakens relative to BTC
- **Positive values**: When BTC rises, your coin strengthens against BTC
3. **Orange - Coin vs Coin/BTC**: Structural consistency check
- Shows how well the Coin/USDT and Coin/BTC pairs maintain their mathematical relationship
- Unusual values can indicate liquidity issues or market inefficiencies
4. **Light Red - Coin vs USDT.D** (optional): Stablecoin dominance correlation
- Shows how your coin correlates with USDT dominance
- Useful for understanding flight-to-safety dynamics
5. **Light Green - Coin vs BTC.D** (optional): Bitcoin dominance correlation
- Shows how your coin correlates with BTC dominance
- Helps identify altcoin season vs BTC dominance cycles
## How to Read It
### Finding Alpha Opportunities
- **Low blue line (<0.3)**: Your coin is decoupled from BTC → potential alpha
- **Blue line dropping**: Coin is gaining independence from BTC
- **Blue line spiking to >0.9**: Coin is a "BTC clone" with no independent movement
### Regime Change Detection
- **Blue line crossing 0.5**: Major shift in correlation behavior
- **Purple line turning negative**: Coin starting to weaken when BTC rises (warning sign)
- **Sharp correlation changes**: Market structure is shifting - adjust strategy
### Visual Zones
- **Blue background**: High correlation zone (>0.7) - coin just following BTC
- **Red background**: Inverse correlation zone (<-0.5) - coin moving opposite to BTC
### Reference Lines
- **+1.0 / -1.0**: Perfect correlation boundaries (dotted gray)
- **+0.5 / -0.5**: Moderate correlation thresholds (dotted gray)
- **0.0**: Zero correlation line (solid gray)
## Dynamic Legend
The legend table (top-right) automatically shows the actual symbol names based on your chart:
- **Example on SOLUSDT**: Shows "SOL vs BTC", "SOL/BTC vs BTC", "SOL vs SOL/BTC", etc.
- **Color boxes**: Match the plot colors for easy identification
- **Live values**: Current correlation numbers update in real-time
- **Tooltips**: Hover over labels for interpretation guidance
## Configuration
### Key Inputs
- **Correlation Lookback** (default: 100): Number of bars for rolling correlation window
- Shorter = more reactive, noisier
- Longer = smoother, slower to detect changes
- **Correlation Smoothing** (default: 5): EMA smoothing period for raw correlations
- Reduces noise while preserving trends
- **Symbol Detection**: Auto-detects symbols from your chart, or use manual overrides
- **Dominance Pairs**: Toggle USDT.D and BTC.D correlations on/off
## Usage Tips
1. **Combine with main Tri-Align indicator**: Use correlation for context, Tri-Align for entry/exit signals
2. **Watch for divergences**: Correlation changing while price moves in sync can signal upcoming shift
3. **Adjust lookback period**: Use shorter (50-70) for day trading, longer (150-200) for position trading
4. **Focus on the blue line**: It's your primary alpha indicator
## Technical Details
- **Calculation**: Pearson correlation coefficient with EMA smoothing
- **Data source**: Close prices from `request.security()` (multi-timeframe capable)
- **Update frequency**: Every bar on your selected timeframe
- **Overlay**: False (displays in separate pane)
## Quick Interpretation Guide
| Blue Line Value | Interpretation | Action |
|----------------|----------------|--------|
| > 0.9 | Coin is a BTC clone | Avoid - no alpha opportunity |
| 0.7 - 0.9 | High correlation | Standard altcoin behavior |
| 0.3 - 0.7 | Moderate correlation | Some independence emerging |
| < 0.3 | Low correlation | **Strong alpha opportunity** |
| < 0 | Inverse correlation | Rare - potential hedge asset |
| Purple Line | Interpretation |
|-------------|----------------|
| Strongly negative | Coin weakens when BTC rises - risky |
| Near zero | Coin/BTC pair moves independently of BTC |
| Positive | Coin strengthens with BTC - ideal |
## Version History
### v1.0 (Initial Release)
- Pearson correlation calculation with configurable lookback
- 5 correlation pairs: Coin vs BTC, Coin/BTC vs BTC, Coin vs Coin/BTC, USDT.D, BTC.D
- EMA smoothing to reduce noise
- Visual zones for high/inverse correlation
- Dynamic legend with symbol name extraction
- Auto-symbol detection matching main Tri-Align indicator