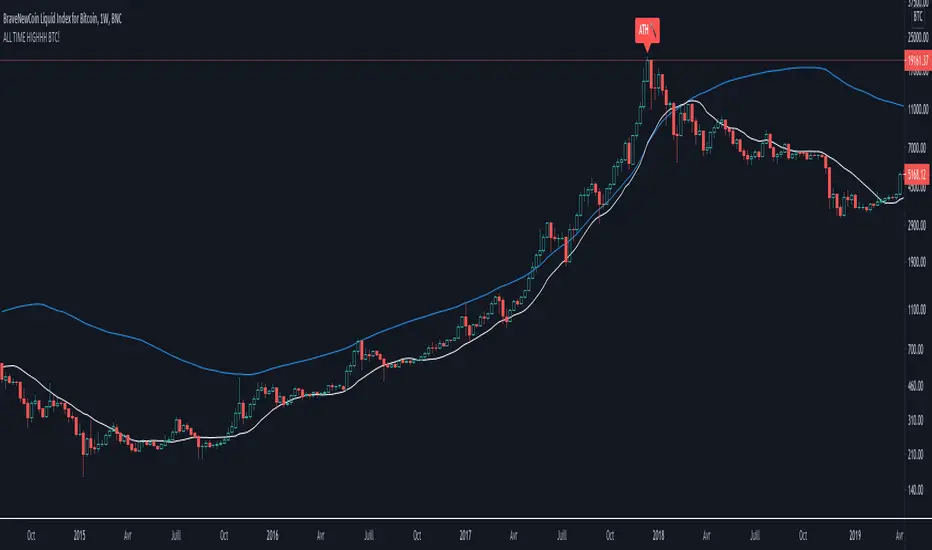
ALL TIME HIGHHH BTC!
Ola Amigos,
Weekly indicator.
This indicator, more commonly called "the Pi indicator", is based on the use of two moving averages: mm50 and mm16.
By dividing a mm50 in order to try to get as close as possible to PI, we fall back on mm16.
50/16 = 3.13
When the white curve passes above the blue curve, we are on historic highs.
It is very easy to test on the BLX, being the graph with the most history.
We can say thank you to JDC for this nice discovery which remains very useful for the rest of the BTC run.
Love!
Ola Amigos,
Weekly indicator.
Cet indicateur, plus communément appelé "the Pi indicator" est basé sur l'utilisation de deux moyennes mobiles : mm50 et mm16.
En divisant une mm50 afin de chercher a essayer de se rapprocher le plus pres de PI, on retombe sur la mm16.
50/16= 3.13
Lorsque la courbe blanche passe au dessus de la courbe bleue, on se trouve sur des plus hauts historiques.
Il est très facile a tester sur le BLX , étant le graph avec le plus d'historique.
On peut dire merci a JDC pour cette jolie découverte qui reste tres utile pour la suite du run BTC .
Love!
ค้นหาในสคริปต์สำหรับ "BTC"
[5F] Total circulating Bitcoin-═════════════════════════-
📋 Description :
This script displays several informations about Bitcoin :
the maximum number of Bitcoin
number of mined BTC
number of unmined BTC
calcul them in %
shows the previous halving date
📆 Note : need to be in dayli resolution or higher
Thanks to all Pinecoders who share their work with the community.
-═════════════════════════-

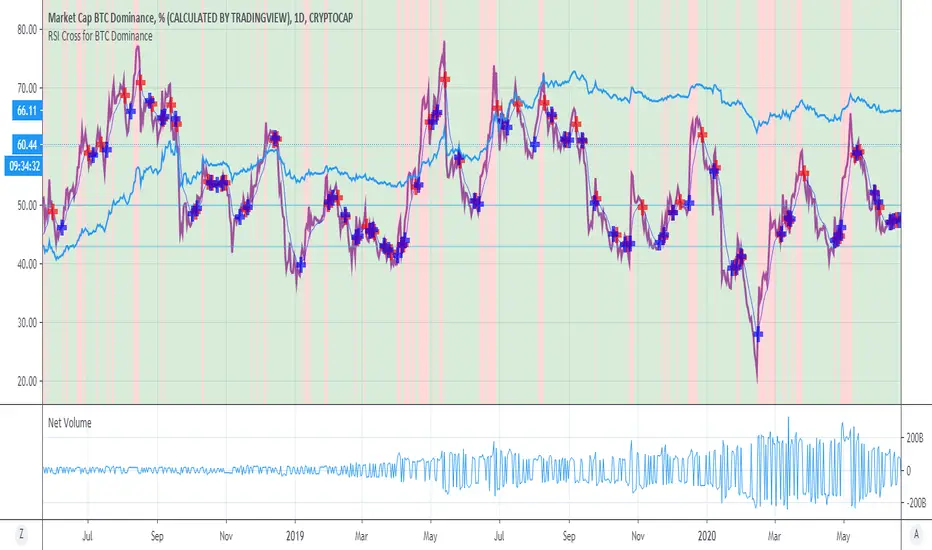
RSI Cross for BTC DominanceIn order to get stable alt-coin investments, the BTC dominance (BTC.D) is of parmaount importance.
With this script, I plotted both RSI (28) and the EMA (9).
Whenever the RSI is decreasing and is below EMA, alt-coins are more likely thrive.
Viceversa, when the RSI is mounting the is at least 10% above the EMA, BTC is growing in dominance.
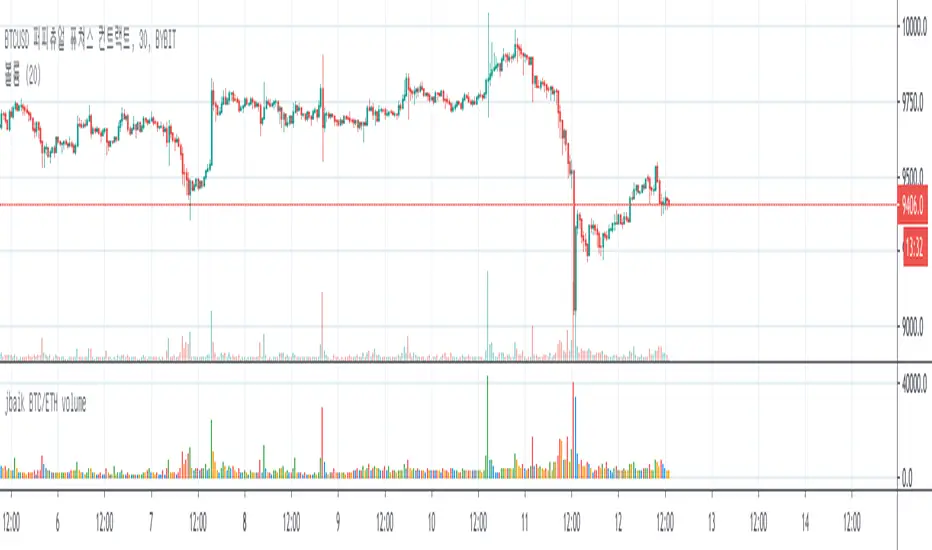
jbaik BTC/ETH volumeShows total BTC/ETH volume of different exchanges (non future)
Platform included :
COINBASE, POLONIEX, BITSTAMP , BITFLYER, KARAKEN, BINANCE, GEMINI , BITHUMB, HUOI, OKEX
Can turn on/off BTC or ETH volume on setting
Shows different colour per volume bar :
when price is higher and volume is higher than previous => green
when price is higher but volume is lower than previous => blue
when price is lower and volume is lower than previous => orange
when price is lower but volume is higher than previous => red
Cracking Cryptocurrency - Quadrigo Position SizingCracking Cryptocurrency - Quadrigo Position Sizing
This indicator is designed to work in conjunction with our position sizing calculations pursuant to the Quadrigo Indicator.
This indicator will allow a trader to input their Account Balance and desired Risk % that they have decided, through their statistical analysis, provides them the greatest Return on Equity balanced against minimal draw down.
Once inputted, the Data Window will display the recommended USD Position Size. It will also pull the current price of Bitcoin, so that a recommended BTC Position Size will be calculated as well, making orders very easy to enter on exchanges that deal in BTC values for order value.
This indicator is optimized for the aesthetics of traders using TradingView's mobile app. With a simple glance you can determine your proper position size for any trade. This is helpful because the larger Quadrigo indicator can take up a lot of screen real estate when on mobile version.

Cracking Cryptocurrency - QuadrigoCracking Cryptocurrency - Quadrigo
An objective method of determining an initial Take Profit and Stop Loss, based on true market volatility and not arbitrary price levels. This indicator gives the user a powerful range of input variation, from Average to Median True Range and a myriad permutations of smoothing and look back lengths, to build an objective value from which to measure profit and stop levels.
This indicator also automatically calculates a recommended position size based on our position sizing methodology. Simply input your capital amount and desired risk level. This indicator will display your optimum position size in USD or BTC, even giving you the flexibility to select your desired exchange for BTC/USD conversion calculations.
Features & Functions
Set custom multipliers for Take Profit and Stop Loss Levels.
Select between Average or Median True Range Calculations.
Select smoothing type and look back length for True Range.
Input custom True Range Level for dialing in precise measurements.
Position Size Calculator.
Aesthetically pleasing display of Take Profit and Stop Loss Levels.
Aesthetically pleasing dashboard display of all relevant trade information including Potential Loss, Distance to Stop Loss, and TR Percentage, among other data.
Indicator displays quantity of position to be removed at each take profit for convenient order setting flow.
---
Purpose
To give clear objective stop losses and take profit levels based off price volatility rather than arbitrary price levels, percentage points, ticks, pips, etc.

Bitcoin SpreadThis indicator display the current lowest and the highest value of btc on a set of exchanges for a define type of market.
Bitcoin Spread was originally made by @DayTradingItalia, i have bring his indicator to pine v4, add add some stuff to it:
5 Type of BTC Market : USDT Swap, USD and Futures (current/next contract)
Spread value

Takashi Triangular Arbitrage | 2nd Gen | [Alerts]Spot discrepancies between three currencies: these opportunities are rare and usually benefit to traders using advanced programs. You can now set up alerts and discover those for yourself.
This indicator signals opportunities for executing triangular arbitrage. Triangular arbitrage is the result of a discrepancy between three different currencies that occurs when the currency's exchange rates do not exactly match up. These opportunities are more frequent at cryptocurrency markets. The trader would exchange an amount at one rate (Currency_B/Currency_A), convert it again (Currency_C/Currency_B) and then convert it finally back to the original (Currency_C/Currency_A), and assuming low transaction costs, net a profit.
Example:
As per standard inputs, the trader would use US dollars to buy BTC (BITFINEX:BTCUSD), use BTC to buy NEO (BITFINEX:NEOBTC), use NEO to buy US dollars back (BITFINEX:NEOUSD). Whenever the quantity of US dollars bought back is higher than 1% from the initial amount, the indicator will send an alert signaling an arbitrage possibility.
Disclaimer: triangular arbitrage requires advanced automation tools and is only possible if there is enough liquidity to quickly execute all 3 trades at prices used on the indicator.
Inputs
Symbol 1
Symbol input. First step currency to initiate triangular arbitrage. (Currency_B/Currency_A)
Symbol 2
Symbol input. Second step currency to continue triangular arbitrage. (Currency_C/Currency_B)
Symbol 3
Symbol input. Final step currency to finalize triangular arbitrage. (Currency_C/Currency_A)
Discrepancy %
Float input. Amount in percent of profit return after triangular arbitrage is finished. Transaction fees not included.
To get access to this and other scripts check links below.

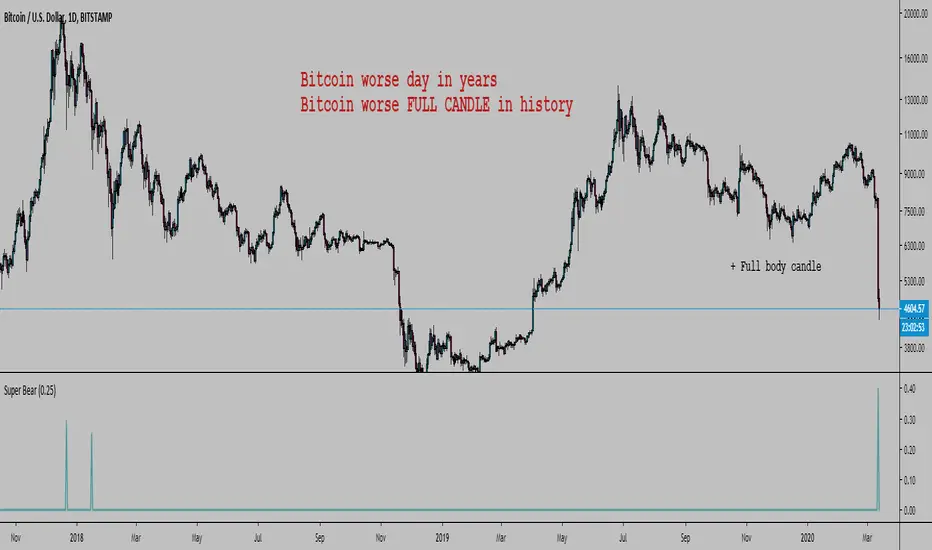
Bitcoin Worse DaysHello, here is a simple script to scan for BTC worse days.
In input you tell the script what are the minimum percent drops to look for.
By default it is 0.3, here I set it at 0.25 or it would not show anything except the 12 March (which is 40.07%).
The indicator has a precision of 1% I think.
It does not look at how low the body closed, it will show all days that closed below where they opened looking at how far below the high of the day the low was.
It can also work on any timeframe.
Here were the previous worse days from the late 2017 crash start of the bear market:
You could modify the script and look for the worse bodies with open - close instead of high - low
You could also add a filter to only look at days where the body is > 90% the whole candle (in this case it's got to be about 99%)
We can look back at BTC past a bit
Every bear market started with a large drop so we can expect...
As you can see we can look at the weekly chart too:
I won't lie, I am pretty happy. Russia, China bat eating community, and Greta were a big help. Thanks guys.
PRIME - XBTUSDPRIME - XBTUSD is an indicator made specifically for XBTUSD on the 1 hour timeframe .
The indicator will help you know:
Potential areas to buy and sell (the flashes).
The trend of the market (the wavy cloud).
Important support/resistance areas (the wavy cloud).
And the daily, weekly and monthly closes (as D, W and M).
The indicator comes with the following alerts:
BUY BTC (1H)
SELL BTC (1H)
The alerts must be set on the 1 hour timeframe.
The goal of the indicator is to make trading simple and sustainable regardless of your lifestyle.
PS. The buy and sell flashes only show on the 1 hour; and the cloud and closes up to the 12 hour (to keep the chart clean).
PPS. For access and questions, message me here on TradingView. If you need it for another asset, I can adjust the settings for you.

PRIME - BTCUSDPRIME - BTCUSD is an indicator made specifically for BTCUSD on the 1 hour timeframe .
The indicator will help you know:
Potential areas to buy and sell (the flashes).
The trend of the market (the wavy cloud).
Important support/resistance areas (the wavy cloud).
And the daily, weekly and monthly closes (as D, W and M).
The indicator comes with the following alerts:
BUY BTC (1H)
SELL BTC (1H)
The alerts must be set on the 1 hour timeframe.
The goal of the indicator is to make trading simple and sustainable regardless of your lifestyle.
PS. The buy and sell flashes only show on the 1 hour; and the cloud and closes up to the 12 hour (to keep the chart clean).
PPS. For access and questions, message me here on TradingView. If you need it for another asset, I can adjust the settings for you.

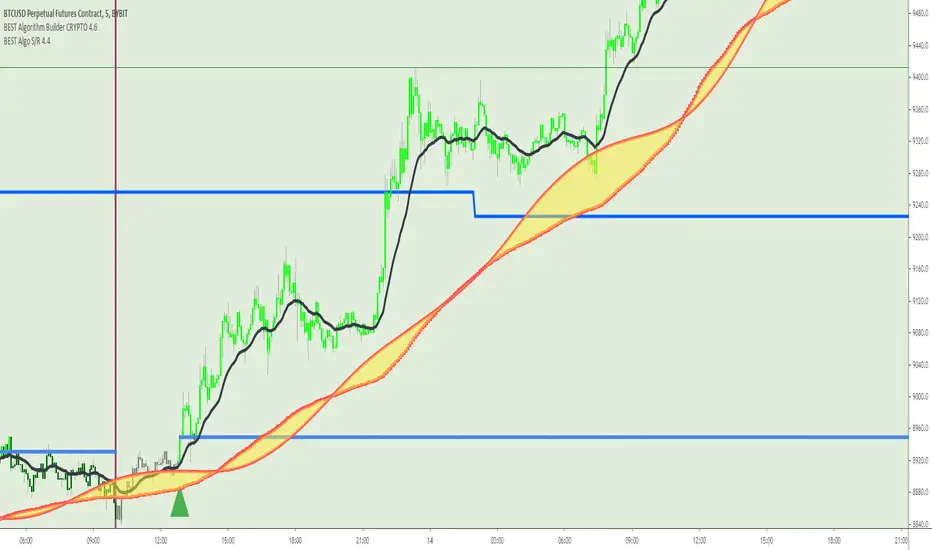
BEST Algorithm Builder CRYPTOHello traders 👋
I. 💎 SCRIPTS ACCESS AND TRIALS 💎
1. Every trial request access has to be done through my website.
2. My website URL is in this script signature at the very bottom (you'll have to scroll down a bit and going past the long description) and in my profile status available here: Daveatt
3. Many video tutorials explaining clearly how all our indicators work are available on your website > guides section and on our Discord forum.
4. You can also contact me directly for more information regarding the trading method included in the indicator or how to access it
II. Forewords
Algorithm trading has THE ambitious goal to reduce the number of decisions we have to make when trading.
It's so much easier to get a signal whenever all indicators are converging rather than monitoring each one individually.
Even better when that convergence has been found by experienced quant traders - so that our subscribers only worry about managing their trades according to our trading method.
We don't only provide scripts. They're based on our trading method we've built over years across many asset classes (including cryptocurrencies)
Feel free to check us out for more information (links in my profile or signature below)
This indicator is for the Intraday CRYPTO traders looking for fixed entries based on a trading method designed by 2 experienced traders.
It's a variation of our Algorithm Builder with a custom method for intraday trading - can be coupled with the UNIVERSAL Algo Builder also for swing positions.
We designed this framework for CRYPTO/USD and CRYPTO/CRYPTO pairing (ex: LTC/BTC, XRP/ETH, ...)
Made for crypto with enough trading volume (big and mid-caps)
ETH/BTC
XRP/ETH
EOS/USD
It includes :
- our proprietary method with fixed entries
- a hard exit system (built-in stop-loss)
- 🔔 Compatible with dynamic alerts 🔔
Dynamic alerts are bringing automated trading to a whole new level. The third-party solutions capturing TradingView alerts are able to use them.
- (optional) we let the users decide to use or not our built-in Trade Manager.
Regardless of the Trade Manager is used or not, one must mandatory exit, once a vertical hard exit bar appears.
- the Algorithmic Supports and Resistances used as safeguards and take profit zones.
Final words
We made it as simple as we could (to be honest it's a very simple system for the end-user) - even with several hundreds of calculations in the indicator.
Please hit me up for any questions/feedback/comments
Become the BEST trader that you deserve to be
Dave
BEST Mayer MultipleHello traders
I'm not a HODLer by any means. I know when to sell (or I think I know....) when an asset starts going against me too much.
Even if it's a "long-term" investment.
My mentor used to telling me this: "If a short-term trade becomes a long-term investment, then you're in for a hell of a ride".
I have no clue if Bitcoin/BTC will go back up or not - I don't even care because I'm an intraday trader.
What if BTC was actually a way to accumulate more fiat? Satoshi fooled us
I coded this Mayer Multiple according to the specifications below. By the way, I'm a big fan of Willy Woo. I've been monitoring all his work since I learned about crypto (10 minutes ago.... it's a joke come on)
charts.woobull.com
Scaling
To respect the Mayer's multiple model, I recommend to select the Logarithmic scaling as shown below
imgur.com
What Mayer's model says
Using the reference below, the model says we're in the oversold zone. But, we can be in that zone for months/years...
When a model says an asset could bounce in a 1000-7000 USD range... well... I don't know how I would be able to perform optimally with that insight. This is very subjective and not a recommendation.
Mayer's Multiple model reference
All the BEST
Dave

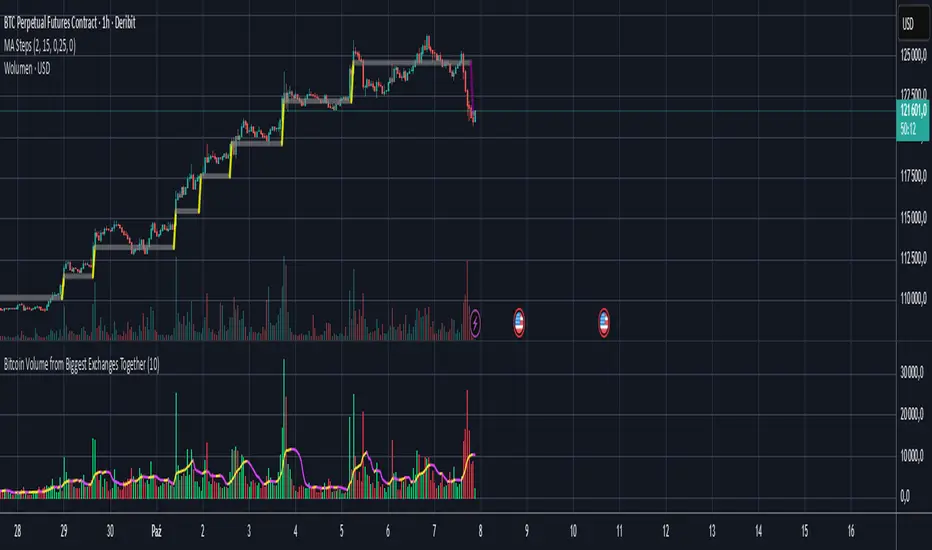
Bitcoin Volume from Biggest Exchanges TogetherEnglish description:
With this script you can see BTC to Fiat/Stable/Contracts together on one volume chart:
- Fiat exchanges: Bitfinex, Coinbase, Bitstamp, Kraken, Gemini, Bittrex
- Stable coins exchanges (USDT for now): Binance, Poloniex, Bitterx
- Contract exchange: Bitmex
Polish description:
Dzięki temu skryptowi możesz wyświetlić na jedym wykresie wolumen BTC do Fiato/Stable coinów/Kontraktów:
- Giełdy z parami do walut fiducjarnych/Fiat: Bitfinex, Coinbase, Bitsamp, Kraken, Gemini, Bittrex
- Giełdy z parą do Stable-coinów(USDT): Binance, Poloniex, Bittrex
- Giełda z kontraktami terminowymi: Bitmex
Cracking Cryptocurrency - ParalloxParallox
Many traders are familiar with or utilize the Relative Strength Index ( RSI ) and/or the Commodity Channel Index ( CCI ). For good reason, these classic and simple to understand indicators have made their way into many traders indicator bays with mixed results. As we often do with our trading style and indicators here at Cracking Cryptocurrency is take things that traders have used one way and attempt to view it in a different light to improve our trading efficiency and performance. That is what we have done with Parallox.
Parallox harnesses the calculations of both the Relative Strength Index and Commodity Channel Index , but through a calculation for a new breed of trader and a new market. RSI and CCI were designed to work in the stock markets of old, and their effectiveness nowadays is more-so due to the "self fulfilling prophecy" concept of so many traders using them rather then their technical applicability to any particular market or market circumstance. Moreover, because so many retail traders now utilize the RSI and CCI , trading it the traditional way, for reversals, has created a golden zone of opportunity for larger traders, institutions, and whales to come in and grab the liquidity of counter-trend retail traders basing their signals off of overbought and oversold conditions in the market utilizing RSI and CCI .
What Parallox does is quite different. Instead of relying on the readings of RSI and CCI , it looks at the value of RSI relative to the value of CCI . By looking at the convergence or divergence of these two indicators, a much more accurate reading of the directional trend can be established. No more using these oscillators to pick false tops and bottoms, instead we can utilize their relative conditions to determine market trend. Not only that, but we can identify objective signals when we cross the barrier between convergence and divergence, therefore giving us clear buy and sell signals for any trading asset.
However, we haven't left reversal traders completely by the way side. What is often an "entry" point for reversal traders, when one has determined that the particular direction of the market is at it's extreme, is where Parallox crosses back the other way, identifying an "overbought" and "oversold" region of sorts, from which we can utilize as an exit indicator when in deeply profitable trending trades.
How to Use
Using Parallox is quite simple. It can be utilized as an Initiator or Confirmer, or also as a longer-term directional marker on any time frame. In it's most simple form, the Parallox Line will cross zero from below and the line will turn green. This is an indication that the market has moved from a bearish zone of control to a bullish zone of control, and can be viewed as a potential buy signal. Conversely, when the line crosses zero from above, the line will turn red, indicating the opposite and can be viewed as a potential short sell signal.
For exit indications in strongly trending markets, when the line goes below the lower dashed line when bearish , and above the upper dashed line when bullish , and comes either back below or back above, those can be seen as trend exhaustion signals and often represent great moments to take profit or to go flat in the market until another trend establishes itself.
Settings
Let's take a look at the settings of Parallox.
First, we can input the look back length we want for our RSI and CCI indicators. You will notice that the defaults are unnatural, that is because they are tuned specifically for the BTC USD market. When trading a different asset, you will want to experiment with the optimum look back length for the best signals.
We then take a moving average of our indicators to have plotted values to work with. As above, the look back lengths for the two moving averages are optimized for BTC USD. The same caveats for optimization apply.
Then we can select the smoothing, or type of moving average we wish to utilize. Parallox performs well with different types of moving average smoothing, and I recommend that you experiment with your style of trade to find the signals that best suit your trading system.
We can also select the source of our indicator values. By default, this is hl2 , which I find to be the best for most indicators, in a close tie with hlc3.
Strategy
Please let me know of your success stories, as well as any features you think would be helpful to add. If you notice any errors within it, please notify me so I can fix them. Trade Safely.

Crypto Multi Exchange Volume (CMEV)Crypto Multi Exchange Volume (CMEV) aggregates and plots trading volumes for supported cryptoasset pairs over multiple different cryptoasset exchanges. For developers looking for more information and for those who want to compile their own version of CMEV, please check out my GitHub (jakobpredin/crypto-multi-exchange-volume).
Configuration
CMEV comes with two configurable settings - whether base volume or quote volume is plotted and the length of the volume's EMA. By default, the base volume is used for plotting and the length of the EMA is set to 12 periods.
Use cases
The indicator was primarily developed in order to be able to chart using the trading pair with the longest available trading history. Due to the fast-changing preferences of where cryptoassets are traded, volumes tend to be very inconsistent and can give a distorted picture of a pairs history. For illustration, check out the SC-BTC pair from Poloniex using their native volume and compare it to the CMEV volume.
The other use case is to be able to spot divergences in volume. A great example here is bitcoin's 2019 rally where volumes from derivatives exchanges are at all time highs but volumes from retail/spot exchanges are not.
Supported exchanges
CMEV currently supports asset pairs from the following exchanges:
Binance
Bitfinex
Bitstamp
Bittrex
Coinbase
Gemini
Kraken
Poloniex
Limitations
Because of the fact that CMEV is pulling data from from multiple different exchanges and is computationally intensive it can take a couple of seconds to load while charting certain cryptoasset pairs.
Additionally, due to Tradingview's various limitations only a certain number of pairs can be supported at a time. By default, only pairs with a BTC or USD quote are supported and many non-unique pairs with consistently low trading volumes have been removed. For a full explanation, please refer to the docs in my GitHub (jakobpredin/crypto-multi-exchange-volume).
Future of the project
I plan on supporting pairs from more exchanges in the future as I see fit and as they become available for charting on Tradingview. Further, I may develop a strategy script using CMEV as its core indicator.
I welcome everybody from the community to help me extend the functionality of CMEV in order to make investing in cryptoassets more transparent for everybody.


Yope BTC virus channelThis is a new version of the BTC tops channel, combined with a fitted curve of the function described in Cane Island Crypto's paper "Bitcoin Spreads Like a Virus" by Timothy Peterson (pink curve).
The big question is: Where will BTC price go from here? will it follow either of both curves? Which one?
The blue channel is nothing more than a curve function that seems to "fit well" the historical prive of bitcoin, while the pink curve actually has some pretty solid theory behind it ;)
NOTE: This script only works with the BLX ticker and on the 1W, 3D and 1D time-frames!
Feedback and comments welcome.

Coinmarketcap - Live CryptoMarketCap TOP 20Hello everyone,
I hope you are fine.
Today an other important indicator : the TOP 20 crypto market cap !
It's better if you use it on BTC/USD to have more historical data.
Next cryptocurrencies have been used for this indicator :
BTC
ETH
XRP
EOS
BCH
LTC
USDT
TRX
XLM
BSV
ADA
BNB
XMR
IOTA
DASH
NEO
ETC
XEM
USDC
ZEC
Thank you and have a good day :)

Trade LightswitchThis script is a follow-up to the following script:
An analysis shows that when BTC relative monthly volume change of retail is greater than non-retail, non-ideal conditions exist to trade (i.e. do not trade). When the default background color is gray, stay out.

Trend is your friendThis indicator evaluates the trend based on crosses of two McGinley moving averages. It paints candles accordingly (it does not repaint), so you can see what the indicator is saying more clearly and stay in your trade until you see a period of consolidation or a reversal. You can control how far away those moving averages need to be for you to consider it a trend. If this distance is not met candles color is not changed and it shows you that the market is in a period of consolidation. I also added visualization of RSI, so you can have an easier time finding appropriate profit targets. For stop loss I would recommend placing it a couple points above or below the previous high / low that is located above / below you final target for entry. You can also use a certain percentage that works for you. I tried adding a stop loss based on ATR, but I did not like the results. Using market structure is a better choice in my opinion.
Here is a basic trading strategy for the default settings:
Wait for the indicator to start printing a series of green or red candles. After that you can enter a long or a short around moving averages. Another valid place to entry is the specific RSI zone. If we are in an uptrend buying when RSI is oversold can be beneficial as you expect market to recover. I do not recommend changing RSI from 14. Vice versa for the downtrend. It gives you an edge as you know at what price RSI will be oversold and allows you to place trades in advance. Pretty neat! You need to realize that no indicator or strategy can give you an exact entry. There will always be some margin of error. What I wanted to say is that if there is a strong trend up and you buy around your key moving averages and when RSI is oversold you entered in good places and there is a pretty good chance you will make money.
Time frame settings:
If you want to use tighter stop losses I would recommend sticking to 15m. Do not go lower. It is not worth the stress. 1h and 4h seems to be very good as well, but expect your stop losses to be wider. What I personally tend to do is display 15m, 30m and 1h and compare it. Think of it as a short, mid and long term. That way you can see things little bit better.
Examples:
1H chart BTC
4h chart EUR / USD
1D chart NASDAQ
15m chart BTC (Daytrading)
That last chart shows that even if you were longing while the trend was about to change you still had a good chance to close it with a little profit and switch to short easily. The default settings is what has worked the best for me. Feel free to change them as you see fit and do not forget to let me know if you find something that works better :)
Notes:
Either disable wick display or change it to a neutral color like gray for both green and red candles. Unfortunately pine script does not allow wick painting, so if you have red / green wicks it will look terrible. If RSI visualization makes your candles look too small you can go to settings and disable the display of individual RSI levels. You will still be able to see the zones, but the scale won't be affected.

Crypto Correlations HeatmapHello friends,
This tool is designed for crypto traders who want a fast, visual way to understand how different coins move relative to each other. It builds a correlation heatmap between your current chart symbol and a customizable list of crypto pairs, helping you immediately see which assets tend to move together, move opposite, or behave independently.
🛠️ How It Works
You provide a comma-separated watchlist of cryptocurrency tickers (for example, a list of USDT or USD-margined pairs). The script then:
Filters this list using your chosen Display Mode - All pairs, or only BTC, ETH, USDT, or USDC-related pairs.
Splits long watchlists into pages of up to 40 tickers , so you can smoothly navigate large universes of coins using the page selector.
For each symbol on the active page, it calculates the Pearson correlation over a user-defined lookback period, based on your selected Correlation Source (close, alternative price averages, or other supported inputs via the custom source module).
The results are rendered as a color-coded heatmap: color and intensity reflect both the strength and direction of correlation with your chart symbol.
You can switch between multiple professional color palettes to fine-tune how positive, negative, and neutral correlations are visually separated on the chart.
🔥 Key Features
Custom watchlist input via a simple text area (paste long lists directly from your exchange or screener)
Pagination support - view up to 40 tickers per page for stable performance
Flexible Display Modes : All pairs, BTC pairs, ETH pairs, USDT pairs, USDC pairs
Adjustable correlation lookback length
Advanced correlation source selector via the custom source module
Multiple color palettes : Blue/Red, Blue/White/Red, Green/Pink, Green/Red, Green/Yellow/Red, Purple/Orange, Spectral, Viridis
Clear visual mapping of correlation strength and sign using color intensity and hue
👋 Good luck and happy trading!

RSI Multi Time Frame [Jigga]This indicator simply displays RSI on 4 time frames. You can configure individual RSI lengths as well. The first two RSIs are more visible to prevent clustering. It is possible to define oversold / overbought areas and the script displays the middle line as well.
A couple of use cases:
Comparison of 7, 12, 18 and 24 RSIs on a given time frame
Comparison of 14 RSI on 30m, 1h, 2h and 3h time frame (Default settings)
Please, always use a proper stop loss and risk management.
Here you can see it in action:
BTC - BitMex
BTC - BitMex
