Fair Value Gap Suite Adrian V1.0.0Brief description
The “FVG Suite” identifies fair value gaps across multiple time units, evaluates them with a displacement score, optionally filters them according to market structure events (BOS/CHOCH), and provides context-based alerts for first touch, partial and full fills, and invalidation. The aim is to show only high-quality imbalances and trade them based on rules.
What makes the script unique (originality/added value)
Displacement score: Strength of the impulse movement as a combination of (body/ATR, range/ATR, volume Z-score).
MTF aggregator: FVGs from higher timeframes are collected, ranked, and displayed as zones on the active chart (including overlap clustering).
Structure context: Optionally, only FVGs after confirmed BOS/CHOCH in the trend direction, including premium/discount evaluation relative to the HTF range.
Adaptive invalidation: FVG expires after candles, opposing BOS or defined time (e.g., end of session).
Session/instrument filter: Time window (e.g., NY/LDN), minimum tick size, ATR-based minimum gap.
Smart fill logic: Distinguishes between first touch, partial fill (≥ %), full fill (100%); alarms per event.
Statistics overlay (optional): Hit rate/expectancy per TF & session for fine-tuning the filters.
How it works (conceptually)
FVG definition (3-candle pattern): Bullish if High < Low (bearish analog). Size = gap span in points.
Quality score:Score = w1*(|Body|/ATR) + w2*(Range/ATR) + w3*(Volume-Z), normalized to 0–100.
MTF scan: List of higher TFs: (customizable). Findings are merged, ranked, and displayed as zones with priority (color/opacity).
Context filter: Only FVGs that emerge after BOS/CHOCH in the direction of the current trend; optional exclusion in premium/discount areas.
Invalidation & alerts: A zone is considered active until the invalidation rule takes effect. Alerts are triggered upon: initial contact, partial/full filling, invalidation.
Important inputs
Min. FVG size: × ATRor ticks/points
Min. displacement score: (0–100)
MTF list:
BOS/CHOCH filter: On/Off (Lookback candles)
Session filter: NY/LDN/Asia (local time, weekend toggle)
Invalidation: maxBars = , Opposite BOS = On/Off, Session End = On/Off
Fill definitions: Partial fill ≥ % of the gap; Full fill = 100%
Overlay options: Zone color/transparency, HTF label, statistics overlay On/Off
Alerts (names & triggers)
FVG Suite – First Touch: Price touches an active FVG zone for the first time.
FVG Suite – Partial Fill: Partial fill ≥ configured threshold.
FVG Suite – Full Fill: Gap completely filled.
FVG Suite – Invalidated: Zone invalidated by rules. (Alert message contains: symbol, TF of the zone, direction, score, size, trigger rule.)
Use (best practices)
Trade in the trend direction with BOS/CHOCH filter; target counter-imbalances/liquidity pools.
Use session filters to avoid news spikes/illiquid periods.
Calibrate parameters for each market/TF (ATR/volume profiles differ).
Limitations
Structure labels can be reevaluated for new highs/lows (repainting of labels, not of FVG finds).
Spreads/news can generate “pseudo fills.”
Backtests/statistics are sample-dependent; no guarantee of results.
Changelog
v1.0 – First release (score model, MTF aggregator, BOS/CHOCH filter, fill alerts).
Credits
FVG concept: public ICT/SMC literature (general idea). Implementation/scoring, MTF ranking, smart fill logic: own development.
Note/disclaimer
No financial advice. For educational purposes only. Trading involves high risk; use stop losses and a fixed risk budget.
ค้นหาในสคริปต์สำหรับ "BOS"
FibPivot FluidTrades ProEducational Purpose only.
Trading Plan
⏰ Timeframe
Best suited for 15-minute for direction and signal or 5/1-minute for Ep chart intraday.
For swing trades, consider 4H or 1H.
✅ Trade Setup Conditions
1. Market Structure Confirmation (MS, BOS, MSS)
Use BOS (Break of Structure) or MSS (Market Structure Shift) labels:
✅ Bullish Bias: Look for MSS/BOS up (price breaks previous swing high).
✅ Bearish Bias: Look for MSS/BOS down (price breaks previous swing low).
2. Supply & Demand Zones
Look for:
Demand box = long bias.
Supply box = short bias.
Avoid entering inside zones—wait for a retest/rejection or BOS out of zone.
3. Entry Signal
Buy Entry:
Green "Buy" shape appears. 50% of Candle
Price is above ATR trailing stop.
Signal appears near a demand zone, above MA200, and preferably above pivot level.
Sell Entry:
Red "Sell" shape appears. 50% of Candle
Price is below ATR trailing stop.
Signal appears near a supply zone, below MA200, and preferably below pivot level.
🧭 Confluences for Entry
Use 3+ of the following:
ATR trailing signal ✅
BOS/MSS ✅
Demand/Supply zone (fresh) ✅
Price above/below MA200 ✅
Close above/below pivot or Fib levels ✅
Candle breaks 50% of signal candle ✅
🎯 Entry, Stop Loss, Take Profit
Component Setting
Entry Midpoint of signal candle (auto drawn line)
Stop Loss Fixed 7 ticks (adjustable via settings)
Take Profit Fixed 14 ticks (default R:R = 2:1)
Trail Option ATR trailing stop (optional exit)
📉 Exit Strategy
Exit fully at TP line.
Or:
Partial at 1:1 (7 ticks).
Remainder at 2:1 (14 ticks).
Or trail with x ATRTrailingStop.
🚫 Avoid Trades When:
Price is inside supply/demand zones (indecision).
No BOS/MSS or weak structure.
Trading against MA200 slope/direction.
Entering near strong Fib pivot levels acting as support/resistance.
🔔 Alerts Available
Buy Signal (UT Long)
Sell Signal (UT Short)
BOS/MSS alerts (bull/bear)
🛠️ Risk Management
Risk only 1–2% of your capital per trade.
Follow the table display for low risk
Entry and Stop loss
TP
Risk-Reward Ratio (R:R)
Stick to predefined ticks for consistency.
📝 Example Trade Flow (Long):
MSS label (Bull) appears.
A Demand zone is drawn and respected.
Buy Signal appears above ATR trailing stop.
Price is above MA200.
Entry at midpoint of signal candle.
SL = -7 ticks, TP = +14 ticks.
P/S "I just wanted to say a big thank you to masterpiece FluidTrades SMC Lite script, clean, smart, and very useful. It helped me spot better entries and structure my trades properly.
Smart Money Template📈 Smart Money Concepts – BOS / CHoCH / Order Blocks / OTE / FVG
Version: 1.0
Framework: Pine Script v5
Category: Smart Money / Price Action / Institutional Concepts
🧠 Indicator Overview
This indicator is a complete Smart Money Concepts (SMC) toolkit, built to help traders identify institutional activity and market structure shifts using key SMC principles:
• BOS (Break of Structure)
• CHoCH (Change of Character)
• Order Blocks (OB)
• OTE Zones (Optimal Trade Entry)
• FVGs (Fair Value Gaps / Imbalances)
This tool provides visual clarity and high-probability trade zones by automating what professional traders do manually.
⸻
🔍 Core Features
✅ BOS & CHoCH Detection
Automatically detects market structure breaks using HH/LL logic. BOS is highlighted when price breaks significant swing highs/lows.
✅ Order Block Zones
Draws boxes around the last bullish/bearish candle before a displacement (impulse move), showing potential institutional OB zones.
✅ OTE Zone Mapping
Calculates the Optimal Trade Entry zone between 0.705–0.79 of a price leg using Fibonacci logic. A powerful confluence area when combined with OBs.
✅ Fair Value Gap (FVG)
Detects imbalances between candles that often act as magnets for price. Visualizes price inefficiencies for future retests.
✅ Custom Inputs
You can toggle any feature on/off for cleaner analysis: BOS/CHoCH, OBs, OTE, and FVGs.
⸻
⚙️ How It Works
1. Structure Recognition:
• The script checks for Higher Highs / Lower Lows to determine trend context.
• A BOS/CHoCH label appears when structure shifts.
2. Order Blocks:
• A bullish OB is detected when the previous candle is bearish and the current one closes above its high.
• A bearish OB is vice versa.
3. OTE Levels:
• Based on daily range from high to low.
• Highlights 0.705–0.79 as a potential retracement entry zone (optimal sniper entry).
4. FVG Detection:
• If there is a gap between candle 3 and candle 1 (current candle), it is marked as an imbalance zone.
🎯 Best Use Cases
• Entry confirmations using CHoCH + OB + OTE confluence
• Liquidity grabs + FVG retest setups
• Institutional trend reversals (AMD cycles)
• Smart retracement entries using OTE zones
⸻
💡 Tips for Traders
• Works best on 15m, 1H, 4H, or Daily charts
• Combine with liquidity sweep logic, volume profile, or your own strategy for sniper precision
• Backtest using BOS + OB + FVG + OTE for high-RR setups
⸻
🛠️ Upcoming Features (Optional)
• Risk:Reward Ratio Tool
• Stop Hunt Detection (SSL/BSL)
• Volume + Sponsored Candle Filter
• Alerts for BOS / OB reaction
• SFP Pattern recognition
⸻
Disclaimer:
This tool is for educational purposes only and should be used in conjunction with your own risk management and strategy. Not financial advice.
⸻
Demand and Supply MTF with SMC By StockFusion - 3.0Demand and Supply MTF with SMC By StockFusion - 3.0 - Indicator Description
Concepts
What is Supply & Demand?
Supply and Demand are foundational forces driving market dynamics. Demand reflects the presence of buyers willing to purchase a security, while Supply indicates sellers offering it for sale. These forces create zones on the chart where price tends to react—either reversing or continuing—based on the balance between buying and selling pressure. This indicator identifies these zones using price action patterns, focusing on impulsive moves (strong directional momentum) and retracement phases (consolidation or pullbacks).
What is SMC (Smart Money Concepts)?
Smart Money Concepts (SMC) revolve around tracking the behavior of institutional traders, often called "smart money." By analyzing price action, market structure shifts, and liquidity, SMC helps retail traders align with the moves of larger players. Key SMC signals like Change of Character (CHoCH), Break of Structure (BOS), liquidity sweeps, and swing points provide insights into potential trend changes or continuations.
Overview
Demand and Supply MTF with SMC By StockFusion - 3.0 is a sophisticated, price action-based indicator designed to plot real-time Supply and Demand zones across multiple timeframes (MTF) directly on your chart. It goes beyond simple zone plotting by integrating Smart Money Concepts (SMC) and Inside Candle detection, offering traders a powerful tool for spotting high-probability reversal or continuation areas. The indicator highlights zones with customizable boxes, labels them for clarity, and provides additional SMC-driven insights such as CHoCH, BOS, liquidity sweeps, and swing high/low levels. This combination of multi-timeframe analysis, SMC, and consolidation detection creates a unique and highly practical tool for traders seeking an edge in the markets.
How It Works
The indicator operates by analyzing price action across two user-defined timeframes (Higher TF and Lower TF) to detect Supply and Demand zones. It identifies these zones based on specific price patterns:
Rally Base Rally (RBR): A bullish impulsive move, followed by consolidation, then another bullish move—indicating a Demand zone.
Drop Base Drop (DBD): A bearish impulsive move, consolidation, then another bearish move—indicating a Supply zone.
Drop Base Rally (DBR): A bearish move, consolidation, then a bullish reversal—indicating a Demand zone.
Rally Base Drop (RBD): A bullish move, consolidation, then a bearish reversal—indicating a Supply zone.
These patterns are detected using criteria like explosive candle movements (based on range-to-body ratios and ATR multipliers), volume thresholds, and base candle counts (configurable from 1 to 5 candles). Zones are plotted as horizontal bands, with Higher TF zones taking precedence to avoid overlap with Lower TF zones, ensuring clarity on the chart.
Smart Money Integration:
The indicator enhances zone analysis with SMC features:
CHoCH (Change of Character): Detects shifts in market sentiment by comparing price action against recent swing highs/lows over a customizable period.
BOS (Break of Structure): Identifies when price breaks key structural levels, signaling a potential trend shift.
Liquidity Sweeps: Marks areas where price briefly exceeds swing points before reversing, often targeting stop-loss orders.
Swings: Highlights significant swing highs and lows to track momentum and structure.
Inside Candle Detection:
Inside Candles—smaller candles contained within the range of a prior candle—are plotted to indicate consolidation or indecision, often preceding breakouts. Optional lines can be drawn around these candles for better visibility.
Key Features & How to Use
Real-Time Zone Plotting:
Automatically identifies and marks Supply and Demand zones as they form, using the RBR, RBD, DBR, and DBD patterns. Zones are color-coded (e.g., green for Demand, red for Supply) and can extend rightward for visibility.
Multi-Timeframe Analysis:
Operates on all timeframes, with separate settings for Higher TF (e.g., weekly) and Lower TF (e.g., daily) zones. This allows traders to see both macro and micro levels of market structure.
Automatic Detection:
No manual input is required—zones are plotted based on price action, volume, and SMA trends. Live candle volume is displayed for context.
Tested Zone Management:
Optionally removes zones after they’re tested (price revisits and reverses) or after a second leg-out move, keeping the chart uncluttered.
Customizable Display:
Choose which patterns to detect (RBR, RBD, etc.).
Adjust base candle counts (1-5), explosive candle parameters (Range-Body Ratio, Multiplier), and quality filters (SMA length, Volume Multiplier).
Customize colors for zones, borders, labels, and candles (boring, bullish explosive, bearish explosive).
Enable/disable labels and pattern names on boxes.
Alerts:
Set notifications for zone formation, CHoCH, BOS, and liquidity sweeps on your chosen timeframe.
Inside Candle Visualization:
Highlights consolidation phases with color-coded candles and optional lines, aiding breakout anticipation.
SMC Insights:
Visualizes CHoCH, BOS, liquidity sweeps, and swings with distinct lines and labels, helping traders follow institutional moves.
How to Use It:
Approaching Zones: When price nears a Supply or Demand zone, watch for reversal patterns (e.g., pin bars, engulfing candles) or SMC signals (e.g., BOS, liquidity sweeps) to confirm entries. Combine with your tested strategy—don’t trade zones blindly.
SMC Signals: Use CHoCH for early trend reversal clues, BOS for trend continuation, and liquidity sweeps to gauge manipulation.
Inside Candles: Monitor for breakouts after consolidation periods marked by Inside Candles.
Why It’s Unique & Valuable
This indicator stands out by blending multi-timeframe Supply and Demand analysis with Smart Money Concepts and Inside Candle detection into a single, cohesive tool. While it uses classic elements like price action and volume, its proprietary logic—combining specific pattern detection (RBR, RBD, DBR, DBD), SMC signals (CHoCH, BOS, etc.), and consolidation tracking—offers a fresh approach. Unlike generic trend-following or scalping tools, it provides actionable insights into market structure and institutional behavior, making it worth considering for traders willing to invest in a premium tool. The flexibility of customization and MTF functionality further enhances its utility across trading styles, from scalping to swing trading.

Market Structure Break Targets [UAlgo]The "Market Structure Break Targets " indicator is designed to identify and visualize key market structure points such as Market Structure Breaks (MSBs) and Break of Structures (BoS). These points are crucial for understanding market trends and potential reversal zones. By plotting these structures on the chart, traders can easily spot significant support and resistance levels, as well as potential entry and exit points.
This indicator uses a combination of swing highs and lows to determine market structures and calculates targets based on user-defined percentages or Average True Range (ATR) multipliers. It provides visual cues in the form of lines, labels, and boxes to help traders quickly interpret market conditions.
🔶 Key Features
Customizable Swing Length: Users can set the swing length to identify the pivot highs and lows, which are crucial for determining market structure.
Target Duration Bars: Defines the maximum duration (in bars) for which the targets will be considered valid.
Target Calculation Methods: The target levels are crucial for setting potential price objectives. The calculation can be based on a percentage move from the identified pivot or using the ATR to factor in market volatility. These targets help in setting realistic profit-taking levels or identifying stop-loss placements.
Bullish and Bearish Market Structure Break (MSB): Detects and highlights bullish and bearish market structure breaks with customizable colors and target percentages.
Bullish MSB
When the price closes above a significant pivot high, a bullish MSB is identified. The indicator will draw a line at this level and calculate a target based on the chosen method (percentage or ATR). The target is visualized with a dotted line, and a label "MSB" is displayed. Additionally, an order block is created at the level of the bullish MSB. This order block is highlighted with a semi-transparent box, representing a potential area where price might find support in the future.
Bearish MSB
Conversely, when the price closes below a significant pivot low, a bearish MSB is marked. Similar to bullish MSBs, targets are calculated and displayed on the chart. An order block is also generated at the level of the bearish MSB, visualized with a semi-transparent box. This box highlights a potential resistance area where price might face selling pressure.
Bullish and Bearish Break of Structure (BoS): Identifies break of structures for both bullish and bearish scenarios, providing additional target levels.
Bullish BoS
If the price continues to rise and breaks another significant level, a bullish BoS is detected. This break is also marked with lines and labels, providing additional target levels for traders. An order block is created at the BoS level, serving as a potential support zone.
Bearish BoS
If the price falls further after a bearish MSB, a bearish BoS is identified and visualized similarly. The indicator creates an order block at the BoS level, which acts as a potential resistance zone.
🔶 Disclaimer:
Use with Caution: This indicator is provided for educational and informational purposes only and should not be considered as financial advice. Users should exercise caution and perform their own analysis before making trading decisions based on the indicator's signals.
Not Financial Advice: The information provided by this indicator does not constitute financial advice, and the creator (UAlgo) shall not be held responsible for any trading losses incurred as a result of using this indicator.
Backtesting Recommended: Traders are encouraged to backtest the indicator thoroughly on historical data before using it in live trading to assess its performance and suitability for their trading strategies.
Risk Management: Trading involves inherent risks, and users should implement proper risk management strategies, including but not limited to stop-loss orders and position sizing, to mitigate potential losses.
No Guarantees: The accuracy and reliability of the indicator's signals cannot be guaranteed, as they are based on historical price data and past performance may not be indicative of future results.

Stock Bee's 4%Stock Bee's 4%
First Things First
- This indicator is a replica of Pradeep Bonde aka Stock Bee’s 4% indicator which he uses in the TC2000 platform for trading momentum burst and EP 9 million setup.
- Disclaimer: This indicator will not give any buy or sell signal. This is just a supporting tool to improve efficiency in my trading.
- Apply Indicators and then open indicator settings and read the following simultaneously to understand better.
- Default color settings are best suited for light themes. Which is also my personal preference.
- Users can change most of the default options in settings according to their personal preference in settings.
- When we open settings we can see 3 tabs that are {Inputs tab} {Style tab} {Visibility tab} each tab have its own options, Understand and use it accordingly.
- Background Color grading that is “Green” background means parameter favorable, “Red” not favorable for my trading.
- Indicator will be only visible in the Daily time frame as its primary TF is daily. In the lower time frame nothing is plotted.
- An indicator is plotted on a different plane and does not overlay in the existing plane.
Contents
+4% BO
-4% BO
Volume
+4% BO
- If the %change is more than 4% and today's volume > yesterday's volume and volume > 100000 then the green line is plotted from 0 to 1.
- This helps in trading momentum burst setup and to spot 4% BO easily.
{Style Tab}
- “Check Mark” Users can Show/Hide the line.
- “+4% BO” Default “Green color”. Users have the option to change.
- “Line Type” Default settings, Users have the option to change.
-4% BO
If the %change is less than -4% and today's volume > yesterday's volume and volume > 100000 then the green line is plotted from 0 to 1.
This helps in trading momentum burst setup and to spot -4% BO easily.
{Style Tab}
- “Check Mark” Users can Show/Hide the line.
- “-4% BO” Default “Red color”. Users have the option to change.
- “Line Type” Default settings, Users have the option to change.
Volume
- If Today’s Volume is greater than Default settings that is 9 Million then Blue color line is plotted similar to +/-4% B) however if u want to plot like Pradeep Bonde aka Stock Bee style then user have to change settings from “line” type to “histogram” type in style tab of settings.
- This is used for spotting EP 9 Million setup.
{Input Tab}
- “Volume” Default is (9). Users have the option to change as per their preference. And the number should be in millions.
{Style Tab}
- “Check Mark” Users can Show/Hide the line.
- “Volume” Default ”Blue color”. Users have the option to change.
- “Line Type” Default settings, Users have the option to change.
To use it similar to Stock Bee, change “Line” to “Histogram”.
Highly Recommended Setting to change immediately
{Style Tab} Outputs Section
“Check Mark” Labels on price scale. “Uncheck it”.
“Check Mark” Values in Status Line. “Uncheck it”.
*****
Close-Only Market StructureDYOR NFA
Function of the Close-Only Market Structure Script
The script is a custom indicator designed to display the market's structural trend based only on closing prices, ignoring price wicks (highs and lows) to focus on conviction.
pivotLengthInt Input: This user setting controls the sensitivity of the structure detection. It determines how many bars to look left and right to define a swing point (e.g., a setting of 5 means a bar's close must be the highest/lowest of the 5 preceding and 5 succeeding bars).
Swing Point Identification (SH/SL): It uses the ta.pivothigh() and ta.pivotlow() functions on the close price series to define Swing Highs (SH) and Swing Lows (SL).
Structure Tracking (structureType): It compares the most recent confirmed SH and SL against the immediately preceding ones (prevSH and prevSL) to classify the trend as one of the following four states:
HH (Higher High, Higher Low): Strong Uptrend
LL (Lower High, Lower Low): Strong Downtrend
HL/LH: Complex structure, consolidation, or reversal zones.
Structure Lines: It plots two continuous stepped lines (lastSH and lastSL) that hold the price of the most recent confirmed swing points, visually defining the current structure boundaries.
BOS Detection (Break of Structure): It identifies and plots a marker (BOS) when the current bar's close definitively breaks (closes above) the lastSH or closes below the lastSL, signaling a continuation of the trend or a major structural change.
Visual Confirmation:
Plots small SH/SL labels at the confirmed swing points.
Plots small HH/HL/LH/LL labels at the swing points to show the confirmed structural state.
Applies a light background color (green for bullish/ranging-up, red for bearish/ranging-down) for an at-a-glance view of the bias.
Alerts: It provides conditions for setting up notifications when a Bullish BOS or Bearish BOS occurs.
🚀 How to Use the Script
Open TradingView: Go to the chart where you want to apply the indicator.
Open Pine Editor: Click the Pine Editor tab at the bottom of the screen.
Paste and Save:
Copy the final, corrected Pine Script code.
Delete any existing code in the editor and paste the new code.
Click the Save button (or name the script) and then click Add to Chart.
Adjust Settings:
On the chart, hover over the indicator name ("Close-MS v6") and click the Gear Icon (Settings).
Pivot Lookback (L&R): Change this value to adjust sensitivity:
Smaller number (e.g., 3): More swings detected, structure changes faster, more noise.
Larger number (e.g., 10): Fewer swings detected, structure is more significant, less noise (recommended for higher timeframes).
Interpret the Chart:
The Red Stepped Line shows your current resistance (SH).
The Green Stepped Line shows your current support (SL).
Green Background: General bullish bias (making Higher Highs/Lows).
Red Background: General bearish bias (making Lower Highs/Lows).
BOS Triangle: Signals that the price has closed and validated a break of the previous structural high or low.
Set Alerts (Optional):
Click the Alert button (bell icon) on the TradingView toolbar.
Set the Condition to the indicator ("Close-MS v6").
Select the specific Alert Condition you want to monitor (e.g., "Bullish BOS" or "Bearish BOS").

TrendViz - Smart Money ConceptsTrendViz – Smart Money Concepts
See structure, liquidity, and institutional footprints in real time.
Overview
Trend Viz – Smart Money Concepts is a comprehensive SMC toolkit that fuses market-structure (BOS / CHoCH), volumetric order blocks, fair-value gaps (FVG / Breakers), Swing Failure Patterns (SFP), equal highs / lows, and liquidity zones into one clean, on-chart visualization.
It’s designed for intraday precision (0DTE / indices) and swing confluence, with windowed processing for performance on large histories.
Key Capabilities
Market Structure Engine – Detects BOS / CHoCH with adjustable swing length, “Extreme vs Adjusted Points” logic, optional trend-based candle coloring, sweep marks, and labeled lines / bubbles.
Volumetric Order Blocks – Builds bullish / bearish OBs (including breaker blocks), mitigation methods (Close / Wick / Avg), overlap control, mid-line, and activity split (buy vs sell) with per-OB volume metrics.
Fair Value Gaps (FVG & Breakers) – Auto-detects FVGs, mitigations, optional extension, mid-lines, overlap filtering, and raid marking.
Swing Failure Pattern (SFP) – Volume-aware SFPs, directional filters (Trend-Following / Counter-Trade), deviation projections (levels + optional fill).
Equal Highs / Lows & Liquidity Concepts – Marks EQH / EQL across multiple horizons, buyside / sellside zones (area or line), liquidity prints on candles, and sweep zones after BOS / CHoCH.
Performance-First Design – Window size limits structure computations; configurable max objects; overlap suppression reduces clutter.
Inputs & Settings
Market Structure – Window size, Swing limit, Candle coloring, Text size, Algorithmic mode, Swing length, Strong/Weak HL, Sweeps, Bubbles, Mapping.
Volumetric Order Blocks – Show Last N blocks, Breakers, Construction mode, ATR length, Mitigation method, Metrics + Mid-line, Hide Overlap.
Fair Value Gap / Breakers – Enable mode, Show Last N, Threshold, Mid-line + Extension, Hide Overlap, Raid Display.
Swing Failure Pattern (SFP) – Count, Deviation Area, Colors, Filtering mode (Trend / Counter), Volume threshold, Label size.
Liquidity Concepts – Equal H&L scope, Liquidity prints, Buyside/Sellside zones (area or line), Sweep Area threshold.
How to Use It
Quick Start
Add the indicator to your chart → leave defaults.
For 0DTE / intraday use 1 – 5 min timeframes; for swing use 1H – 4H.
Turn on Color Candles to see bullish / bearish bias.
Enable Order Blocks (Show Last 5 – 10) and FVG (3 – 5) with Mitigation = Wick.
Activate SFP with Volume Threshold ≈ 0.5 – 1.0 and Trend-Following filter.
Core Workflows
Trend-Continuation Entry – Wait for CHoCH → BOS alignment → FVG mitigation or OB mid-line retest.
Reversal Entry – Opposing CHoCH + sweep (x) + fresh OB confirmation.
Liquidity Sweep Fade – Raid EQH/EQL + SFP (Counter-Trade) → target prior FVG or opposite OB.
0DTE / Index Checklist
Timeframe 1–5 min · Adjusted Points · mslen = 3–5.
OB Show Last = 5–10 · Mitigation = Wick · Hide Overlap = Recent.
FVG Show = 3–5 · Threshold = 0.1–0.3.
SFP Trend-Following for momentum, Counter-Trade for range.
Trade only after CHoCH → BOS alignment near OB / FVG.
Tips & Behavior
Confirmation / Repainting – Structure anchors confirm after right bars; no repaint once locked.
Performance – Reduce Window size, counts, and overlaps for speed.
Clutter Control – Hide Overlap, limit count, prefer mid-lines over fills.
Mitigation Choice – Wick (strict), Close (lenient), Avg (balanced).
Alerts – Not included by default (visual tool only).
Example Setups
Momentum Pullback – After BOS up, FVG fill + OB reclaim = entry.
Liquidity Sweep Fade – EQH raid + bear SFP = fade to prior FVG.
Breaker Flip – Mitigated OB turns breaker; trade retest.
Disclaimer
This indicator is for educational and analytical purposes only.
Not financial advice. Backtest and apply proper risk management before using live.
Tags
#SmartMoneyConcepts #OrderBlocks #BOS #CHoCH #FVG #Breakers #SFP #Liquidity #EQH #EQL #0DTE #SPX #MarketStructure #TrendViz #TradingView
Structure Pro+ 2.4 Structure Pro+ 2.4
Summary
Structure Pro+ 2.4 is a comprehensive, all-in-one indicator designed for traders who utilize Smart Money Concepts (SMC). It automates the detection of key market structure events, identifies high-probability trade signals, and incorporates time-based filters to focus on the most volatile trading sessions, helping you make informed decisions with precision and clarity.
This suite goes beyond simple lines on a chart by integrating Market Structure, Fair Value Gaps (FVGs), and institutional trading sessions into a single, powerful tool.
Core Features
📈 Automatic Market Structure
Break of Structure (BOS) & Change of Character (CHoCH): The indicator automatically identifies and labels significant breaks in market structure, allowing you to instantly recognize trend continuations (BOS) or potential reversals (CHoCH).
Customizable Pivot Detection: Fine-tune the sensitivity of the structure detection by adjusting the Left Bars and Right Bars settings to match your trading style and timeframe, from scalping to swing trading.
🎯 High-Probability Breakout Signals
Receive clear BUY and SELL signals based on a powerful confluence of events. A signal only appears when:
A BOS or CHoCH is confirmed.
The breakout move is validated by the creation of a recent Fair Value Gap (FVG), indicating strong momentum.
The signal occurs within a valid, high-volatility time session.
The breakout is confirmed on a closed candle to prevent fakeouts.
🔍 Key Liquidity & Imbalance Zones
Fair Value Gaps (FVGs): Automatically detects and displays FVG (Imbalance) zones on your chart, highlighting key areas of interest where the price may return.
Order Blocks (OBs): Optionally display the last order block before a structural break. The length of the OB box can be customized to keep your chart clean.
🕒 Time-Based Session Filters (Killzones)
Timing is everything. Structure Pro+ 2.4 provides fully customizable time filters to ensure you are only trading in optimal market conditions.
ICT Macro Sessions: Enable and customize standard ICT Macro "Killzone" sessions, which are displayed visually on your chart.
NASDAQ Open Session: A dedicated, customizable session filter for the high-volatility NASDAQ open.
Timezone Synchronization: Set your preferred timezone (America/New_York by default) to align all sessions perfectly, no matter where you are in the world.
⚙️ Full Customization & Alerts
Visuals: Take complete control over the look and feel of the indicator, including colors, line styles, and label sizes.
Alert System: A comprehensive alert system allows you to get notified for every key event:
Signal (BUY/SELL)
BOS or CHoCH
BOS/CHoCH with FVG Confluence
Start of a Macro Session
How to Use
Identify the Trend: Use the automatically plotted BOS and CHoCH labels to determine the current market bias on your chosen timeframe. An uptrend is defined by a series of bullish BOS, while a downtrend is defined by bearish BOS. A CHoCH signals a potential shift in this bias.
Wait for a Signal in a Valid Session: Be patient and wait for a BUY or SELL signal to appear on your chart. Ensure the signal occurs within one of the active, visually-drawn time sessions (Macros or NASDAQ Open) for the highest probability.
Confirm and Manage Risk: Use the signal as a primary point of confluence in your trading plan. For best results, combine it with your own analysis. Always practice proper risk management by setting a stop loss, typically below the low of the swing that caused a BUY signal or above the high of the swing that caused a SELL signal.
Disclaimer: This indicator is a tool designed to assist in trade analysis and should not be considered as financial advice. Trading involves substantial risk, and past performance is not indicative of future results. Always conduct your own research and risk assessment before entering any trade.

One Trade Setup for LifeIndicators are refered from @TFlab and @ChartPrime and @UAlgo
***
## Indicator Overview 🚀
**One Trade Setup for Life** is a sophisticated TradingView Pine Script indicator blending Smart Money Concepts (SMC), advanced Price Action, and Liquidity Analysis. It provides signals for structural market moves, trade setups, and custom alerts. This tool is designed for **precision execution**, giving traders a comprehensive edge in diverse market conditions.
***
## Key Logic Sections & Explanation
### Smart Money Concept Logic 💸
- **Pivot Lines**: Plots SMC levels based on swing high/low pivots, customizable for wick/body detection and colored to represent bullish or bearish market structure.
- **Market Structure Detection**: Tracks changes such as BOS (Break of Structure) and CHoCH (Change of Character), using real-time breakout logic to highlight structural shifts, confirm reversal setups, and trigger accompanying alerts.
- **Engulfing & Confirmation**: Identifies engulfing candles, confirms market structure changes, and plots colored lines—with shape plots at exact highs/lows for visual clarity.
***
### Pure Price Action 📈
- **Swing Detection**: Adjustable bars for detecting swing points, making the indicator sensitive to trend reversals and continuations based on candle closes or wicks.
- **BOS/CHoCH Lines**: Plots dashed, solid, or dotted lines (user-selected) to visualize structural changes in price, adding color-coded markers for transparency.
- **Sentiment Table**: Displays an emoji-based sentiment table at the chart bottom, updating live to quickly gauge overall price action and market mood (bull, bear, neutral emoji).
***
### Supertrend Logic 🟩🟥
- **ATR-Based Trend Filter**: Implements Supertrend bands using customizable ATR length, multiplier, and increment. Options include normalization for flexibility in ranging versus trending markets.
- **Multi-Factor Signals**: Detects buy/sell crossovers and plots median/stdev areas for additional confirmation. Users can visually track Supertrend support/resistance as trade triggers.
***
### RSI & Activity Analysis 📊
- **RSI Calculation**: Provides customizable RSI length, overbought/oversold thresholds. Candle coloring flips as RSI hits extreme levels, giving immediate visual signals for exhaustion or reversals.
- **Trading Volume Proxy**: Advanced logic computes percentile rankings and plots quintile bands, triggering signal arrows when activity surges above or below key thresholds.
***
### Liquidity Sweep & Fair Value Gap Logic 💧
- **Sweep Zones**: Detects price sweeps at key resistance/support lines generated from pivots, marking with labels and enabling sweep alerts.
- **FVG & Mitigation**: Integrates Fair Value Gap (FVG) detection. The indicator can filter FVG zones by aggressiveness, classify supply/demand FVGs, and highlight where price is likely to react for entry or exit.
***
### Support, Resistance, and Swing Levels 🟦🟥
- **Multi-Period SR Lines**: Draws dynamic lines for support/resistance from high/low pivots, adjustable for length and quantity, and visually distinct using color, label, and style options.
- **Main Swing Alerts**: Tracks swing direction, assigns colors, and fires alerts only when direction changes, ensuring traders catch priority momentum shifts.
***
### Detailed Alerts System 🚨
- **Custom Alert Inputs**: Users can toggle alerts for CHoCH, BOS, liquidity structure, high-volume, FVG events, sweep zones, false breakouts, and trigger candles—ensuring critical signals are never missed.
- **On-Chart Graphics**: Circles, arrows, and emoji labels clearly mark confirmation, swings, and reversal points directly on the chart, streamlining decision-making.
***
## Example Markdown Table: Alert Features
| Alert Type | Logic/Trigger | Emoji | Visual Output |
|------------------------|--------------------------------------|-------|---------------------------|
| CHoCH (Change of Char.)| Counter-trend BOS detection | 🔄 | Colored line & arrow |
| BOS (Break of Struct.) | Trend BOS, confirming market shift | 💥 | Line/circle at high/low |
| Liquidity Sweep | Price breaks support/resistance | 💧 | Label "Sweep" + alert |
| FVG Alert | FVG zone formation by aggression | ⚡ | Box highlight + alert |
| Supertrend Trigger | Median/std crossovers | 🟩🟥 | Colored area, Buy/Sell |
***
## Customization, Emoji & Styling 🎨
- **All key inputs are grouped and tooltipped for easy setup.**
- **Charts use emojis for sentiment** and direction, visible on tables and labels.
- **Colors are user-selected** for all markers (pivot, BOS, CHoCH, FVG, SR, swing).
- **Visuals (circles/arrows)** highlight entry, exit, and alert points for instant interpretation—making the script unique and easy to use.
***
## Publication & Use 🌐
This script is covered under the Mozilla Public License 2.0. When publishing, provide the following metadata:
- **Title**: One Trade Setup for Life
- **Description**: A fusion tool combining SMC, price action, advanced liquidity analytics, and market structure detection—with a robust alert system and richly visual trading interface.
**Enjoy clear signals, custom alerts, and visually appealing chart markers—all in one package!** 🏆

Smart Money Trades Pro [BOSWaves]Smart Money Trades Pro – Advanced Market Structure & Liquidity Visualizer
Overview
Smart Money Trades Pro is a comprehensive trading tool designed for traders seeking an in-depth understanding of market structure, liquidity dynamics, and institutional flow. The indicator systematically identifies key market turning points, including break of structure (BOS) and change of character (CHoCH) events, and overlays these with adaptive visualizations to highlight high-probability trade setups. By integrating ATR-based risk zones, progressive take-profit levels, and real-time trade analytics, Smart Money Trades Pro transforms complex price action into an interpretable framework suitable for multiple trading styles, including scalping, intraday, and swing trading.
Unlike traditional static indicators, Smart Money Trades Pro adapts continuously to market conditions. It evaluates swing highs and lows over a configurable lookback period, then determines structural breaks using customizable confirmation methods (candle body or wick). The resulting signals are augmented with dynamic entry, stop-loss, and target levels, allowing traders to analyze potential trade opportunities with both precision and context. The indicator’s design ensures that each visual element—trend-colored candles, signal markers, and risk/reward boxes—reflects real-time market conditions, offering an actionable interpretation of institutional activity.
How It Works
The indicator’s foundation is built upon market structure analysis. By calculating pivot highs and lows over a specified period, Smart Money Trades Pro identifies potential points of liquidity accumulation and exhaustion. When price breaks a pivot high or low, the indicator evaluates whether this constitutes a BOS or a CHoCH, signaling trend continuation or reversal. These events are marked on the chart with distinct visual cues, allowing traders to quickly discern shifts in market sentiment without manually analyzing historical price action.
Once a structural break is confirmed, the indicator automatically determines entry levels, stop-loss placements, and progressive take-profit zones (TP1, TP2, TP3). These calculations are based on ATR-derived volatility, ensuring that targets scale with current market conditions. Risk and reward zones are plotted as shaded boxes, providing a clear visual representation of potential profit relative to risk for each trade setup. This system allows traders to maintain discipline and consistency, with dynamic trade management baked directly into the visualization.
Trend direction is further reinforced by color-coded candles, which reflect the prevailing market bias. Bullish trends are represented by one color, bearish trends by another, and neutral conditions are displayed in muted tones. This continuous visual feedback simplifies the process of trend assessment and helps confirm the validity of trade setups alongside BOS and CHoCH markers.
Signals and Breakouts
Smart Money Trades Pro includes structured visual signals to indicate actionable price movements:
Bullish Break Signals – Triangular markers below the candle appear when a swing high is broken, suggesting potential long opportunities.
Bearish Break Signals – Triangular markers above the candle appear when a swing low is broken, indicating potential short setups.
Change of Character (CHoCH) – Special markers highlight trend reversals, showing where momentum shifts from bullish to bearish or vice versa.
These markers are strategically spaced to prevent overlap and remain clear during high-volatility periods. Traders can use them in combination with trend-colored candles, risk/reward zones, and ATR-based targets to assess the strength and reliability of each setup. The integrated table provides live trade information, including entry price, stop-loss level, take-profit levels, risk/reward ratio, and trade direction, ensuring that trade decisions are informed and data-driven.
Interpretation
Trend Analysis : The indicator’s trend coloring, combined with BOS and CHoCH detection, provides an immediate view of market direction. Rising structures indicate bullish momentum, while falling structures signal bearish momentum. CHoCH markers highlight potential trend reversals or significant liquidity sweeps.
Volatility and Risk Assessment : ATR-based calculations determine stop-loss distances and target levels, giving a quantitative measure of risk relative to market volatility. Wide ATR readings indicate periods of high price fluctuation, whereas narrow readings suggest consolidation and reduced risk exposure.
Market Structure Insights : By monitoring swing highs and lows alongside break confirmations, traders can identify where institutional players are likely active. Areas with multiple structural breaks or overlapping targets can indicate liquidity hotspots, potential reversal zones, or areas of market congestion.
Trade Management : The built-in trade zones allow traders to visualize entry, risk, and reward simultaneously. Progressive targets (TP1, TP2, TP3) reflect incremental profit-taking strategies, while dynamic stop-loss levels help preserve capital during adverse moves.
Strategy Integration
Smart Money Trades Pro supports a range of trading approaches:
Trend Following : Enter trades in the direction of confirmed BOS while using CHoCH markers and trend-colored candles to validate momentum.
Pullback Entries : Use failed breakout retests or minor reversals toward broken structure levels for lower-risk entries.
Mean Reversion : In consolidated zones with narrow ATR and repeated BOS/CHoCH activity, anticipate reversals or short-term corrective moves.
Multi-Timeframe Confirmation : Overlay signals on higher or lower timeframes to filter noise and improve trade accuracy.
Stop-loss levels should be placed just beyond the opposing structural point, while take-profit targets can be scaled using the ATR-based zones. Progressive targets allow for partial exits or scaling out of trades while maintaining exposure to larger moves.
Advanced Techniques
Traders seeking greater precision can combine Smart Money Trades Pro with volume, momentum, or volatility indicators to validate signals. Observing sequences of BOS and CHoCH markers across multiple timeframes provides insight into liquidity accumulation and depletion trends. Tracking the expansion or contraction of ATR-based zones helps anticipate shifts in volatility, enabling better timing for entries and exits.
Customizing the structure period and confirmation type allows the indicator to adapt to different asset classes and timeframes. Shorter periods increase sensitivity to smaller swings, while longer periods filter noise and emphasize higher-probability structural breaks. By integrating these features, the indicator offers a robust statistical framework for disciplined, data-driven trading decisions.
Inputs and Customization
Structure Detection Period : Defines the lookback window for pivot high and low calculation.
Break Confirmation : Choose whether to confirm breaks using candle body or wick.
Display CHoCH : Toggle visibility of change-of-character markers.
Color Trend Bars : Enable color-coding of candles based on market structure direction.
Show Info Table : Display trade dashboard showing entry, stop-loss, take-profits, risk/reward, and bias.
Table Position : Choose from top-left, top-right, bottom-left, or bottom-right placement.
Color Customization : Configure bullish, bearish, neutral, risk, reward, and text colors for enhanced visual clarity.
Why Use Smart Money Trades Pro
Smart Money Trades Pro transforms complex market behavior into an actionable visual framework. By combining market structure analysis, liquidity tracking, ATR-based risk/reward mapping, and a dynamic trade dashboard, it provides a multidimensional view of the market. Traders can focus on execution, interpret trends, and evaluate overextensions or reversals without relying on guesswork. The indicator is suitable for scalping, intraday, and swing strategies, offering a comprehensive system for understanding and trading alongside institutional participants.

Market Structure [PRO][keypoems] - 100% rewritten engineMarket Structure — 100% rewritten engine
Successor to my earlier script Supply and Demand Areas Responsible and Origins . This version rebuilds the engine from scratch and adds HTF support, tap tracking, dealing ranges (“expansion legs”), and DB/DT pattern logic.
What it draws
Market‑structure zones built from protected high/low and confirmed BOS/MSS. Zones extend forward and remain on chart until 50% mitigation is wicked. Optional 30/50/70 levels.
Protected High/Low lines and Continuation High/Low levels; BOS and MSS lines are plotted at confirmation.
SNDR (Supply & Demand Responsible) areas for the counter‑trend swing that caused the BOS. The engine auto‑pivots (tries 3‑pivot then 1‑pivot) and extends each SNDR until 100% mitigation. First‑tap and second‑tap states are tracked and visually marked.
Zone Tap detection : when price first enters an unmitigated zone, leaves it, and then violates a continuation level, the script confirms the tap and draws a horizontal TAP line from the tap swing for future retests.
Dealing Ranges (Expansion legs) : created on BOS→MSS flips or opposite‑direction MSS. Each range is anchored at the protected level, tracks the current extreme, and marks 50% mitigation. A diagonal arrow plus a 50% line show live progress. An optional right‑hand visual stacks all unmitigated ranges as compact boxes with their 50% line.
Double Bottom / Double Top patterns : search starts at BOS/MSS events, confirms on neckline break, and draws an ATR‑buffered box and an extending neckline.
Valid pullback labels and candidate confirmation lines help verify swing sequence formation.
HTF support
Choose a higher timeframe in the Timeframe input to compute market structure on HTF while viewing a lower‑timeframe chart. The script uses request.security and only confirms using closed HTF candles, so zones, BOS/MSS, mitigations and taps match the native HTF chart.
How it works (brief)
Builds an alternating sequence of valid swings, tracks protected levels, and creates a zone on BOS; zones close or roll when MSS occurs.
Zone mitigation = wick through the zone’s 50%. SNDR mitigation = full breach (100%).
Tap logic requires: entry into the zone → exit → violation of a relevant continuation level; only then the TAP line is drawn.
Dealing ranges start from the protected level at BOS→MSS (or opposite MSS), track the current extreme, and flag mitigation at 50%.
DB/DT confirms only after a close through the neckline.
Notes
Origins from the prior script have not been ported to this engine yet.
Includes a performance switch (scan all zones vs. a recent subset) and an optional on‑chart debug table.
Visual tool for price‑action study; not a strategy and not financial advice.

XAUUSD Strength Dashboard with VolumeXAUUSD Strength Dashboard with Volume Analysis
📌 Description
This advanced Pine Script indicator provides a multi-timeframe dashboard for XAUUSD (Gold vs. USD), combining price action analysis with volume confirmation to generate high-probability trading signals. It detects:
✅ Break of Structure (BOS)
✅ Fair Value Gaps (FVG)
✅ Change of Character (CHOCH)
✅ Trendline Breaks (9/21 SMA Crossover)
✅ Volume Spikes (Confirmation of Strength)
The dashboard displays strength scores (0-100%) and action recommendations (Strong Buy/Buy/Neutral/Sell/Strong Sell) across multiple timeframes, helping traders identify confluences for better trade decisions.
🎯 How It Works
1. Multi-Timeframe Analysis
Fetches data from 1m, 5m, 15m, 30m, 1h, 4h, Daily, and Weekly timeframes.
Compares trend direction, BOS, FVG, CHOCH, and volume spikes across all timeframes.
2. Volume-Confirmed Strength Score
The Strength Score (0-100%) is calculated using:
Trend Direction (25 points) → 9 SMA vs. 21 SMA
Break of Structure (20 points) → New highs/lows with momentum
Fair Value Gaps (10 points) → Imbalance zones
Change of Character (10 points) → Shift in market structure
Trendline Break (20 points) → SMA crossover confirmation
Volume Spike (15 points) → High volume confirms moves
Score Interpretation:
≥75% → Strong Buy (High confidence bullish move)
60-74% → Buy (Bullish but weaker confirmation)
40-59% → Neutral (No strong bias)
25-39% → Sell (Bearish but weaker confirmation)
≤25% → Strong Sell (High confidence bearish move)
3. Dashboard & Chart Markers
Dashboard Table: Shows Trend, BOS, Volume, CHOCH, TL Break, Strength %, Key Level, and Action for each timeframe.
Chart Markers:
🟢 Green Triangles → Bullish BOS
🔴 Red Triangles → Bearish BOS
🟢 Green Circles → Bullish CHOCH
🔴 Red Circles → Bearish CHOCH
📈 Green Arrows → Bullish Trendline Break
📉 Red Arrows → Bearish Trendline Break
"Vol↑" (Lime) → Bullish Volume Spike
"Vol↓" (Maroon) → Bearish Volume Spike
🚀 How to Use
1. Dashboard Interpretation
Higher Timeframes (D/W) → Show the dominant trend.
Lower Timeframes (1m-4h) → Help with entry timing.
Strength Score ≥75% or ≤25% → Look for high-confidence trades.
Volume Spikes → Confirm breakouts/reversals.
2. Trading Strategy
📈 Long (Buy) Setup:
Higher TFs (D/W/4h) show bullish trend (↑).
Current TF has BOS & Volume Spike.
Strength Score ≥60%.
Key Level (Low) holds as support.
📉 Short (Sell) Setup:
Higher TFs (D/W/4h) show bearish trend (↓).
Current TF has BOS & Volume Spike.
Strength Score ≤40%.
Key Level (High) holds as resistance.
3. Customization
Adjust Volume Spike Multiplier (Default: 1.5x) → Controls sensitivity to volume spikes.
Toggle Timeframes → Enable/disable higher/lower timeframes.
🔑 Key Benefits
✔ Multi-Timeframe Confluence → Avoids false signals.
✔ Volume Confirmation → Filters low-quality breakouts.
✔ Clear Strength Scoring → Removes emotional bias.
✔ Visual Chart Markers → Easy to spot key signals.
This indicator is ideal for gold traders who follow institutional order flow, market structure, and volume analysis to improve their trading decisions.
🎯 Best Used With:
Support/Resistance Levels
Fibonacci Retracements
Price Action Confirmation
🚀 Happy Trading! 🚀

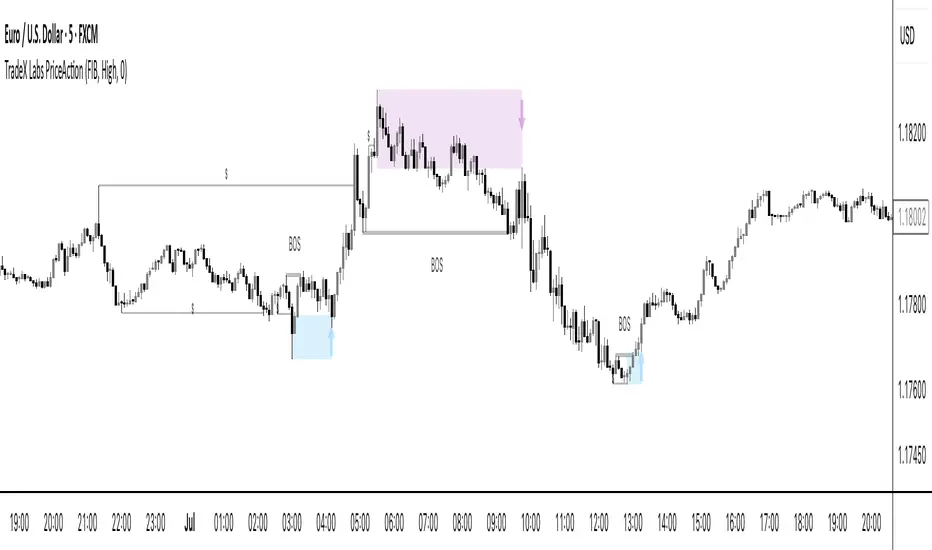
TradeX Labs PriceActionTradeX Labs Price Action — Multi-Layered Market Structure & Liquidity Visualizer
This invite-only script is a unified price-action framework for traders who want a clear, multi-timeframe visual map of structure, liquidity events, and execution zones. It is not a simple combination of existing tools — all modules are custom-built in-house and designed to work from a shared data model, ensuring every feature interacts seamlessly with the others.
Purpose & Core Design
The script’s foundation is a fractal-based swing engine that detects high-quality structural pivots. These pivots form the anchor points for:
BOS (Break of Structure) and structural shift detection
Liquidity sweep identification for stop hunts and inducements
Session range mapping (e.g., Asian high/low)
Rule-based zone projection using displacement and retracement logic
Rather than plotting isolated indicators, every detection method feeds into a single structure model so that BOS, liquidity events, and zones are all derived from the same underlying market map.
Zone Generation & Entry Mapping
Zones are calculated from swing-to-swing displacement legs and projected using Fibonacci presets (50 %, 61.8 %, 78.6 %). Users can select:
Calculation method: Fibonacci, Point of Interest (POI), or both
Zone frequency: High (wider), Medium (balanced), or Low (deeper) retracement levels
Extension length: Forward projection in bars to match chart timeframe
This ensures zones are consistent, structurally relevant, and adaptable to different styles.
Inducement & Liquidity Filters
For refined context, setups can be filtered by inducement type:
Minor: Sweeps of current day/session highs or lows
Medium: Sweeps of previous day’s highs/lows
Major: Sweeps of weekly highs/lows
Filters may run independently or in combination, hiding zones that lack interaction with key liquidity levels.
QuickStrikes Session Filter
QuickStrikes is an optional filter that checks BOS and/or entry levels against the Asian session high/low:
V1 (BOS validation): BOS position relative to session range
V2 (Entry validation): Entry zone position relative to session range
V3 (Combined): Both BOS and entry must meet positional criteria
Multiple modes can be active simultaneously, and all selected conditions must pass for a setup to display.
Custom Visuals & Usability
Every plotted element — zones, BOS labels, inducement levels, arrows, risk/reward boxes — can be styled to match any chart theme. The optional visual panel provides an at-a-glance risk-to-reward display.
Disclaimer
This is an original, closed-source TradeX Labs tool built entirely from proprietary logic referencing known concepts (e.g., Fibonacci ratios, session ranges, swing detection) within a rule-based framework. It produces visual analysis only and does not predict price or guarantee results. Default settings are for illustration; traders should adjust to their instrument and timeframe.
Order-Flow Market StructureOrder-Flow Market Structure by The_Forex_Steward
A precision tool for visualizing internal shifts, swing structure, BOS events, Fibonacci levels, and multi-timeframe alerts.
What It Does
The Order-Flow Market Structure indicator intelligently tracks and visualizes price structure using higher timeframe candles. It automatically detects:
• Internal bullish and bearish structure shifts
• Swing highs and lows (HH, HL, LH, LL)
• Break of Structure (BoS) confirmations
• Fibonacci retracement levels from recent swing moves
• Real-time alerts across LTF, MTF, and HTF modes
It’s a complete tool for traders who follow Smart Money Concepts, ICT, or institutional price action strategies.
How It Works
• You select a Higher Timeframe (HTF) to set the structural context
• Internal shifts are identified using HTF candle closes
• The indicator scans for swing highs/lows after each internal shift
• Breaks of previous swing points confirm BoS and plot horizontal lines
• Zigzag lines visually connect structural points (swings and BoS)
• Fibonacci levels are drawn between the latest swings
• Alerts can be configured for structure shifts, BoS events, and fib level breaks
How to Use It
Set your preferred HTF (e.g., 1H while trading on 5-minute)
Enable Fibonacci levels to visualize retracement zones
Watch for:
• Bullish internal shifts → HL to HH
• Bearish internal shifts → LH to LL
• BOS → Breakout confirmation
Enable alerts to catch structural events in real-time
Adjust the "Safe History Offset" if working with long lookbacks or volatile assets
Who It's For
• Traders using Smart Money, ICT, or market structure-based systems
• Scalpers, day traders, and swing traders
• Anyone needing precise structural insight across multiple timeframes
Features
• BoS detection with custom line styles and width
• HH, HL, LH, LL label plotting
• Optional Fibonacci retracement zones
• Custom alerts for swing shifts and fib level breaks
• LTF, MTF, and HTF alert modes
Stay aligned with structure, trade with precision, and get alerted to key shifts in real time.

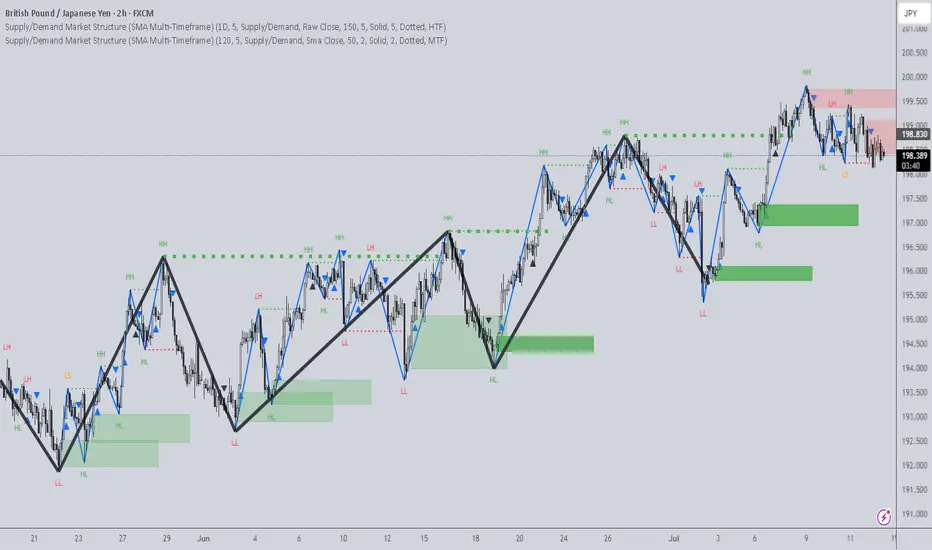
Supply/Demand Market Structure (SMA Multi-Timeframe)Supply/Demand Based Market Structure
Structure + Order Blocks from Synthetic SMA Candles
Overview:
The SMA Supply/Demand Market Structure indicator combines market structure analysis with supply/demand logic, powered by SMA-based synthetic candles . Instead of relying on raw candle data, this tool generates smoothed higher-timeframe candles using simple moving averages to identify more stable zones and cleaner structure shifts.
It detects bullish and bearish breaks of structure (BoS) , highlights swing points like HH, HL, LH, LL , and plots institutional-style supply and demand zones formed from aggressive rallies or drops. The result is a precise and noise-filtered view of market intent, perfect for trend-following or smart money strategies.
How It Works:
- Synthetic candles are created using SMA of OHLC values on your selected timeframe (HTF).
- A bullish break occurs when price closes above the high of the last bearish synthetic candle.
- A bearish break occurs when price closes below the low of the last bullish synthetic candle.
- Upon break confirmation:
- A demand zone is drawn using the last bearish candle.
- A supply zone is drawn using the last bullish candle.
- Each zone is extended forward for a user-defined number of bars and optionally deleted upon mitigation.
- Zigzag-based internal structure connects valid swing points and classifies them as HH, HL, LH, LL , including Liquidity Sweeps (LS) .
- BoS levels are highlighted with lines that automatically reset when new structure forms.
Key Features:
- Synthetic SMA Candles : Smooth and reliable structure from average-based HTF candles
- Break Modes : Choose between raw HTF closes or SMA closes for break logic
- Custom Timeframe Selection : Analyze structure across any HTF you choose
- Dynamic Supply/Demand Zones : Auto-plot boxes from valid rallies/drops
- Mitigation Detection : Optionally fade or delete zones when price trades through
- Zigzag Structure Mapping : Automatically connect structural highs/lows
- BoS Detection : Real-time breakout of swing points with visual confirmation
- Smart Labels : Marks HH, HL, LH, LL, and LS directly on the chart
- Multi-timeframe Alert System : Notify for all structural changes, BoS, and new zones
How to Use:
- Set your desired HTF and SMA Length for synthetic candle smoothing.
- Use SMA=1 for raw candles
- Select a Break Mode :
- Raw Close : Uses standard HTF close values
- SMA Close : Uses smoothed closes from SMA
- Watch for bullish or bearish breaks — zones are plotted when price confirms breakout structure.
- Use demand zones as long entry areas and supply zones as short setups on retests.
- Rely on internal shifts and zigzag swings to monitor structure continuity.
- Enable alerts for swing formations, BoS, and liquidity sweeps to trade hands-free.
Recommended Strategies:
- Smart Money & ICT Models : Use synthetic demand/supply + BoS for mitigation or continuation plays
- Swing Trading : Align with higher timeframe structure and use zones for entry triggers
- Trend Trading : Confirm structure alignment and wait for pullbacks into zones
- Reversal Entries : Trade structure breaks when zones fail and a BoS confirms the shift
Customization Options:
- Timeframe input for custom HTF control
- SMA Length to adjust candle smoothing
- Zone Style : Control zone color, transparency, and duration
- Structure Display : Toggle swing labels and zigzag visuals
- Alert Mode : Choose between LTF, MTF, or HTF alerts
Summary:
SMA Supply/Demand Market Structure provides a clean, flexible view of price structure and institutional intent by fusing market structure with SMA-based synthetic candles. It’s ideal for anyone seeking reduced noise, visually guided entries, and rule-based trading based on structural shifts and real-time demand/supply dynamics.
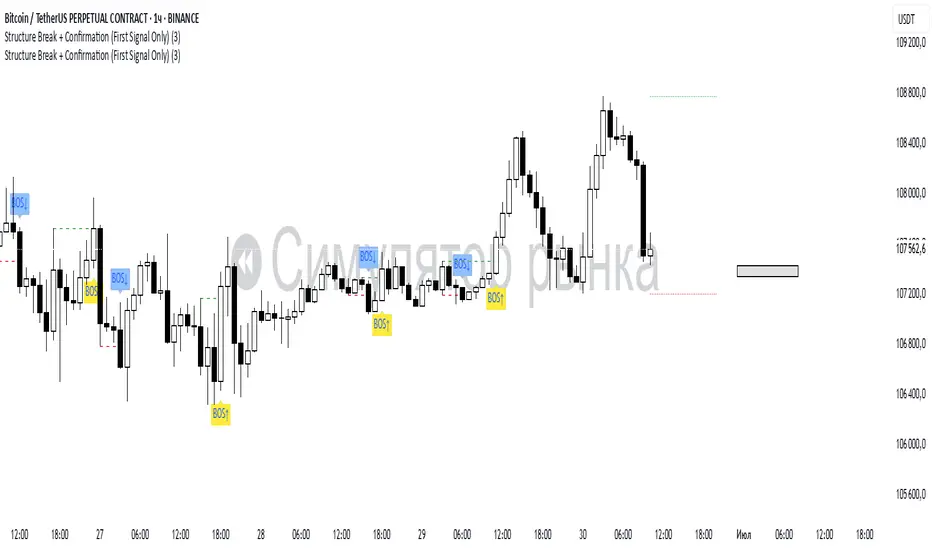
Structure Break + Confirmation (First Signal Only)Swing Detection:
A Swing High is detected when the high of the central candle (based on a lookback period) is greater than the highs of the candles before and after.
A Swing Low is detected when the low of the central candle is lower than the lows of the candles before and after.
Break of Structure (BOS):
A BOS Up is confirmed when a candle closes above the most recent swing high (with a body close).
A BOS Down is confirmed when a candle closes below the most recent swing low.
Confirmation (CONF):
A CONF Up is triggered when price makes a new high after a BOS Up.
A CONF Down is triggered when price makes a new low after a BOS Down.
Only the first confirmation after a BOS is plotted.
Visuals:
Cross marks (×) are plotted at swing points.
BOS signals are shown with green (up) and red (down) labels.
CONF signals are shown with lime (up) and orange (down) triangle markers.
Dotted lines are drawn at the levels of broken swing highs/lows.
Advanced SMC Market Structure AnalyzerAdvanced SMC Market Structure Analyzer
Version 1.0 • by Rendon1
Short Description:
A multi-timeframe Smart Money Concepts (SMC) toolkit for detecting Breaks of Structure (BOS), Changes of Character (CHoCH), liquidity zones, order blocks, fair-value gaps, and raw entry signals—all in one overlay indicator.
🔍 Overview
This script analyzes both a higher timeframe (e.g. 4H) for market structure shifts and a lower “entry” timeframe (e.g. 5–30 m) to flag optimal entries. It visually marks:
BOS (Higher-Highs/Bearish BOS & Lower-Lows/Bullish BOS)
CHoCH (structure flips)
Liquidity Zones (equal highs/lows)
Order Blocks (last candle before a directional move)
Fair-Value Gaps on the entry timeframe
Buy/Sell Labels when multiple conditions align
⚙️ Features
Multi-Timeframe Structure: Define your higher-timeframe for HTF swings and a customizable lower-timeframe for precision entries.
Swing Sensitivity: Adjustable pivot lookback (default 5 bars).
Liquidity Detection: Highlights market stagnation points via equal highs/lows.
Order Blocks & FVG: Identifies key institutional zones on both HTF and LTF.
Automated Entry Signals: Composite logic combining CHoCH with LTF order blocks or fair-value gaps.
Alerts Built-In: “Bullish Entry,” “Bearish Entry,” “CHoCH Detected,” and “BOS Detected.”
⚙️ Inputs
Setting Default Description
Swing Detection Sensitivity 5 Lookback bars for pivot detection (higher = smoother)
Show Structure Labels ☑️ Toggle visual BOS/CHoCH labels
HTF Structure Timeframe 240 Higher-timeframe (minutes) for market structure
Entry Structure Timeframe 15 Lower-timeframe for order block & FVG entries
Liquidity Lookback 3 Bars to check for equal highs/lows
📖 How to Use
Add to Chart: Apply the indicator to any symbol.
Configure Timeframes: Choose your preferred HTF (e.g. 4H) and LTF (e.g. 15 m).
Interpret Signals:
Blue “BOS” labels mark momentum breaks on HTF.
Orange “CHoCH” labels indicate structure flips.
Green “🟢 BUY” and Red “🔴 SELL” labels appear when HTF flips align with LTF zones.
Set Alerts: Right-click any of the built-in alert conditions to add real-time notifications.
⚠️ Disclaimer
This script is for educational purposes only and does not constitute financial advice. Trading involves risk, and you should perform your own analysis before making any trades. The author is not liable for any losses or gains resulting from the use of this indicator.

Ultra Market StructureThe Ultra Market Structure indicator detects key market structure breaks, such as Break of Structure (BoS) and Change of Character (CHoCH), to help identify trend reversals. It plots lines and labels on the chart to visualize these breakpoints with alerts for important signals.
Introduction
This script is designed to help traders visualize important market structure events, such as trend breaks and reversals, using concepts like Break of Structure (BoS) and Change of Character (CHoCH). The indicator highlights internal and external price levels where the market shifts direction. It offers clear visual signals and alerts to keep traders informed of potential changes in the market trend.
Detailed Description
The indicator focuses on detecting "market structure breaks," which occur when the price moves past significant support or resistance levels, suggesting a potential reversal or continuation of the trend.
.........
Type of structure
Internal Structure: Focuses on smaller, shorter-term price levels within the current market trend.
External Structure: Focuses on larger, longer-term price levels that may indicate more significant shifts in the market.
.....
Key events
Break of Structure (BoS): A market structure break where the price surpasses a previous high (bullish BoS) or low (bearish BoS).
Change of Character (CHoCH): A shift in market behavior when the price fails to continue in the same direction, indicating a possible trend reversal.
Once a break or shift is detected, the script plots lines and labels on the chart to visually mark the breakpoints.
It also provides alerts when a BoS or CHoCH occurs, keeping traders informed in real-time.
The indicator can color the background and candles based on the market structure, making it easy to identify the current trend.
.....
Special feature
At news events or other momentum pushes most structure indicators will go into "sleep mode" because of too far away structure highs/lows. This indicator has a structure reset feature to solve this issue.
.........
Detects Break of Structure (BoS) and Change of Character (CHoCH) signals.
Marks internal and external support/resistance levels where market trends change.
Provides visual cues (lines, labels) and real-time alerts for structure breaks.
Offers background and candle color customization to highlight market direction.

Trend_Prime_MasterTrend_Prime_Master is a trend-following indicator designed to help traders identify potential buy and sell signals with enhanced clarity and reliability. This indicator integrates multiple technical analysis tools into a cohesive system, maximizing their individual strengths to offer traders a comprehensive view of market trends. With its advanced blend of market structure analysis, multiple EMAs, custom volume and momentum indicators, and multi-timeframe trend confirmation, Trend_Prime_Master is tailored to navigate the complexities of financial markets.
Core Features
Trend_Prime_Master offers a suite of features that provide in-depth analysis and actionable insights into market trends:
Multi-Timeframe Trend Analysis: This feature ensures that the signals you act on are aligned with broader market trends by filtering and confirming them across various timeframes. By aligning your trades with the larger market direction, you improve the overall consistency of your trading decisions.
Sophisticated Signal Generation: Signals are generated based on a confluence of technical conditions, including Exponential Moving Average (EMA) crossovers and custom momentum indicators. This multi-layered approach helps focus on signals that have strong backing from market conditions, thereby increasing the reliability of trading decisions.
Color-Changing Trend Line: The trend line changes color based on the market's current direction, providing a quick visual cue for traders. Green indicates a bullish trend, while red signals a bearish trend. This feature simplifies the process of identifying trends, allowing traders to make informed decisions at a glance.
Adaptive Lines: The adaptive lines in Trend_Prime_Master adjust dynamically based on market conditions. These lines provide a more responsive view of the trend compared to static moving averages, particularly useful in volatile markets.
Short Trend Lines: In addition to the main trend line, Trend_Prime_Master includes short trend lines that focus on immediate market movements. These lines are based on shorter EMAs and offer additional layers of trend confirmation, particularly in fast-moving markets.
Custom Volume and Momentum Indicators: These advanced tools validate the strength of trends by assessing the underlying market pressure and the speed of price movements, ensuring that signals are supported by substantial market activity.
Heikin Ashi Integration: Heikin Ashi candles are used to smooth out price data, reducing noise and providing a clearer view of the underlying trend. This integration enhances the clarity and reliability of the signals, making it easier to follow the trend and make informed decisions.
CHoCH (Change of Character): CHoCH is a critical component in understanding market structure changes. It occurs when the market shows a significant shift in behavior, such as moving from a trending phase to a consolidation phase, or vice versa. Trend_Prime_Master automatically detects and labels CHoCH on the chart, helping traders anticipate potential reversals or shifts in market momentum.
Detailed Component Explanations
Every component in Trend_Prime_Master has been carefully selected and integrated to enhance the overall performance of the indicator. Here’s a detailed explanation of how these components work together:
EMA Combinations for Trend Identification: Trend_Prime_Master utilizes multiple EMAs with different periods to capture both short-term and long-term trends. By analyzing the relationship between faster and slower EMAs, the indicator identifies potential trend reversals and continuations. The combination of multiple EMAs helps in smoothing out price data, reducing noise, and providing a more accurate depiction of the trend.
Adaptive Lines: The adaptive lines in Trend_Prime_Master adjust dynamically based on changing market conditions. Unlike static moving averages, which use a fixed calculation period, adaptive lines recalibrate themselves to respond more effectively to shifts in market momentum. This allows traders to capture emerging trends more quickly and avoid the lag associated with traditional moving averages.
Short Trend Lines: Short trend lines are calculated using faster EMAs and are designed to highlight immediate market trends. These lines are particularly useful for traders who focus on short-term market movements, providing early indications of potential trend reversals or continuations. By combining short trend lines with longer EMAs, Trend_Prime_Master offers a multi-layered approach to trend analysis, ensuring that both short-term and long-term perspectives are considered.
Point of Control (POC):
The Point of Control (POC) is a key concept in volume profile analysis that represents the price level with the highest traded volume over a specific period. In Trend_Prime_Master, the POC line is automatically calculated and plotted on the chart. This level is crucial because it often acts as a significant support or resistance level, where price tends to gravitate towards or bounce off. By incorporating the POC, Trend_Prime_Master enhances your ability to identify critical price levels that are likely to influence future price movements.
The POC works synergistically with other components like EMAs and custom momentum indicators by confirming whether these technical signals align with high-volume price levels. For instance, a buy signal near the POC might suggest a strong support level, making the trade more likely to succeed, while a sell signal below the POC could indicate a potential breakout or continuation of a downtrend.
Break of Structure (BOS): BOS is a crucial concept in market structure analysis that indicates a significant change in market behavior. It occurs when the market breaks a previous high or low, suggesting a potential reversal or continuation of the trend. In Trend_Prime_Master, BOS is used to identify these critical moments, helping traders anticipate major market moves. BOS works in conjunction with other signals, such as EMA crossovers and trend line changes, to provide a comprehensive picture of the market's direction.
CHoCH (Change of Character): CHoCH refers to a sudden and significant shift in market behavior, often signaling a change from a trending market to a ranging one, or vice versa. This concept is crucial for traders who need to adjust their strategies based on the market’s current phase. Trend_Prime_Master automatically detects CHoCH moments and marks them on the chart, allowing traders to adapt their strategies promptly and effectively.
Custom Volume and Momentum Indicators: These custom indicators in Trend_Prime_Master go beyond standard tools by incorporating advanced calculations that consider both the direction and intensity of market moves. These indicators help validate the strength of a trend, ensuring that traders act on signals backed by strong market activity. This allows for a more nuanced view of trend strength, supporting better trading decisions.
Color-Changing Trend Line: This visual tool is not just a simple trend line; it dynamically adjusts its color based on the current trend direction, providing an immediate visual representation of the market’s state. When combined with other components like BOS and custom volume indicators, the color-changing trend line helps traders quickly assess whether the current market conditions favor a particular trade, reducing the cognitive load on traders and enabling faster decision-making.
Multi-Timeframe Filters: These filters ensure that the signals generated on a lower timeframe are consistent with the trends observed on higher timeframes. A signal is only considered valid if it aligns across these multiple timeframes, ensuring that your trades are supported by the broader market context.
Heikin Ashi Smoothing: Heikin Ashi candles are incorporated into Trend_Prime_Master to smooth out noise in price data. These candles average out price movements, making it easier to identify the underlying trend without being distracted by minor fluctuations. This smoothing effect is particularly useful in volatile markets, where traditional candlesticks might present a confusing picture of market behavior.
How It Works
Trend_Prime_Master integrates these tools into a cohesive system designed to provide clear and actionable insights into market trends:
EMA-Based Trend Identification: By analyzing multiple EMAs, Trend_Prime_Master identifies the prevailing market trend and potential reversals. This process involves comparing the positions of faster and slower EMAs to detect crossovers, which are key signals for trend changes.
Adaptive Lines: These lines adjust in real-time to reflect the current market conditions. They offer a more responsive trend-following approach compared to traditional moving averages, making them particularly useful in volatile or rapidly changing markets.
Short Trend Lines: These lines focus on short-term market trends, providing early signals of potential reversals or continuations. By tracking immediate price movements, short trend lines help traders respond quickly to market changes, offering a valuable perspective in fast-moving markets.
Point of Control (POC):The POC represents the price level with the highest traded volume over a specific period. In Trend_Prime_Master, the POC is plotted to help traders identify key levels where the market has shown significant interest. These levels often act as strong support or resistance and can be crucial in determining the validity of a trend. For instance, a signal near the POC might indicate a more reliable setup, as it shows that the price is aligning with a major volume level.
Break of Structure (BOS): BOS plays a pivotal role in confirming trend reversals. When the price breaks a significant structure, such as a previous high or low, it suggests that the market may be shifting direction. This is particularly important for traders looking to enter the market at the beginning of a new trend.
CHoCH (Change of Character): CHoCH is critical for recognizing shifts in market phases. For example, a CHoCH might indicate that a market is moving from a trend into a consolidation phase, or vice versa. By identifying these changes early, Trend_Prime_Master allows traders to adjust their strategies accordingly, whether that means tightening stop-losses in a trending market or preparing for breakout trades in a consolidating one.
Custom Volume and Momentum Confirmation: These custom indicators add an extra layer of validation to the signals generated by Trend_Prime_Master. By confirming that there is strong market participation and momentum behind a move, these indicators help ensure that traders are acting on signals supported by robust market activity.
Color-Changing Trend Line: This feature provides an easy-to-understand visual representation of the market's direction, changing color based on whether the market is in a bullish or bearish phase. It works in tandem with other components like EMAs and custom volume indicators to give traders a quick, comprehensive view of market conditions.
Settings
• Trading Style: Select the trading style that best suits your strategy (Short, Medium, Long, HTSpecial, Standard). This setting adjusts the parameters of the EMAs and other components to align with different timeframes, ensuring that the indicator is tuned to the specific market conditions you're trading in.
• Show Possible Signals: Toggle this setting to enable or disable the display of possible buy and sell signals. This allows traders to focus on confirmed signals or to see potential opportunities as they develop.
• Possible Signals Filter: If you wish to filter possible signals based on a higher timeframe trend, enable this option and select the appropriate higher timeframe. This helps ensure that the signals you act upon are in sync with broader market trends, reducing the risk of counter-trend trades.
Colors for Signals and Moving Averages:
• Customize the colors for bullish, bearish, and neutral signals, as well as for the various moving averages. This allows traders to personalize the visual aspects of the indicator, making it easier to interpret signals at a glance.
Trend Line Settings:
• Adaptive Line: Toggle to enable or disable the adaptive trend line, which adjusts dynamically based on market conditions. The line changes color to reflect the current trend direction, providing a quick visual cue.
• Short Trend Lines: Enable this option to display shorter-term trend lines. These lines help in identifying immediate market movements and can be particularly useful for short-term traders.
• Length and Smoothing: Adjust the length and smoothing parameters for the trend lines to fine-tune how responsive they are to price changes.
Point of Control (POC) Settings:
• Show POC Line: Toggle this setting to display the POC on your chart. The POC is a critical level where the most volume has been traded, and it often acts as a significant support or resistance level.
• POC Color and Width: Customize the color and width of the POC line to make it stand out or blend in with your other chart elements, depending on your preference.
Why It's Worth Paying For
Trend_Prime_Master provides several unique advantages that make it a valuable tool for traders:
Comprehensive Market Analysis: By integrating multiple technical analysis tools, Trend_Prime_Master provides a holistic view of market trends, helping you make more informed decisions.
Customization and Flexibility: The indicator’s settings can be easily adjusted to suit your trading style, whether you’re focusing on short-term trades or long-term investments.
Reliable Signal Generation: The multi-layered approach—combining EMAs, custom volume indicators, and trend lines—minimizes the likelihood of weak signals, enhancing your trading process.
Advanced Features: Features like multi-timeframe analysis, Heikin Ashi smoothing, and the color-changing trend line provide insights that are not typically found in other indicators, giving you a trading edge.
Enhanced Market Understanding: The ability to detect and act on changes in trend strength and momentum helps you develop a deeper understanding of market dynamics.
Consistency Across Markets: Trend_Prime_Master is designed to perform reliably across various market conditions, making it a versatile tool in any trading environment.
User-Friendly Interface: Despite its advanced capabilities, the indicator is easy to use, making it accessible to traders of all experience levels.
Ongoing Support and Updates: As a user of Trend_Prime_Master, you receive ongoing support and regular updates to keep the indicator effective and up-to-date with the latest market trends and techniques.
Risk Disclaimer
While Trend_Prime_Master is designed to deliver robust trading signals, it’s important to maintain realistic expectations:
Performance: The indicator is based on solid technical analysis principles, but it cannot predict the future or guarantee success. It should be used as part of a comprehensive trading strategy that includes effective risk management.
Signal Reliability: The signals generated are based on historical data and trends. While they are designed to be consistent with market conditions, they cannot guarantee future outcomes. Always be prepared for unexpected market changes.
Market Conditions: Trend_Prime_Master excels in trending markets but, like any tool, its effectiveness may vary in choppy or highly volatile conditions. Adjusting the settings and strategy according to the market environment is recommended.
How to Get Access
To gain access to Trend_Prime_Master, please send me a direct message on TradingView or use the provided link to request access. Ensure that access requests are made privately so the comments section can remain focused on discussions related to the script’s performance and use.

Fair Value Gaps Setup 01 [TradingFinder] FVG Absorption + CHoCH🔵 Introduction
🟣 Market Structures
Market structures exhibit a fractal and nested nature, which leads us to classify them into internal (minor) and external (major) categories. Definitions of market structure vary, with different methodologies such as Smart Money and ICT offering distinct interpretations.
To identify market structure, the initial step involves examining key highs and lows. An uptrend is characterized by successive highs and lows that are higher than their predecessors. Conversely, a downtrend is marked by successive lows and highs that are lower than their previous counterparts.
🟣 Market Trends and Movements
Market trends consist of two primary types of movements :
Impulsive Movements : These movements align with the main trend and are characterized by high strength and momentum.
Corrective Movements : These movements counter the main trend and are marked by lower strength and momentum.
🟣 Break of Structure (BOS)
In a downtrend, a Break of Structure (BOS) occurs when the price falls below the previous low and establishes a new low (LL). In an uptrend, a BOS, also known as a Market Structure Break (MSB), happens when the price rises above the last high.
To confirm a trend, at least one BOS is necessary, which requires the price to close at least one candle beyond the previous high or low.
🟣 Change of Character (CHOCH)
Change of Character (CHOCH) is a crucial concept in market structure analysis, indicating a shift in trend. A trend concludes with a CHOCH, also referred to as a Market Structure Shift (MSS).
For example, in a downtrend, the price continues to drop with BOS, showcasing the trend's strength. However, when the price rises and exceeds the last high, a CHOCH occurs, signaling a potential transition from a downtrend to an uptrend.
It is essential to note that a CHOCH does not immediately indicate a buy trade. Instead, it is prudent to wait for a BOS in the upward direction to confirm the uptrend. Unlike BOS, a CHOCH confirmation does not require a candle to close; merely breaking the previous high or low with the candle's wick is sufficient.
🟣 Spike | Inefficiency | Imbalance
All these terms mean fast price movement in the shortest possible time.
🟣 Fair Value Gap (FVG)
To pinpoint the "Fair Value Gap" (FVG) on a chart, a detailed candle-by-candle analysis is necessary. This process involves focusing on candles with substantial bodies and evaluating them in relation to the candles immediately before and after them.
Here are the steps :
Identify the Central Candle : Look for a candle with a large body.
Examine Adjacent Candles : The candles before and after this central candle should have long shadows, and their bodies must not overlap with the body of the central candle.
Determine the FVG Range : The distance between the shadows of the first and third candles defines the FVG range.
This method helps in accurately identifying the Fair Value Gap, which is crucial for understanding market inefficiencies and potential price movements.
🟣 Setup
This setup is based on Market Structure and FVG. After a change of character and the formation of FVG in the last lag of the price movement, we are looking for trading positions in the price pullback.
Bullish Setup :
Bearish Setup :
🔵 How to Use
After forming the setup, you can enter the trade using a pending order or after receiving confirmation. To increase the probability of success, you can adjust the pivot period market structure settings or modify the market movement coefficient in the formation leg of the FVG.
Bullish Setup :
Bearish Setup :
🔵 Setting
Pivot Period of Market Structure Detector :
This parameter allows you to configure the zigzag period based on pivots. Adjusting this helps in accurately detecting order blocks.
Show major Bullish ChoCh Lines :
You can toggle the visibility of the Demand Main Zone and "ChoCh" Origin, and customize their color as needed.
Show major Bearish ChoCh Lines :
Similar to the Demand Main Zone, you can control the visibility and color of the Supply Main Zone and "ChoCh" Origin.
FVG Detector Multiplier Factor :
This feature lets you adjust the size of the moves forming the Fair Value Gaps (FVGs) using the Average True Range (ATR). The default value is 1, suitable for identifying most setups. Adjust this value based on the specific symbol and market for optimal results.
FVG Validity Period :
This parameter defines the validity period of an FVG in terms of the number of candles. By default, an FVG remains valid for up to 15 candles, but you can adjust this period as needed.
Mitigation Level FVG :
This setting establishes the basic level of an FVG. When the price reaches this level, the FVG is considered mitigated.
Level in Low-Risk Zone :
This feature aims to reduce risk by dividing the FVG into two equal areas: "Premium" (upper area) and "Discount" (lower area). For lower risk, ensure that "Demand FVG" is in the "Discount" area and "Supply FVG" in the "Premium" area. This feature is off by default.
Show or Hide :
Given the potential abundance of setups, displaying all on the chart can be overwhelming. By default, only the last setup is shown, but you can enable the option to view all setups.
Alert Settings :
On / Off : Toggle alerts on or off.
Message Frequency : Determine how often alerts are triggered.
Options include :
"All" (alerts every time the function is called)
"Once Per Bar" (alerts only on the first call within the bar)
"Once Per Bar Close" (alerts only at the last script execution of the real-time bar upon closing)
The default setting is "Once Per Bar".
Show Alert Time by Time Zone : Set the alert time based on your preferred time zone, such as "UTC-4" for New York time. The default is "UTC".
Display More Info : Optionally show additional details like the price range of the order blocks and the date, hour, and minute in the alert message. Set this to "Off" if you prefer not to receive this information.

True Market Structure {DCAquant}
True Market Structure
Overview
The True Market Structure is a technical analysis tool designed for use across all timeframes. It identifies and visualizes market structure breaks (MSBs) and break of structure (BOS) events, emphasizing interim highs and lows using the "Deroz Wick" system. Unlike many other indicators, this tool does not rely on traditional pivot points, making it a unique addition to any trader's toolkit.
How It Works
The True Market Structure indicator uses a combination of algorithms to detect and highlight significant market structure events. By analyzing price action and identifying key levels, the indicator aids in understanding potential reversal points and trend continuations.
Bull and Bear Market Structures: Differentiates between bullish and bearish market structures, applying distinct color settings for easy visualization.
Customizable Settings: Users can tailor the indicator’s appearance and functionality to their preferences, including toggling lines, labels, and selecting between SWING and INTERIM MS settings.
How our market structure indicator is different
All known market structure indicators work with pivot points. This is a lookback function to find highs and lows within a certain period and then producing market structure.
Our indicator doesn't work like this as the DCAquant True Market Structure finds swing and interim lows and saves it into memory thus giving us the ability to create real market structure breaks and BOS’s.
This is achieved when an MSB or BOS is triggered the script will perform a check through its memory to find previous Interim or swing which ever setting the user has selected.
A saved interim or swing will never change unless it is broken giving you true market structure, this Indicator cannot repaint because it only produces breaks whenever candle is closed.
The next MSB or BOS you see on the chart are the direct function of saved memory points which gives clear indication of true market structure.
Almost 500 lines of code to give you True Market Structure usable on any timeframe.
Key Features
1. Market Structure Breaks (MSBs) and Break of Structure (BOS)
Market Structure Breaks (MSBs): Occur when the price breaks through a previous significant high or low, indicating a potential reversal or continuation of the current trend.
Break of Structure (BOS): Highlights significant breaks in market structure, providing insights into potential trend changes.
2. Visualization Options
Customizable colour settings for both bull and bear market structures, ensuring it integrates with any chart setup.
Options to enable or disable lines and labels for flexible information display.
3. The WICK System
Standard WICK System: Identifies wicks based on standard high/low calculations.
Deroz WICK System: Enhances the standard WICK system by looking back at price history and replacing the standard wick if an even lower or higher wick is found in the subsequent bar.
4. MS Settings
SWING Setting: Sets future MSB events at swing highs/lows, offering a broader market perspective.
INTERIM Setting: Sets future MSB events at interim highs/lows, providing more immediate and frequent market structure updates.
Understanding Market Structure
Market structure is defined by a series of price actions that form recognizable patterns indicating the current trend. Key elements include:
Higher Highs (HH) and Higher Lows (HL): Indicate an uptrend, where each successive high and low is higher than the previous one.
Lower Highs (LH) and Lower Lows (LL): Indicate a downtrend, where each successive high and low is lower than the previous one.
These patterns help traders identify trend direction and potential reversal points. In an uptrend, traders look for higher highs and higher lows to continue, whereas in a downtrend, they look for lower highs and lower lows.
Application in Breakout Trading
Market structure analysis is crucial for breakout trading, where traders seek to capitalize on significant price movements following a break of established price levels.
Uptrend Breakouts: Traders watch for breaks above higher highs as potential entry points for long positions.
Downtrend Breakouts: Traders watch for breaks below lower lows as potential entry points for short positions.
The True Market Structure indicator assists by visually marking these critical levels, simplifying the process of identifying and acting on breakout opportunities.
Visual Representation
Indicator Settings
Standard WICK vs. Deroz WICK System:
Standard WICK
Deroz WICK
SWING MSB
INTERIM MSB
Summary
The True Market Structure indicator provides a clear and detailed view of market structure changes. By highlighting key MSB and BOS events and incorporating advanced wick detection through the Deroz WICK system, this tool can aid in making informed decisions based on a thorough understanding of market dynamics. However DCAquant recommends using this indicator as part of a system.

SMC Pro+ ICT v4 Enhanced - FINAL🎯 SMC Pro+ ICT v4 Enhanced - Complete Smart Money Trading System📊 Professional All-in-One Indicator for Smart Money Concepts & ICT MethodologyThe SMC Pro+ ICT v4 Enhanced is a comprehensive trading system that combines Smart Money Concepts (SMC) with Inner Circle Trader (ICT) methodology. This indicator provides institutional-grade market structure analysis, liquidity mapping, and volume profiling in one powerful package.✨ CORE FEATURES🏗️ Advanced Market Structure Detection
MSS (Market Structure Shift) - Identifies major trend reversals with precision
BOS (Break of Structure) - Confirms trend continuation moves
CHoCH (Change of Character) - Detects internal structure shifts
Modern LuxAlgo-Style Lines - Clean, professional visualization
Dual Sensitivity System - External structure (major swings) + Internal structure (minor swings)
Customizable Labels - Tiny, Small, or Normal sizes
Structure Break Visualization - Clear break point markers
💎 Supply & Demand Zones (POI - Point of Interest)
Institutional Order Blocks - Where smart money enters/exits
ATR-Based Zone Sizing - Dynamically adjusted to market volatility
Smart Overlap Detection - Prevents cluttered charts
Historical Zone Tracking - Maintains up to 50 zones
POI Central Lines - Pinpoint entry/exit levels
Auto-Extension - Zones extend to current price
Auto-Cleanup - Removes broken zones automatically
📦 Fair Value Gap (FVG) Detection
Bullish & Bearish FVGs - Institutional inefficiencies
Consequent Encroachment (CE) - 50% fill levels
Auto-Delete Filled Gaps - Keeps charts clean
Customizable Lookback - 1-30 days of history
Color-Coded Zones - Easy visual identification
CE Line Styles - Dotted, Dashed, or Solid
🚀 Enhanced PVSRA Volume Analysis
This is one of the most powerful features:
200% Volume Candles - Extreme institutional activity (Lime/Red)
150% Volume Candles - High institutional interest (Blue/Fuchsia)
Volume Climax Detection - Major reversal signals with 2.5x+ volume
Exhaustion Signals - Identifies buying/selling exhaustion with high accuracy
Enhanced Volume Divergence - NEW! High-quality reversal detection
Price makes lower low, Volume makes higher low = Bullish Divergence
Price makes higher high, Volume makes lower high = Bearish Divergence
Strict trend context filtering for accuracy
Rising/Falling Volume Patterns - Momentum confirmation (allows 1 exception in 3 bars)
Volume Spread Analysis - Price range × Volume for true strength
Body/Wick Ratio Analysis - Candle structure quality
ATR Normalization - Adjusts for different market volatility
Volume Profile Indicators - 🔥 EXTREME, ⚡ VERY HIGH, 📈 HIGH, ✅ ABOVE AVG
💧 Advanced Liquidity System
Smart money targets these levels:
Weekly High/Low Liquidity - Major institutional targets
Daily High/Low Liquidity - Intraday key levels
4H Session Liquidity - Short-term targets
Distance Indicators - Shows % distance from current price
Strength Indicators - Identifies high-probability sweeps
Swept Level Detection - Tracks executed liquidity grabs
Customizable Line Styles - Width, length, offset controls
Color-Coded Levels - Easy visual hierarchy
🎯 Master Bias System
Data-driven directional bias with 9-factor scoring:
Bull/Bear Bias Calculation - 0-100% scoring system
Multi-Timeframe Analysis - Daily, 4H, 1H trend alignment
Kill Zone Integration - London (2-5 AM) & NY (8-11 AM) sessions
EMA Alignment Factor - Trend confirmation
Volume Confirmation - Adds 5% when volume supports direction
Range Filter Integration - Adds 10% for trending markets
Session Context - Above/below session midpoint scoring
Bias Strength Rating - STRONG (>75%), MODERATE (60-75%), WEAK (<60%)
Real-Time Updates - Dynamic recalculation
📈 Premium & Discount Zones
Fibonacci-based institutional pricing:
Extreme Premium - Above 78.6% (Overvalued)
Premium Zone - 61.8% - 78.6% (Expensive)
Equilibrium - 38.2% - 61.8% (Fair Value)
Discount Zone - 21.4% - 38.2% (Cheap)
Extreme Discount - Below 21.4% (Undervalued)
Visual Zone Boxes - Color-coded for instant recognition
200-500 Bar Lookback - Customizable range calculation
🔄 Range Filter
Advanced trend detection:
Smoothed Range Calculation - Eliminates noise
Dynamic Support/Resistance - Auto-adjusting levels
Upward/Downward Counters - Measures trend strength
Color-Coded Line - Green (uptrend), Red (downtrend), Orange (ranging)
Adjustable Period - 1-200 bars
Multiplier Control - Fine-tune sensitivity (0.1-10.0)
🌊 Liquidity Zones (Vector Zones)
PVSRA-based horizontal liquidity:
Above Price Zones - Resistance clusters
Below Price Zones - Support clusters
Maximum 500 Zones - Professional-grade capacity
Body/Wick Definition - Choose zone boundaries
Auto-Cleanup - Removes cleared zones
Color Override - Custom styling options
Transparency Control - 0-100% opacity
📊 EMA System
Triple EMA trend confirmation:
Fast EMA (9) - Green line - Immediate trend
Medium EMA (21) - Blue line - Short-term trend
Slow EMA (50) - Red line - Major trend
EMA Alignment Detection - Bull/Bear stack confirmation
Dashboard Integration - Status: 📈 BULL ALIGN, 📉 BEAR ALIGN, 🔀 MIXED
Adjustable Lengths - Customize all three EMAs (5-200)
🎯 IDM (Institutional Decision Maker) Levels
Key institutional price levels:
Latest IDM Detection - 20-bar pivot lookback
Extended Lines - Projects 50 bars into future
Customizable Styles - Solid, Dashed, or Dotted
Line Width Control - 1-5 pixels
Color Selection - Match your chart theme
Price Label - Shows exact level with tick precision
📱 Professional Dashboard
Real-time market intelligence panel:
🎯 SIGNAL - 🟢 LONG, 🔴 SHORT, ⏳ WAIT, 🛑 NO TRADE
🎲 BIAS - Bull/Bear with STRONG/MODERATE/WEAK rating
📊 BULL/BEAR Scores - 0-100% percentage display
💎 ZONE - Current premium/discount location
🕐 KZ - Kill Zone status (🇬🇧 LONDON/🇺🇸 NY/⏸️ OFF)
🏗️ STRUCT - Market structure status (BULLISH/BEARISH/NEUTRAL)
⚡ EVENT - Last structure event (MSS/BOS)
⚡ INT - Internal structure trend
🎯 IDM - Latest institutional level
📊 EMA - EMA alignment status
🔄 RF - Range Filter direction
📊 PVSRA - Volume status (🚀 CLIMAX/📈 RISING/📉 FALLING)
📅 MTF - Multi-timeframe alignment (✅ FULL/⚠️ PARTIAL/❌ CONFLICT)
💪 CONF - Confidence score (0-100%)
📊 VOL - Volume ratio (e.g., 1.8x average)
Advanced Metrics (Toggle On/Off):
📏 RSI - Value + Status (OVERBOUGHT/STRONG/NEUTRAL/WEAK/OVERSOLD)
📈 MACD - Value + Direction (BULL/BEAR)
🌪️ VOL - Volatility state (⚠️ EXTREME/🔥 HIGH/📊 NORMAL/😴 LOW)
🔊 VOL PROF - Volume profile ratio
⏱️ TF - Current timeframe
Dashboard Customization:
4 Positions - Top Left, Top Right, Bottom Left, Bottom Right
3 Sizes - Small, Normal, Large
2 Modes - Compact (MTF combined) or Full (separate rows)
Professional Design - Dark theme with color-coded cells
🎮 TRADING SIGNALS & SETUP SCORING🟢 LONG Setup Requirements (9-Factor Confidence Score)
MTF Alignment - Daily/4H/1H/Structure all bullish (+2 points for full, +1 for partial)
Volume Confirmation - Above 1.2x average (+1 point)
Structure Event - MSS or BOS bullish (+2 points)
EMA Alignment - 9 > 21 > 50 (+1 point)
Kill Zone Active - London/NY + Bull bias >75% (+2 points)
Bias Match - Master bias matches structure trend (+1 point)
Confidence Threshold - >60% minimum for signal
🔴 SHORT Setup Requirements
Same 9-factor system but inverted for bearish conditions.💪 Confidence Levels
75-100% - ⭐ HIGH CONFIDENCE (Strong setup, all factors aligned)
50-74% - ⚠️ MODERATE (Good setup, partial alignment)
0-49% - ❌ LOW CONFIDENCE (Wait for better setup)
🎯 Signal Output
🟢 LONG - Bull bias + Bullish structure + >60% confidence
🔴 SHORT - Bear bias + Bearish structure + >60% confidence
⏳ WAIT LONG - Bull bias but low confidence
⏳ WAIT SHORT - Bear bias but low confidence
🛑 NO TRADE - Neutral bias or conflicting signals
🔔 COMPREHENSIVE ALERT SYSTEM (12 Alerts)Structure Alerts
⚡ MSS Bullish - Major bullish reversal
⚡ MSS Bearish - Major bearish reversal
📈 BOS Bullish - Bullish continuation
📉 BOS Bearish - Bearish continuation
⚠️ CHoCH Bullish - Internal bullish shift
⚠️ CHoCH Bearish - Internal bearish shift
Bias & Confidence Alerts
🟢 Bias Shift Bull - Master bias turns bullish
🔴 Bias Shift Bear - Master bias turns bearish
⭐ High Confidence - Setup reaches 75%+ confidence
Volume Alerts (High Probability)
🚀 Volume Climax Buy - Extreme bullish volume spike
💥 Volume Climax Sell - Extreme bearish volume spike
⚠️ Selling Exhaustion - Potential bullish reversal
⚠️ Buying Exhaustion - Potential bearish reversal
📊 Bullish Volume Divergence - High-quality bullish reversal signal
📊 Bearish Volume Divergence - High-quality bearish reversal signal
🎨 EXTENSIVE CUSTOMIZATIONColors & Styling
✅ All colors customizable for every component
✅ Supply/Demand zone colors + outlines
✅ FVG colors (bullish/bearish)
✅ PVSRA candle colors (6 types)
✅ Liquidity level colors (Weekly/Daily/4H/Swept)
✅ Structure line colors
✅ Premium/Equilibrium/Discount zone colorsDisplay Controls
✅ Toggle each feature on/off independently
✅ Adjustable sensitivities (Structure: 5-30, Internal: 3-15)
✅ Label size controls (Tiny/Small/Normal)
✅ Line width adjustments (1-5 pixels)
✅ Transparency controls (0-100%)
✅ Extension lengths (20-100 bars)
✅ Lookback periods (50-500 bars)Volume Settings
✅ PVSRA symbol override (trade one asset, analyze another)
✅ Climax threshold (2.0-5.0x)
✅ Rising volume bar count (2-5 bars)
✅ Divergence filters (Strict/Lenient)
✅ Divergence minimum bars (10-30)
✅ Volume threshold multiplier (1.0-2.0x)Dashboard Settings
✅ Position (4 corners)
✅ Size (Small/Normal/Large)
✅ Compact/Full mode
✅ Show/Hide advanced metrics
✅ Show/Hide EMA status💡 BEST PRACTICES & USAGE TIPS⏰ Optimal Timeframes
Scalping - 1m, 5m (Use Kill Zones, Volume Climax, FVG)
Day Trading - 5m, 15m, 1H (Use Structure, Liquidity, Bias)
Swing Trading - 4H, Daily (Use MTF, Premium/Discount, Structure)
Position Trading - Daily, Weekly (Use major structure, liquidity)
🎯 Asset Classes
✅ Forex - All pairs (especially majors during Kill Zones)
✅ Crypto - BTC, ETH, altcoins (24/7 liquidity)
✅ Stocks - All stocks and indices (use session times)
✅ Commodities - Gold, Silver, Oil (high volume periods)
✅ Indices - S&P 500, NASDAQ, DAX, etc.🔥 High-Probability Setups
The Perfect Storm
MSS in direction of daily trend
Kill Zone active
Volume climax
Confidence >75%
Price in discount (long) or premium (short)
Volume Divergence Play
Enhanced volume divergence signal
CHoCH confirms direction change
Price near liquidity level
FVG forms for entry
Liquidity Sweep
Price sweeps weekly/daily high/low
Immediate rejection (selling/buying exhaustion)
Structure shift (MSS)
Volume confirmation
Structure Retest
BOS breaks structure
Price returns to POI/FVG
Volume confirms (>1.2x)
Kill Zone active
📊 Multi-Timeframe Analysis
Higher Timeframe - Identify trend & structure (Daily/4H)
Trading Timeframe - Find entries (15m/1H)
Lower Timeframe - Precise entries (1m/5m)
Look for MTF alignment - Dashboard shows ✅ FULL or ⚠️ PARTIAL
⚠️ Risk Management
Always use stop-loss (below/above recent structure)
Position size: 1-2% risk per trade
Target liquidity levels for take profit
Use supply/demand zones for SL placement
Watch for exhaustion signals near targets
