Megalodon Pro Bollinger Scalper SetUpIt is designed to find scalping opportunities. It combines Megalodon Pro Bollinger Band Calculator and another momentum tool to enter and exit positions.
Usage
Follow the green and red color changes to buy and sell, respectively. You may also set your alarms and start automate your trading via alarms.
Settings
Setting 1 defines buy below level for Bollinger Band Calculator.
Setting 2 defines sell above level for Bollinger Band Calculator.
Enlightening the modern investors
~Bo Bugra Sukas
Use the links below at the signature part to get access to these indicators.
ค้นหาในสคริปต์สำหรับ "BOS"

Megalodon Pro ScalperIt is designed to find scalping opportunities. It combines Megalodon Pro Shorter Term Trader and another momentum tool to enter and exit positions.
Usage
Follow the green and red color changes to buy and sell, respectively. You may also set your alarms and start automate your trading via alarms.
Settings
Setting 1 defines the trend. Possible options are up, down, sideways. Default: "Sideways"
Setting 2 defines how many bars to wait for looking for a momentum buy or sell signal after a buying opportunity has been found in Megalodon Pro Shorter Term Trader to enter or exit. Default: 16 bars to look after
Setting 3 defines time frame to look for a buy and sell signal. This setting is used for setting up alarms. Default: 15 bars
Enlightening the modern investors
~Bo Bugra Sukas
Use the links below at the signature part to get access to these indicators.

Trade System Crypto InvestidorTrade System created to facilitate the visualization of crossing and extensions of the movements with Bollinger bands.
Composed by:
Moving Averages of 21, 50, 100 and 200.
Exponential Moving Averages: 17,34,72,144, 200 and 610.
Bollinger bands with standard deviation 2 and 3.
How it works?
The indicators work together, however there are some important cross-averages that need to be identified.
- Crossing the MA21 with 50, 100 and 200 up or down will dictate an up or down trend.
- MA200 and EMA200 are excellent indicators of resistance and support zone, if the price is above these averages it will be a great support, if the price is below these averages it will indicate strong resistance.
- Another important crossover refers to exponential moving averages of 17 to 72 indicates a possible start of a trend
- The crossing of the exponential moving average of 34 with 144 will confirm the crossing mentioned above.
- In addition, the exponential moving average of 610 used by Bo Williams is an excellent reference for dictating an upward or downward trend, if the price is above it it will possibly confirm an upward trend and the downside.
- To conclude we have bollinger bands with standard deviation 2 and 3, they help to identify the maximum movements.

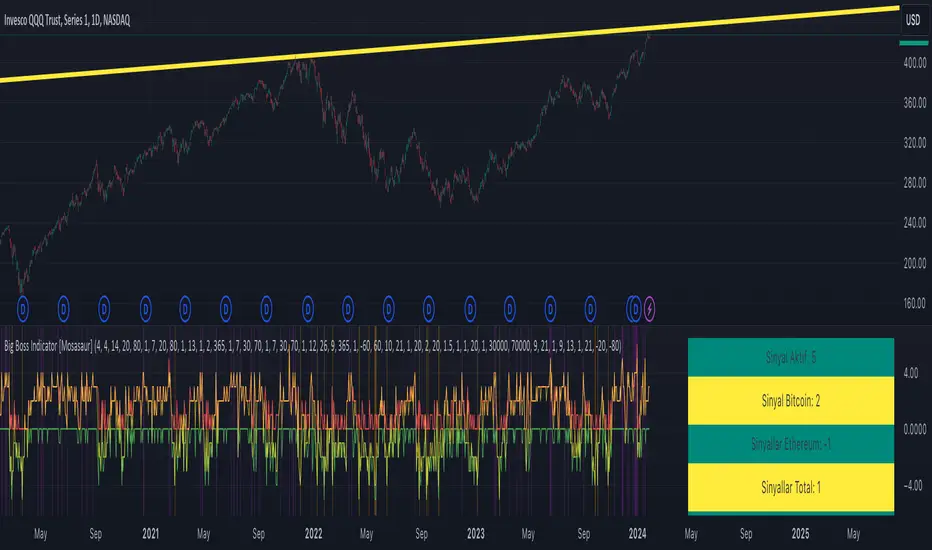
Megalodon Pro Advance Data CalculatorIt is designed to combine price, volume and indicator data from different brokers/exchanges. This helps us to have a more accurate data, so that we can have a better picture of the price/volume/indicators.
Features
It may combine up to 18 different data sources.
It can print indicators such as MFI, RSI, OBV, BB, Williams%R. If you have any suggestions, write them in the comment section below.
Usage
Just select the data points you would like to combine in the setting to view price, volume or indicators data.
Settings
Setting 1 defines the source you would like to use to view Only Price information.
Setting 2 defines the indicator you would like to print. OnlyPrice is the default setting which views the source information defined.
Setting 3 defines the length for RSI.
Setting 4 defines the length for MFI.
Setting 5 defines the length for Bollinger Band(BB).
Setting 6 defines the Bollinger Bands' standard deviation.
Setting 7 defines the length for Williams%R.
I hope you will find some VALUE $
~Bo
Enlightening the modern investors
Bullish_CandleStick_FormationsÇeşitli Boğa Mum Formasyonlarını yukarı mavi ok ile gösteren komut. İstediğiniz formasyonu ayarlardan seçebilirsiniz.

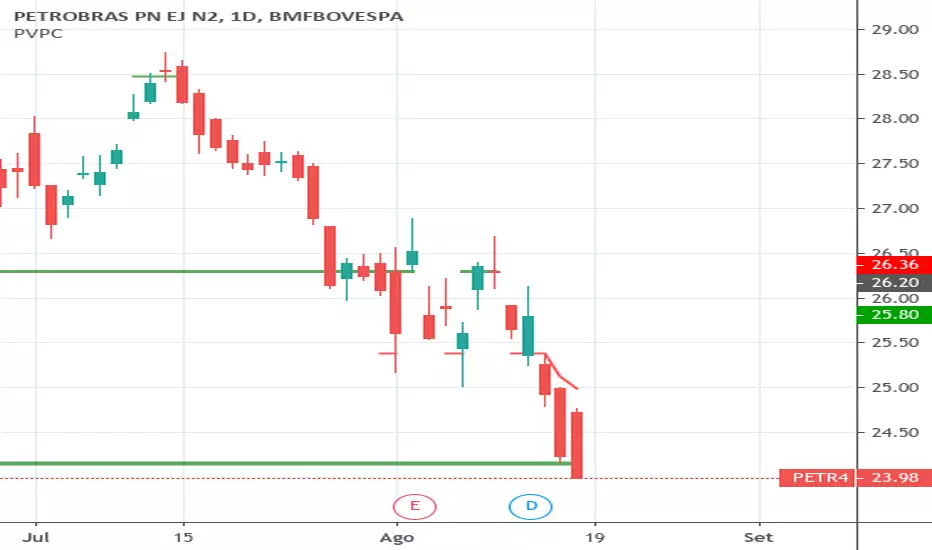
PhiBOIndicador de Bo Williams usando no PhiCube. Três canais de Donchian, pintados no gráfico somente quando podem indicar tendência. Apresentam níveis importantes de resistência e suporte em tendência.

yutas_BOindicator_β1Ver1.0
High-low sign indicator for binary option only. (β version)
バイナリーオプション専用ハイローサインインジケーター。 (ベータバージョン)

yutas_BOindicator4βver.1.0
High-low sign indicator for binary option only. (sample version)
バイナリーオプション専用ハイローサインインジケーター。 (お試し用)

Moving Average 300 by WM - Bitcoin reversal key ?Bonjour à tous, c'est un grand plaisir que nous ajoutons le MA 300 à votre boîte à outils ce qui à mon avis pourrait constituer un support essentiel pour la tendance BTC dans un proche avenir. Nous pensons qu'il serait possible que le Bitcoin puisse mettre un terme à la tendance baissière en l'effleurant :-) Historiquement le Bitcoin n'a jamais descendu sous la barre du MA 200. Je vous souhaite de connaître beaucoup de succès lors de vos prochaines transactions et n'oubliez pas la tendance est votre amis!! Crypto Mercy xx
WM
We are movement

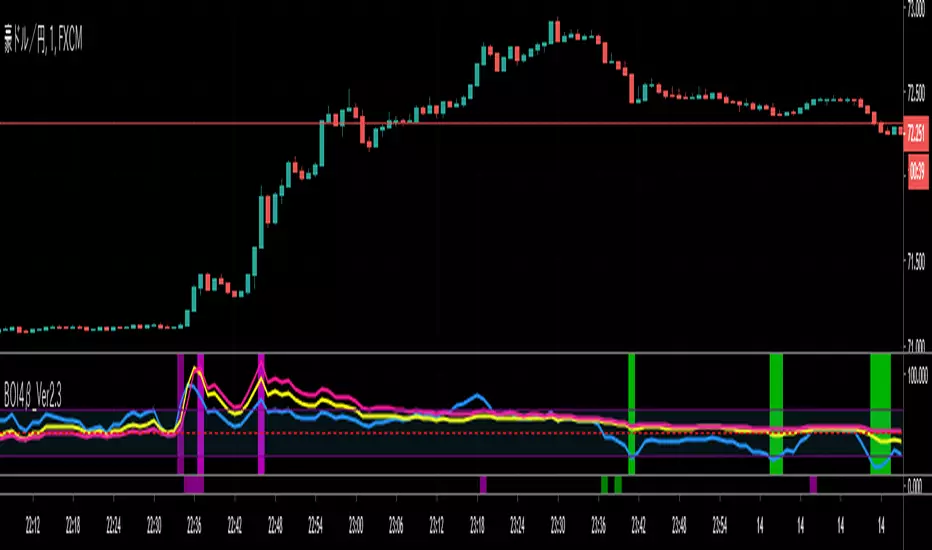
yutas_BOindicatorVer .1.0
High-low sign indicator for binary option only.
バイナリーオプション専用ハイローサインインジケーター。

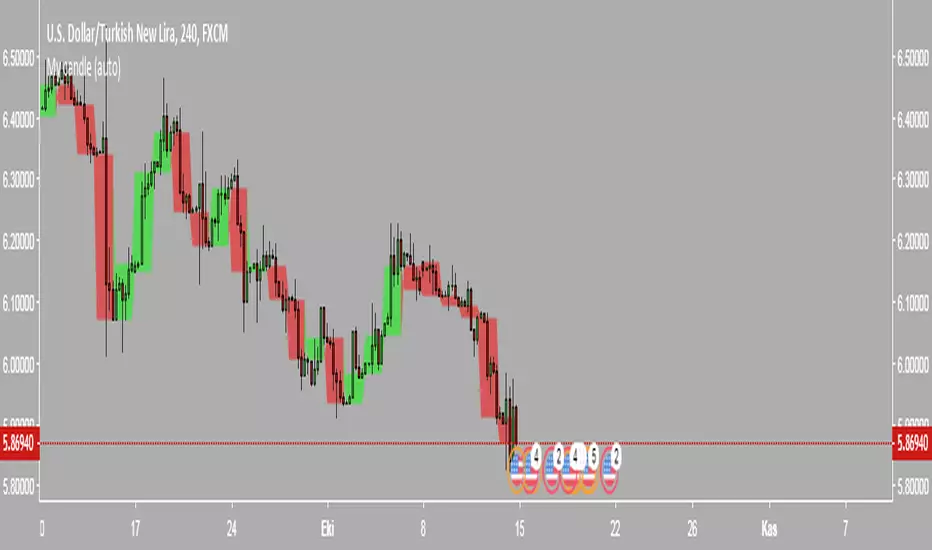
My candleBu gösterge programın bir parçası ...
Bu sayede MetaTrader 4'te kullandığım göstergeleri kağıt ticareti ve ticaret görünümü için değiştirmeye karar verdim.
Bu göstergelerin yazılması arasında bir boşluk olabilir.
Bu göstergeler ücretsiz ve her zaman ücretsizdir.
Her ne sebeple olursa olsun, bu göstergelerin kaynakları gizli kalacaktır.
Bu endekslerin önceki basımlarını yazmış olabilecek arkadaşların çabaları sayesinde
Ayrıca, daha iyi ve daha başarılı bir işbirliği sunan arkadaşlar.
Haydi gidelim ...
İlk gösterge çok zamanlı bir göstergedir
Hangi şimdiki zamanda daha yüksek kez görmenizi sağlar.
Önceki sürümlerde, birkaç sorun vardı.
// mumun boyutu yüksekten düşüğe doğruydu! ve belki de gösterge göstergesine ihtiyacım var!
// otomatik bir değişiklik yapamazsınız!
// günlüklerden daha az zamanlar kullanamazsınız.
Bu endekslerin Trader adında bir sanatçı tarafından tek yol olduğunu unutmayınız !!!
Bu yüzden endekslerle çalışma sanatını öğreniz.
Sonunda, zayıf Turkce dolayı özür dilemeliyim
Bu çeviri Google Çeviri ile yapıldığı için.
#İyi şanslar#
3 Moving Average ExponentialSince I noticed there was no Script with actually 3 EMA together (all the ones I found said it was Exponential, but actually was Simple), i created this one.
The lengths, 17 72 305, are based on the phi cube theory, introduced by Bo Williams. The slow length (305) indicate a likely strong support/resistance and the region between the fast and medium lengths (17, 72) indicate where the price tends to return after a boost or little diversion from the price average.

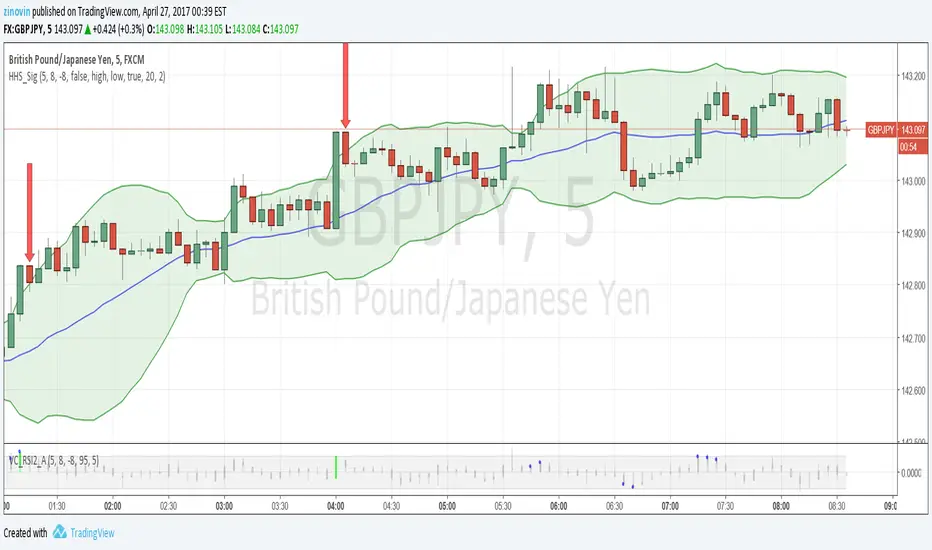
Hubba Hubba Style SignalsThe indicator shows signals for "Hubba Hubba Style" strategy (binary options). It is the best to use one with "Value Chart and RSI2 with Alert" indicator. I recommend to use TF5 and expiration time till 5 min.
Also HHS_Sig can show Bollinger Bands, Resistance and support lines based on William's fractals
Stoch_VX4 Expiry / UpdateStoch_VX3 Update
Stoch crossover +
Fast stoch / Tops & bottoms
BO background expiry

