Logger Library For Pinescript (Logging and Debugging)Library "LoggerLib"
This is a logging library for Pinescript. It is aimed to help developers testing and debugging scripts with a simple to use logger function.
Pinescript lacks a native logging implementation. This library would be helpful to mitigate this insufficiency.
This library uses table to print outputs into its view. It is simple, customizable and robust.
You can start using it's .log() method just like any other logging method in other languages.
//////////////////
USAGE
//////////////////
-- Recommended: Please Read The Documentation From Source Code Below. It Is Much More Readable There And Will Be Updated Along With Newer Versions. --
Importing the Library
---------------------
import paragjyoti2012/LoggerLib/ as Logger
.init() : Initializes the library and returns the logger pointer. (Later will be used as a function parameter)
.initTable: Initializes the Table View for the Logger and returns the table id. (Later will be used as a function parameter)
parameters:
logger: The logger pointer got from .init()
max_rows_count: Number of Rows to display in the Logger Table (default is 10)
offset: The offset value for the rows (Used for scrolling the view)
position: Position of the Table View
Values could be:
left
right
top-right
(default is left)
size: Font Size of content
Values could be:
small
normal
large
(default is small)
hide_date: Whether to hide the Date/Time column in the Logger (default is false)
returns: Table
example usage of .initTable()
import paragjyoti2012/LoggerLib/1 as Logger
var logger=Logger.init()
var logTable=Logger.initTable(logger, max_rows_count=20, offset=0, position="top-right")
-------------------
LOGGING
-------------------
.log() : Logging Method
params: (string message, |string| logger, table table_id, string type="message")
logger: pass the logger pointer from .init()
table_id: pass the table pointer from .initTable()
message: The message to log
type: Type of the log message
Values could be:
message
warning
error
info
success
(default is message)
returns: void
///////////////////////////////////////
Full Boilerplate For Using In Indicator
///////////////////////////////////////
P.S: Change the | (pipe) character into square brackets while using in script (or copy it from the source code instead)
offset=input.int(0,"Offset",minval=0)
size=input.string("small","Font Size",options=|"normal","small","large"|)
rows=input.int(15,"No Of Rows")
position=input.string("left","Position",options=|"left","right","top-right"|)
hide_date=input.bool(false,"Hide Time")
import paragjyoti2012/LoggerLib/1 as Logger
var logger=Logger.init()
var logTable=Logger.initTable(logger,rows,offset,position,size,hide_date)
rsi=ta.rsi(close,14)
|macd,signal,hist|=ta.macd(close,12,26,9)
if(ta.crossunder(close,34000))
Logger.log("Dropped Below 34000",logger,logTable,"warning")
if(ta.crossunder(close,35000))
Logger.log("Dropped Below 35000",logger,logTable)
if(ta.crossover(close,38000))
Logger.log("Crossed 38000",logger,logTable,"info")
if(ta.crossunder(rsi,20))
Logger.log("RSI Below 20",logger,logTable,"error")
if(ta.crossover(macd,signal))
Logger.log("Macd Crossed Over Signal",logger,logTable)
if(ta.crossover(rsi,80))
Logger.log("RSI Above 80",logger,logTable,"success")
////////////////////////////
// For Scrolling the Table View
////////////////////////////
There is a subtle way of achieving nice scrolling behaviour for the Table view. Open the input properties panel for the table/indicator. Focus on the input field for "Offset", once it's focused, you could use your mouse scroll wheel to increment/decrement the offset values; It will smoothly scroll the Logger Table Rows as well.
/////////////////////
For any assistance using this library or reporting issues, please write in the comment section below.
I will try my best to guide you and update the library. Thanks :)
/////////////////////
ค้นหาในสคริปต์สำหรับ "3500亿美元是多少人民币"

Indicators & Conditions Test Framework [DTU]Hello All,
This script is a framework to build strategies by combining indicators and conditions (long, short, exits). You are able to analyze your strategies in realtime by changing the input parameters related to indicators, conditions and their combinations.
OVERVIEW
With this Study/Strategy framework, you will be able to create strategy conditions, display them on the chart, and test them using existing indicators as well as external and custom indicators that you can add.
The main purpose of the Framework is to choose your indicators to be used in the conditions and test your strategy by producing your "Long, short, Exit long, Exit short" combinations.
Although may be, it can be a bit difficult and complicated at first start, but you can understand the logic on its use in a very short time.
Notes:
I removed external links off descriptive images and video to be comply with Trading view violation House Rules
Since I am new in the community and still trying to understand the pine script language I can make errors and violations on my script. Please Inform me on any issue that I made..
HOW TO
STEP 1: SETTINGS ______________________________________________________________________________________________________
SOURCE, TIMEFRAME, SECURITY
Select the Source, timeframe and Secure type that your indicators will use.
Here, the Secure entry consists of 3 parts and the f_security function is used to determine it.
a)Secure
This option is defined as reducing repaint in tradingview calculations as much as possible. The following function is used.
request.security(_symbol, _res, _src , lookahead=barmerge.lookahead_on)
b)Semi Secure
While this option can reduce repaint in tradingview calculations as much as possible, it is less secure. The following function is used.
request.security(_symbol, _res, _src )
c)Repaint
This option turns on the repaint feature. The following function is used.
request.security(_symbol, _res, _src ) : na
Ind Source:
You can the source that indicators will use their own calculations
Ext Source:
You can import external Indicator sources from here . It appears on condition/combination area as "EXT".
To export the External indicator plot it with a title. It will be visible in source dropdown input
PERIOD , ALERTS...
Period:
Determine your strategy testing period by selecting start and end date/time
(!!! According to your tradingview subscription, it takes the last 5000, 10000.. bars.
The extra bar option may cause problems such as not appearing in the calculations or errors).
Plot Alerts:
Plot condition result as alerts arrows on the chart's bottom for "LONG" and the top for "SHORT" entries, exits
Close on opposite:
When selected, a long entry gets closed when a short entry opens and vice versa
Show Profit:
It appears if script is in strategy mode (not in study) this can display current or open profit for better reanalyzing your strategy entry exit points. (Currently under development)
PLOT TYPE OPERATIONS
This option has 4 entries
a) Mult
Sets the multiplier for the selected Plot Type (stochastic, Percentrank, Org Range (-1,1) ) except for "Original" in the range (-1,1).
EXAMPLE: When 1000 is selected, the indicator in the range of (-1,1) will appear in the range of (-1000, 1000) on the screen.
b) Shift
It determines the shift that will appear on the screen for the selected Plot Type (stochastic, Percentrank,Org Range (-1,1) ) in the range (-1,1) other than "Original".
EXAMPLE: When Shift:35000 and mult:1000 are selected, the indicator will appear in the range (34000, 36000) on the screen.
c) Smooth
This option (only for Stochastic & PercentRank) allows to smooth the indicator to be displayed.
Here, tradinview ta.swma function is used.
b) hline
Adjusts the horizontal lines to appear on the screen according to the mult factor for the range (-1,1)
The lines represent the values (-1, -05, 0, 05, 1)
STEP 2: INDICATORS ______________________________________________________________________________________________________
You need to choose indicators that you can use in strategy conditions.
Here, the indicators come from the dturkuler/lib_Indicators_DT open script library defined in the code
In addition, you can add the indicators that you will create in the area defined in the code to this list..
You can also import external indicators and test them with other variables on the system..
You can choose a maximum of 5 indicators that you can use in total. (can be increased in new versions)
Indicators are categorized in 3 main sections
Indicator Selection:
You can select your indicators from this area
a)Moving Averages
These are indicators such as EMA, SMA that you can show on the stock. They come from the library.
These indicators are fed from Settings/source. Only the length value can be used as a parameter.
In addition, line colors can be changed..
As of now, there are 28 indicators in the library in total and 5 indicators are left as future use for this field for now.
b)Other Indicators
These are different indicators from the stock value such as RSI, COG. They come from the library. These indicators are fed from Settings/source.
Only the length value can be used as a parameter. In addition, line colors can be changed.
As of now, there are 24 indicators in the library in total and 5 indicators are left as a future use for this field for now.
c)Custom Indicators
These indicators are the ones you can create by programming yourself in the source code..
The area at the bottom of the settings screen is reserved for the parameters of this type of indicators.
Indicator Length:
You can update your selected indicator length value from here. (Not: it doesn't work for custom indicators since they have their parameter on cust. Ind. input screen )
Indicator Plot Type:
Next to the indicators, there is an input selection field about how they will be displayed on the screen.
a)Original
The indicator is displayed on the screen with its current values. It is an ideal solution for displaying moving average indicators such as (EMA, SMA) over current stock.
Since the values of indicators such as (RSI, COB) are low (-100,100 : -1.1), they appear at the bottom of the screen and make analysis difficult.
For this reason, other options may be more suitable for these.
b)Stochastic
The indicator is displayed on the screen with stochastic calculation in the range of -1.1.
It uses the stochastic(50) calculation method to spread indicators such as (RSI, COB) over the range (-1,1).
Indicators in this selection can be fixed and monitored under stock on the screen with the parameters under the Plot Type section.
You can see the original values of the relevant indicator on the Data Window screen.
(!!! Do not use the values on the chart in your condition calculations. Instead, get the values from Data Window)
c)PercentRank
The indicator is displayed on the screen with stochastic calculation in the range of -1.1. .
Since the values of indicators such as (RSI, COB) are low (-100,100 : -1.1), they appear at the bottom of the screen and make analysis difficult.
Indicators in this selection can be fixed and monitored under stock on the screen with the parameters under the Plot Type section.
You can see the original values of the relevant indicator on the Data Window screen
((!!! Do not use the values on the chart in your condition calculations. Instead, get the values from Data Window)
d)Org Range (-1,1)
If your indicator is in the range of -1.1, your indicator will be displayed on the screen with its original calculation in the range of -1.1.
Indicators in this selection can be fixed and monitored under stock on the screen with the parameters under the Plot Type section.
You can see the original values of the relevant indicator on the Data Window screen.
(!!! Do not use the values on the chart in your fitness calculations. Instead, get the values from Data Window)
STEP 2 NOTES:
STEP 3: CONDITIONS ______________________________________________________________________________________________________
After choosing the indicators you will use in the conditions, you move on to the "CONDITIONS" section.
There are 4 conditions type here.
• LONG ENTRY CONDITION
• SHORT ENTRY CONDITION
• LONG CLOSE CONDITION
• SHORT CLOSE CONDITION
The use of each condition is the same.
There are 3 combinations you can use in each condition. (can be increased in new versions)
a)COMBINATIONS
There are 3 combinations you can use in each condition. (can be increased in new versions)
Each combination are build from 4 parts
1)1st Indicator
If set to "NONE" this combination will not be used on calculations. You can select
IND1-5: from indicators (See above),
EXT: value from externally imported indicator
Stock built-in values: close, open...
2)Operator
Selected Operator compares 1st Indicator with the 2nd one. You can select different operators such as
crossover, crossunder, cross,>,<,=....
3)2nd Indicator
This indicator will be compared with the 1st one via selected Operator. You can select
IND1-5: from indicators (See above),
VALUE: a float value defined in the combinations value parameter
EXT: value from externally imported indicator
Stock builtin values: close,open...
4)Value
When the 2nd indicator field is "VALUE", value area compares the entered value.
ex: 1st indicator="open", op=">", 2nd indicator="VALUE", value=3000.12 means is(close>3000.12)
In other conditions, it compares the previous values of the indicator.
ex: 1st indicator="open", op=">" 2nd indicator is "close" and value is 2 means is(open>close )
EXAMPLES:
indicator 1= "IND1", Operator=">", indicator 2= "IND2" => is(IND1>IND2)
indicator 1= "IND1", Operator=">", indicator 2= "VALUE", "0.1" => is(IND1>0.9)
indicator 1= "IND2", Operator="crossover", indicator 2= "IND1" => is(IND2 crossover IND1) : like a=ta.crossover(IND2, IND1)
indicator 1= "IND1", Operator="<", indicator 2= "close" => is(IND1>close)
indicator 1= "IND1", Operator="<", indicator 2= "EXT" => is(IND1>EXT) , EXT mean external imported indicator that define on settings section
indicator 1= "IND1", Operator="<", indicator 2= "IND1", Value="1" => is (IND1>IND1 )
b)JOIN COMBINATIONS
Each combination in Condition is compared with the next one via JOIN operator
The join operator can be selected as AND or OR.
Examples:
1st combination= is(IND1>0.9) true
2nd combination= is(IND2 crossover IND1) false
1st combination "AND" 2ndcombination" => false (is(IND1>0.9) AND is(IND2 crossover IND1))
1st combination "OR" 2nd combination" => true (is(IND1>0.9) OR is(IND2 crossover IND1))
STEP 3 NOTES:
When the 2nd indicator field is "VALUE", value area compares the entered value. In other conditions, it compares the previous values of the indicator.
In cases where "VALUE" is not selected, integer values must be entered in this field. (float should not be entered. ie 1, 2 should be entered)
!!!If the 1st indicator is "NONE" in the combination, that combination is cancelled.
Each combination returns true/false, allowing the selected value to be compared with another value
Example: EMA(21)>EMA(50) returns true under all conditions or (EMA(21) crossover EMA(50)) returns true when passed.
You can use , Value of 5 indicators (IND1-IND5) or (VALUE) that you have defined in combinations or import indicator (EXT) or stock values (close, open, high...) in your calculations.
combination Compares the 1st indicator with 2nd indicator via the operator.
STEP 4: CUSTOM INDICATORS ______________________________________________________________________________________________________
There is an area in the code for designing Custom Indicators.
Here you can design your own indicators and use them in the framework.
You can also create unlimited parameters for your indicators in the SETTINGS custom indicator field.
For now, only 3 Custom indicators have been defined.
Examples are entered in the code for custom indicators.
STEP 4 NOTES:
Including / updating custom to the code is explained in the source code
• LIMITATIONS:
!!! According to your tradingview subscription, it takes the last 5000, 10000.. bars. More bar options may cause problems such as not appearing in the calculations or errors.
• RAMBLINGS:
• NOTES [ /i]
This Script can be used as an indicator if the last strategy parts in the code are commented out and converted to the initial strategy study.
It was originally prepared for my use with my own strategy framework and has export functions accordingly.
When integrated to my own strategy framework it brings many more features over strategy definition of trades.
• TODO [ /i]
TODO: Add tooltips to the settings screen
TODO: Add double triple, Quatr factor for all indicators (convert any indicator to factor2-4 facotr. ex: EMA to DEMA, TEMA, QEMA...)
TODO: Add factorized Fibo avg range indicator (good for trend definition and entry exit points)
TODO: Add bands to the indicator and conditions
TODO: Add debug window for exporting indicator's parameters
TODO: Add isRising(value) isFalling(value), is...(value) .... to combinations (they can be used as custom indicator also
TODO: Reassess condition entry screen for user friendly GUI
TODO: Increase # conditions from 3 to 4
TODO: Reassess strategy entries, exit and close (should be improved)
TODO: Add Alerts, Condiional alerts for indicator (study) part
TODO: Create export function v3 for Pinecoders Indicator framework
• THANKS:
For Pine script format docs RicardoSantos .
For Pine script coding standards Pinecoders .
For moving average script used on library s RodrigoKazuma .

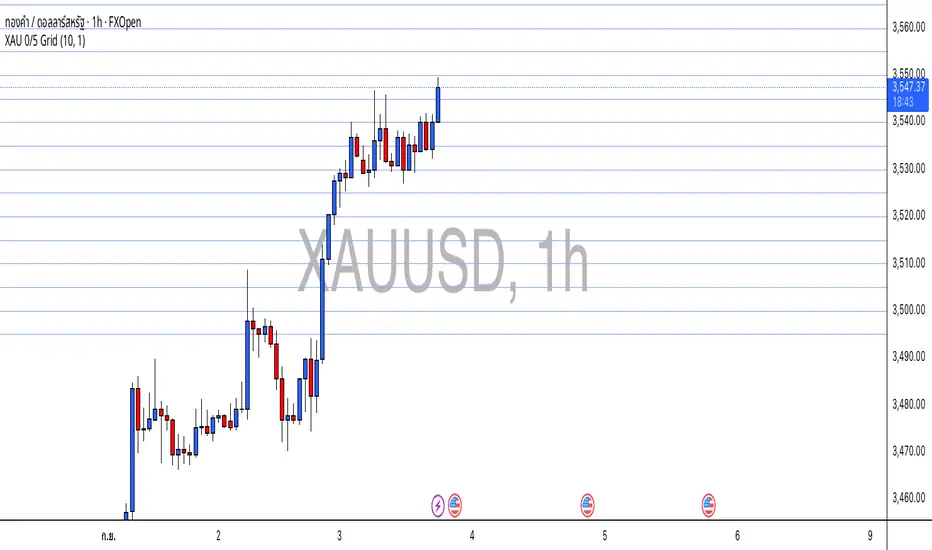
XAU 0/5 GridThis indicator draws horizontal price grids for XAUUSD. It anchors the grid to a base price that ends with 0 or 5, then plots equally spaced levels every 5 price units above and below that base. It’s a clean way to eyeball fixed-interval structure for rough support/resistance zones and simple TP/SL planning.
How it works
Base (0/5):
base = floor(close / 5) × 5 → forces the base to always end with 0/5.
Grid levels:
level_i = base + i × 5, where i is any integer (positive/negative).
The script updates positions only when the base changes to avoid flicker and reduce chart load.
It uses a persistent line array to manage the line objects efficiently.
Usage
Add the indicator to an XAUUSD chart on any timeframe.
Configure in the panel:
Show Lines – toggle visibility
Lines each side – number of lines above/below the base
Line Color / Line Width – appearance
Use the grid as fixed reference levels (e.g., 3490, 3495, 3500, 3505, …) for planning TP/SL or observing grid breaks.
Highlights
Strict 0/5 anchoring keeps levels evenly spaced and easy to read on gold.
Auto-reanchors when price moves to a new 0/5 zone, maintaining a steady view.
Lightweight design: lines are created once and then updated, minimizing overhead.
Limitations
Visualization only — not a buy/sell signal.
Spacing is fixed at 5 price units, optimized for XAUUSD. If used on other symbols/brokers with different tick scales, adjust the logic accordingly.
Grid lines do not guarantee support/resistance; always combine with broader market context.
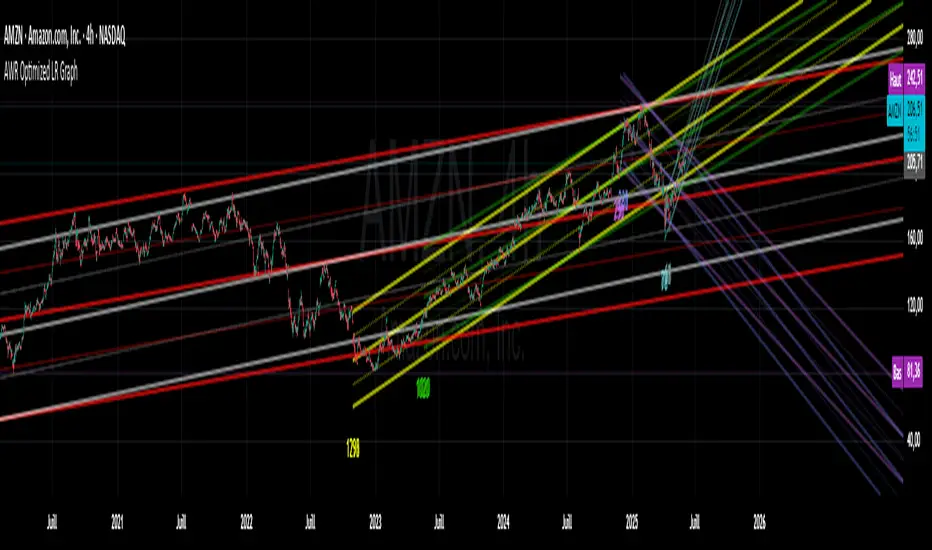
AWR Optimized LR GraphHello Trading Viewers !
Drawing linear regression channels at the best place and for many periods can be time consuming.
In the library, I've found some indicators that draw 1 or 2 but based on fixed number of bars or a duration...
Not always relevant, that's why I decide to create this indicator.
It calculates 8 linear regression channels according to 8 differents configurable periods.
Each time, the indicator will calculate for each specified duration range the best linear regression line & channel (2 standard regressions) for that period and then plot it on the graph.
You can settle how many linear regression channels you want to display.
For period, defaults configurations (number of candles studied) are :
Period 1
min1 = 33
max1 = 66
Period 2
min2 = 67
max2 = 128
Period 3
min3 = 129
max3 = 255
Period 4
min4 = 256
max4 = 510
Period 5
min5 = 511
max5 = 1020
Period 6
min6 = 1021
max6 = 2040
Period 7
min7 = 2041
max7 = 3500
Period 8
min8 = 3501
max8 = 4999
This default settings provide short-term, mid term, long term and a very long-term view.
You have to go back on the chart to display the channels that start on previous period that are currently not on the screen.
You can set a specific color for each linear regression channels.
The linear regression line is based on the least squares method, meaning: it calculates along each period the gap between a linear & the price & squarred it. Then it defines the linear in order to have always the least distance between price and the linear.
The more the price deviates from its regression line, the more statistically likely it is to return to its regression line.
Application of Regression Lines in Trading
Regression lines are widely used in trading and financial analysis to understand market trends and make informed predictions. Here are some key applications:
1. Trend Identification – Traders use regression lines to visualize the general direction of a stock or asset price, helping to confirm an upward or downward trend.
2. Price Predictions – Linear regression models assist in estimating future price movements based on historical data, allowing traders to anticipate changes.
3. Risk Assessment – By analyzing the slope and variation of a regression line, traders can gauge market volatility and potential risks.
4. Support and Resistance Levels – Regression channels help traders identify support and resistance zones, providing insight into optimal entry and exit points in a trend.
5. You can also use the short period linear regression channels vs the long period linear regression channels to identify important pivot points.
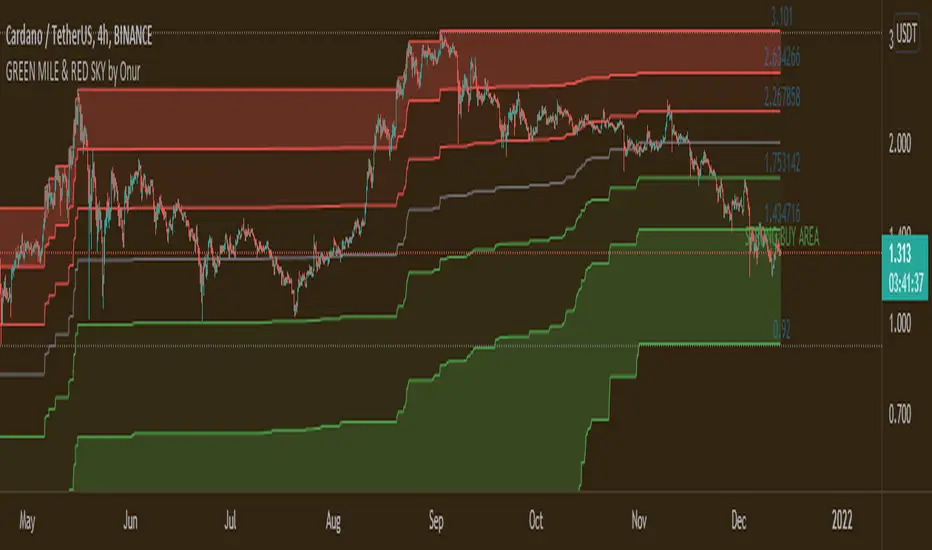
GREEN MILE & RED SKY by OnurThis indicator is the upgrated version of "GREEN MILE by Onur". Indicator shows fibonacci buying + selling levels due to the past 3500 (adjustable and 1500 by default) candles. Prices in the dark green area is a strong buying signal. Prices in the dark red areas is strong selling signal
Decreasing period value makes indicator effective from long term to short term.
Works harmoniously with MACD & RSI indicators.