CL Daily Bitcoin Volume (All exchange included, even Mt.GOX)This daily volume data contains collective total from
____________________________________________________
Historical:
BTC-e BTC/USD (From Q3 2011 to Q3 2016)
BTCChina BTC/CNY (From Q3 2011 to Q2 2017)
Coinsetter BTC/USD (From Q3 2014 to Q1 2016)
MtGox BTC/USD (From July 2010 - 2014 only))
OKcoin International BTC/USD (From Q3 2014 to Q2 2017)
____________________________________________________
Institutions:
CME Bitcoin Futures
Grayscale Bitcoin Trust OTC
____________________________________________________
Spot exchanges:
Bitfinex BTC/USD
Bitstamp BTC/USD
Coinbase BTC/USD
Coinbase BTC/EUR
Binance BTC/USDT
Binance BTC/USDC
Binance BTC/PAX
Gemini BTC/USD
itBit BTC/USD
Kraken BTC/EUR
Kraken BTC/USD
Huobi BTC/USDT
Korbit BTC/KRW
Bitflyer BTC/JPY
____________________________________________________
Others:
Bitmex
ค้นหาในสคริปต์สำหรับ "2010年+黄金价格+历史数据"

Combo Backtest 123 Reversal & Bandpass FilterThis is combo strategies for get
a cumulative signal. Result signal will return 1 if two strategies
is long, -1 if all strategies is short and 0 if signals of strategies is not equal.
First strategy
This System was created from the Book "How I Tripled My Money In The
Futures Market" by Ulf Jensen, Page 183. This is reverse type of strategies.
The strategy buys at market, if close price is higher than the previous close
during 2 days and the meaning of 9-days Stochastic Slow Oscillator is lower than 50.
The strategy sells at market, if close price is lower than the previous close price
during 2 days and the meaning of 9-days Stochastic Fast Oscillator is higher than 50.
Second strategy
The related article is copyrighted material from
Stocks & Commodities Mar 2010
You can use in the xPrice any series: Open, High, Low, Close, HL2, HLC3, OHLC4 and ect...
WARNING:
- For purpose educate only
- This script to change bars colors.

Combo Strategy 123 Reversal & Bandpass Filter This is combo strategies for get
a cumulative signal. Result signal will return 1 if two strategies
is long, -1 if all strategies is short and 0 if signals of strategies is not equal.
First strategy
This System was created from the Book "How I Tripled My Money In The
Futures Market" by Ulf Jensen, Page 183. This is reverse type of strategies.
The strategy buys at market, if close price is higher than the previous close
during 2 days and the meaning of 9-days Stochastic Slow Oscillator is lower than 50.
The strategy sells at market, if close price is lower than the previous close price
during 2 days and the meaning of 9-days Stochastic Fast Oscillator is higher than 50.
Second strategy
The related article is copyrighted material from
Stocks & Commodities Mar 2010
You can use in the xPrice any series: Open, High, Low, Close, HL2, HLC3, OHLC4 and ect...
WARNING:
- For purpose educate only
- This script to change bars colors.

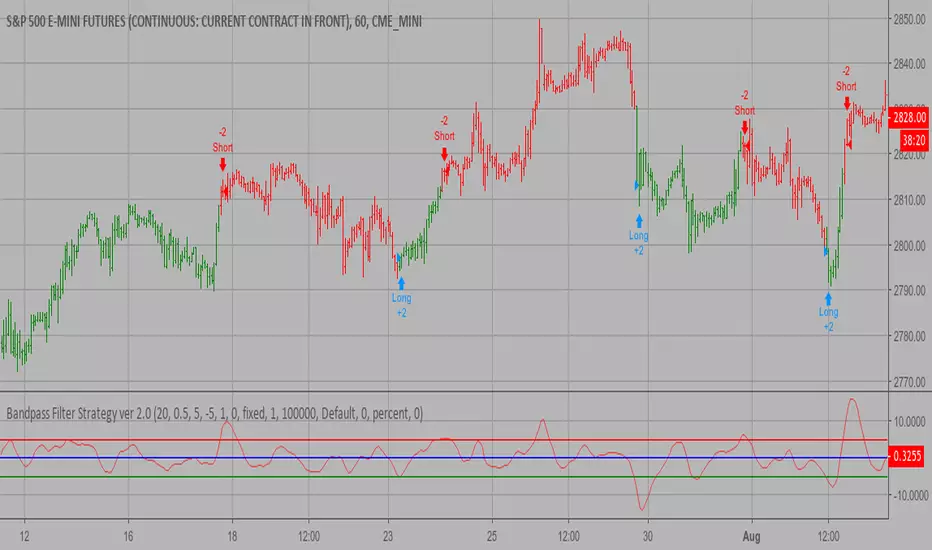
Bandpass Filter Strategy ver 2.0 The related article is copyrighted material from
Stocks & Commodities Mar 2010
You can use in the xPrice any series: Open, High, Low, Close, HL2, HLC3, OHLC4 and ect...
You can change long to short in the Input Settings
WARNING:
- For purpose educate only
- This script to change bars colors.
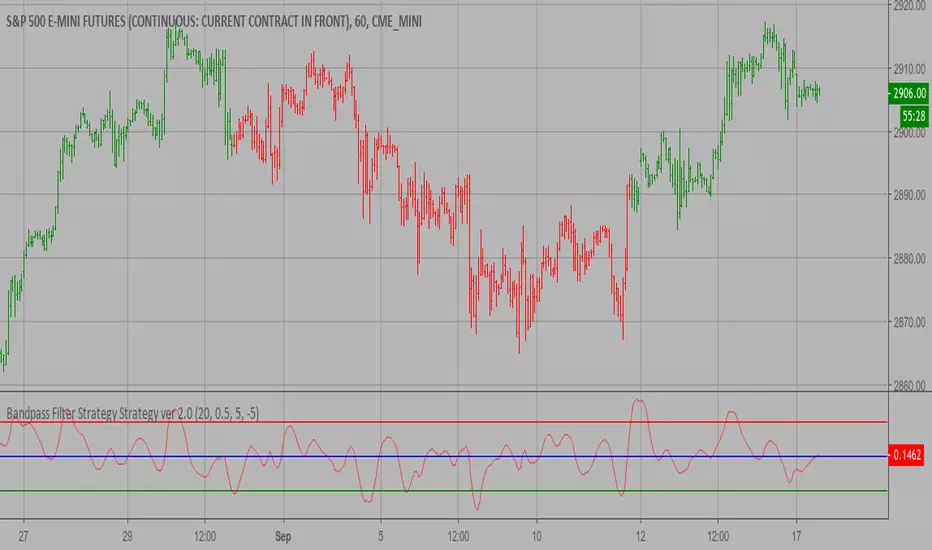
Bandpass Filter Strategy ver 2.0 The related article is copyrighted material from
Stocks & Commodities Mar 2010
You can use in the xPrice any series: Open, High, Low, Close, HL2, HLC3, OHLC4 and ect...
WARNING:
- This script to change bars colors.
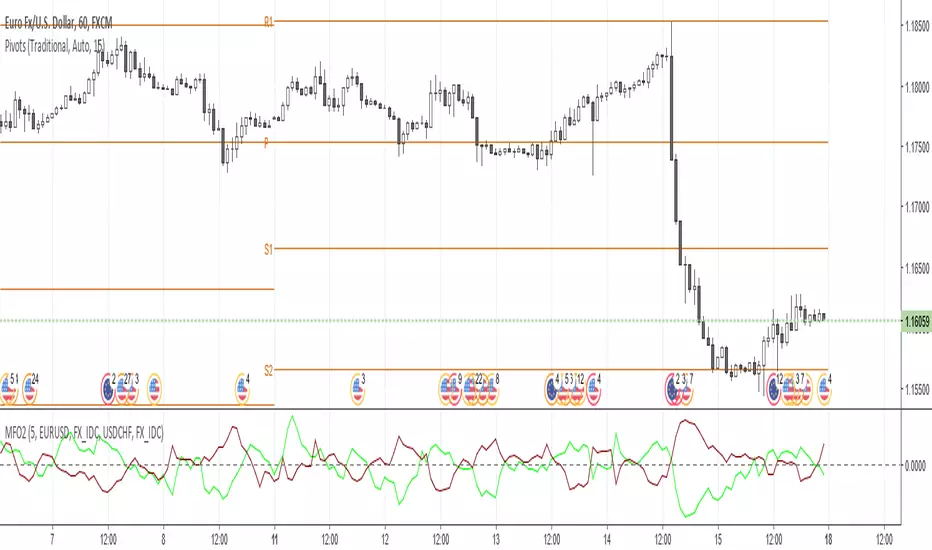
Money Flow Oscillator 2A volume indicator that measures buying and selling pressure over a given lookback period.
As described at traders.com
See also:
- Are price updates a good proxy for actual traded volume in FX?
- Using Tick Volume in Forex: A Clear NVO Based Example
B3 Clear Method Candle PainterThis is translated out of Technical Analysis of Stocks & Commodities, September 2010, (I take zero design credit). The script simply looks for the price action to break or "clear" the most recent action, and only changes the paintbar color if the action indeed clears the previous candles. Simple to use, just add to your chart from your favorites and change the colors in the UI. It does the rest.
Trend via K.I.S.S. ~ B3

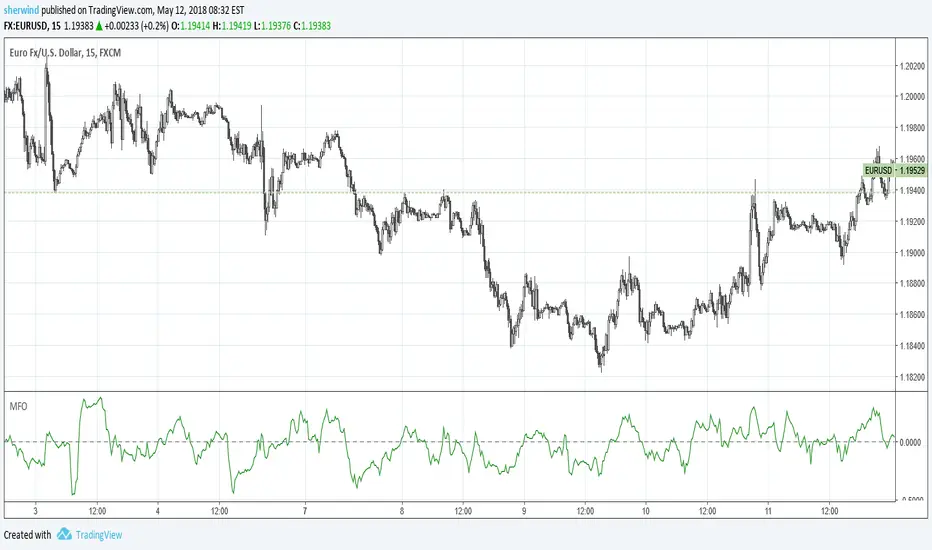
Money Flow OscillatorMeasures buying and selling pressure over a given lookback period.
As described at traders.com
See also:
- Are price updates a good proxy for actual traded volume in FX?
- Using Tick Volume in Forex: A Clear NVO Based Example
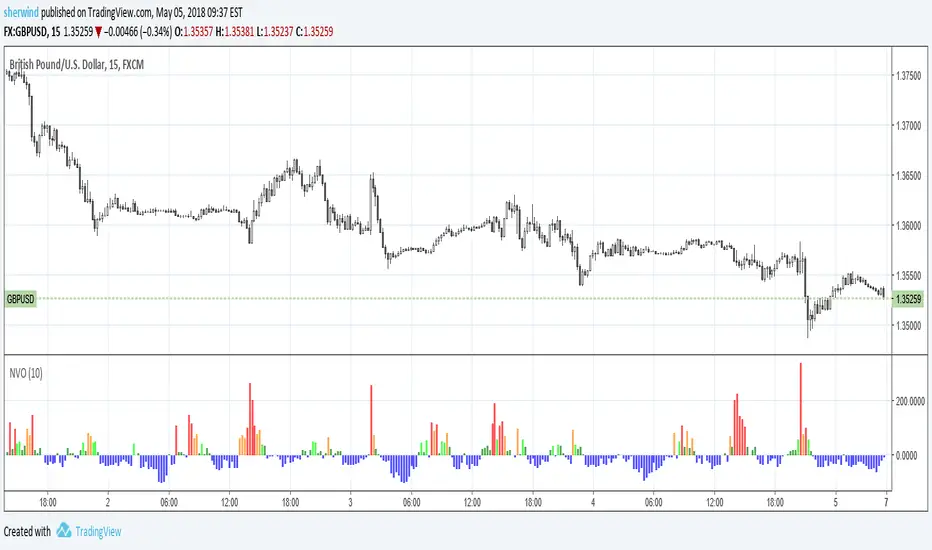
Normalized Volume OscillatorThis volume indicator works best on comparatively small timeframes (15 minutes, for example).
Based on:
- Normalized Volume Oscillator - indicator for MetaTrader 4
- Using Tick Volume in Forex: A Clear NVO Based Example
See also:
- Are price updates a good proxy for actual traded volume in FX?
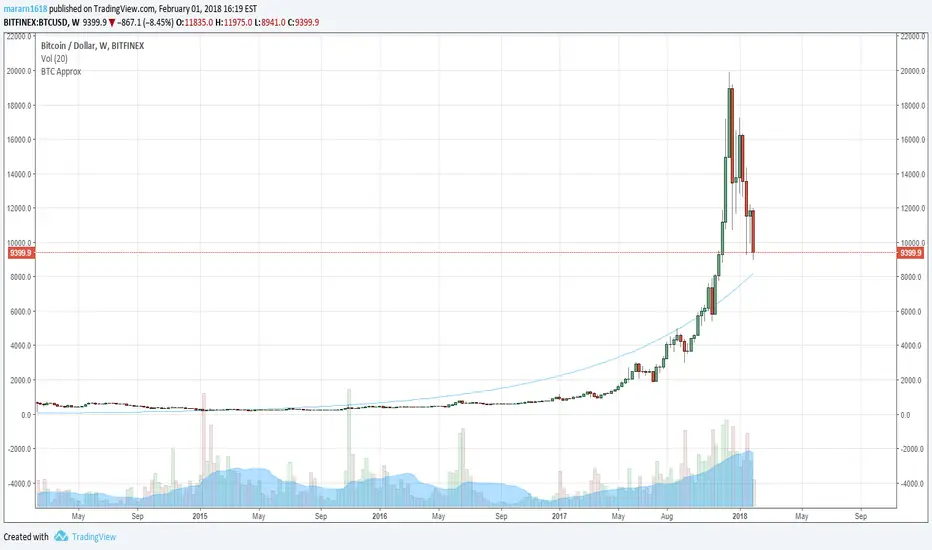
BTC Approximation (BETI) - Bitcoin Exponential Trend//based on
//https://www.wolframalpha.com/input/?i=e+%5E+(+0.00331836433279664++(+number+of+seconds+since+jul+17,+2010+12pm+UTC%2F86400%2Fseconds+)+-0.120774828196607+)
//https://bitcointalk.org/index.php?topic=470453.680

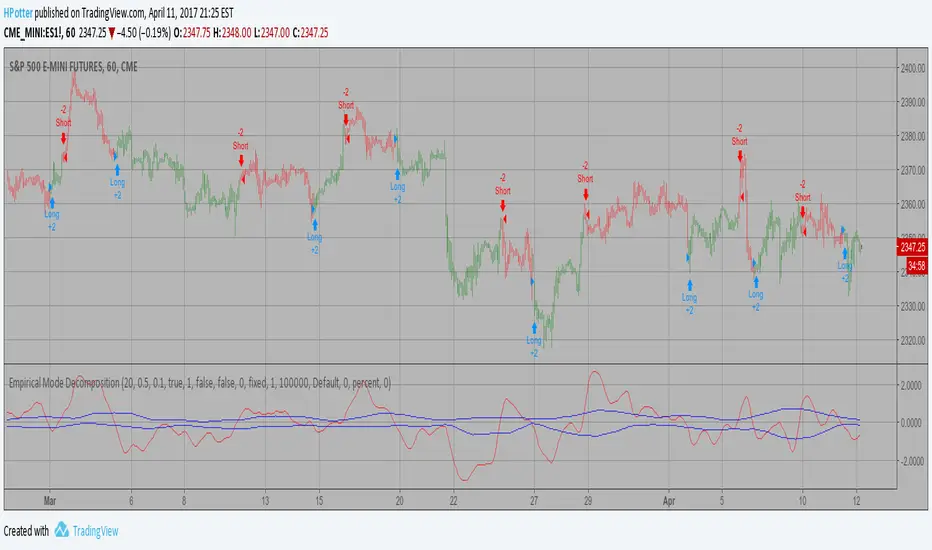
Empirical Mode Decomposition Strategy Backtest The related article is copyrighted material from Stocks & Commodities Mar 2010
You can use in the xPrice any series: Open, High, Low, Close, HL2, HLC3, OHLC4 and ect...
You can change long to short in the Input Settings
Please, use it only for learning or paper trading. Do not for real trading.
Empirical Mode Decomposition Strategy The related article is copyrighted material from Stocks & Commodities Mar 2010
You can use in the xPrice any series: Open, High, Low, Close, HL2, HLC3, OHLC4 and ect...

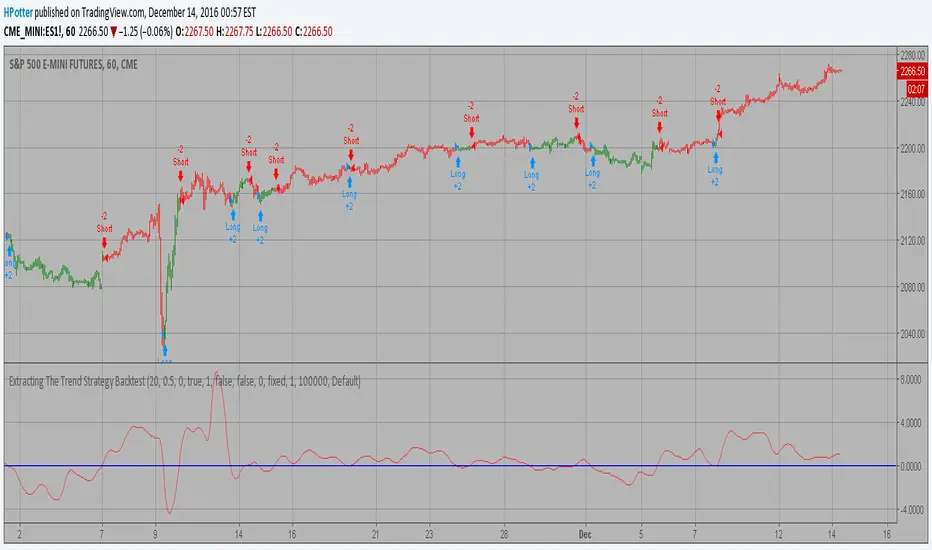
Extracting The Trend Strategy Backtest The related article is copyrighted material from Stocks & Commodities Mar 2010
You can use in the xPrice any series: Open, High, Low, Close, HL2, HLC3, OHLC4 and ect...
You can change long to short in the Input Settings
Please, use it only for learning or paper trading. Do not for real trading.
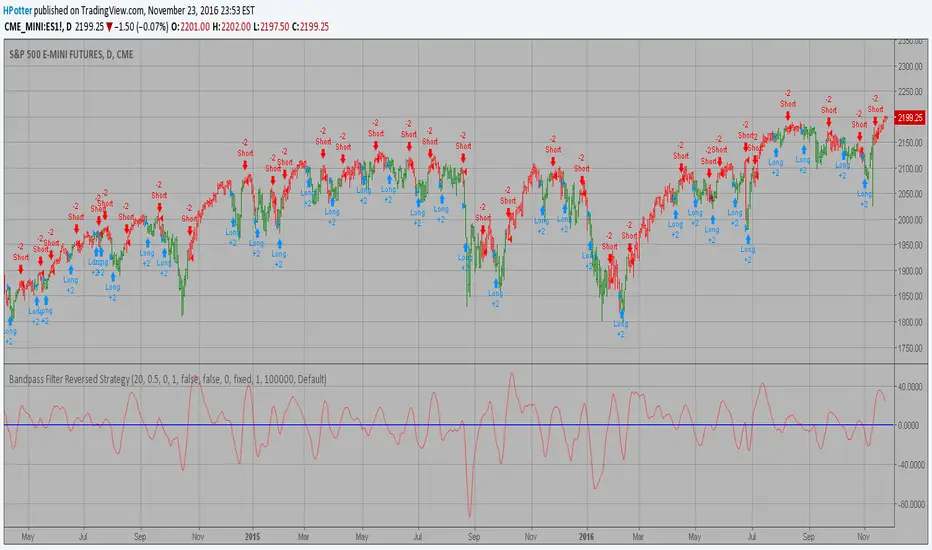
Bandpass Filter Reversed Strategy BacktestThe related article is copyrighted material from
Stocks & Commodities Mar 2010
You can use in the xPrice any series: Open, High, Low, Close, HL2, HLC3, OHLC4 and ect...
Please, use it only for learning or paper trading. Do not for real trading.
Fractal Adaptive Moving AverageSettings:
FRAMA: blue line, SC = 252, FC = 40, length = 252
EMA: orange line, length = 50
FRAMA seems to be the evolution of the current and much-used EMA. The basic strategy is simple: long if the price crosses up the line, short or exit if vice versa.
The main difference between EMA and FRAMA is that the first one seems to lag much more than the first one, as we can see from the chart below (crude oil daily chart)
FYI
etfhq.com
quantstrattrader.wordpress.com

Madrid Trend SqueezeThis study spots the points that are most profitable in the trend with a code color and shape. This also shows trend divergences and possible reversal or reentry points
Keeping the parameters simple, this study only needs one parameter, the length of the base moving average, which by default is set to 34.
There are seven colors used for the study
Green : Uptrend in general
Lime : Spots the current uptrend leg
Aqua : The maximum profitability of the leg in a long trade
The Squeeze happens when Green+Lime+Aqua are aligned (the larger the values the better)
Maroon : Downtrend in general
Red : Spots the current downtrend leg
Fuchsia: The maximum profitability of the leg in a short trade
The Squeeze happens when Maroon+Red+Fuchsia are aligned (the larger the values the better)
Yellow : The trend has come to a pause and it is either a reversal warning or a continuation. These are the entry, re-entry or closing position points.
When either the fuchsia or the aqua colors disappear or shrinks meaningfully it could mean a possible leg exhaustion that will have to be confirmed with the subsequent bars.
When the squeeze color appears without the intermediate color (fuchsia+yellow, fuchsia+maroon, aqua+yellow, aqua+green) it could mean this is just a shake off move, a pump/dump move, a buy the dip or a sell the peak move or a gap.
In the example there are three divergences spotted, the first one between march 2009 and september 2010 when the peaks in the indicator made a lower low, meanwhile the price made a higher high, this is a negative divergence and a trend reversal. On the second example, between april 2013 and July 2013 the indicator made a higher high meanwhile the price made a double bottom, this is a positive divergence and a reversal to the upside.

Fibonacci WavesFirst of all, ignore all other lines in the example chart except the four FAT lines. The four fat lines are the ones that define the fibonacci price leves. The lines have different extension offset to the right. The shortest one is the end of the second wave ( or leg B ), the next one is the end of C, the one following that is the end of D and the final one is the end of the final leg E.
The two input parameters is the start of A and the end of A.
If the start of A is larger than then end of A, the calculated series is a downward trend, else it is an upward trend.
Calculation based on old EWT simple wave expansion by fibonacci sequence.
0.618, 1.618, 0.382
Based on this source:
www.ino.com
Best Regards,
/Hull, 2015.05.20.15:50 ( placera.se )

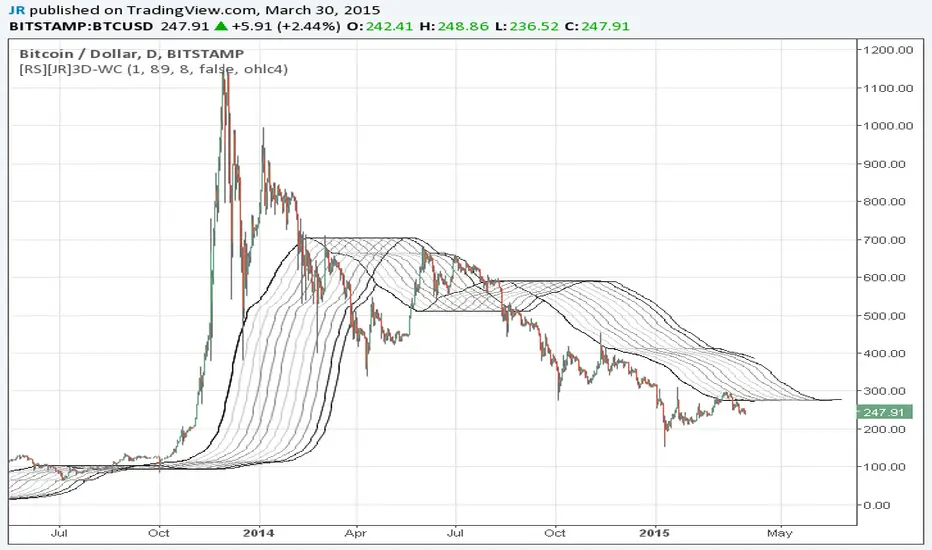
Wave Channel 3D Wave Channel 3D
Built by Ricardo idea from JR & Aloakdutt from indieTrades Jan. 2010
This indicator is very easy to build. We utilize Moving Averages with a set multiplier and an offset. Specially we try to use Fibonacci sequence series numbers (1, 2, 3, 5, 8, 13, 21, 34, 55, 89, 144...) as time space and multiplier (default 89, 8). Also included is Donchian Channel to locate strong trends and possible future support - resistance.
Examples of support/resistance on chart.
Dominant Price Trends
Future Support Resistance
Comparing Fibonacci Series Time Space - Multiplier
When Comparing make note of confluence support/resistance showing up with Fibonacci Series
Example uses DC
When Comparing make note of confluence support/resistance showing up with Fibonacci Series
Example without DC / Smooth MA
Extracting The Trend Strategy The related article is copyrighted material from Stocks & Commodities Mar 2010
You can use in the xPrice any series: Open, High, Low, Close, HL2, HLC3, OHLC4 and ect...

Extracting The Trend The related article is copyrighted material from Stocks & Commodities Mar 2010
You can use in the xPrice any series: Open, High, Low, Close, HL2, HLC3, OHLC4 and ect...

Empirical Mode Decomposition The related article is copyrighted material from Stocks & Commodities Mar 2010
You can use in the xPrice any series: Open, High, Low, Close, HL2, HLC3, OHLC4 and ect...

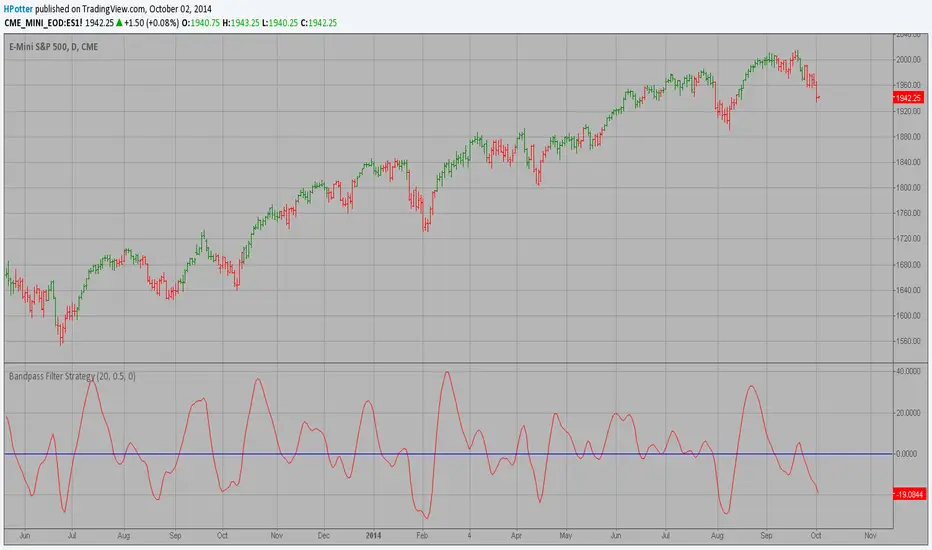
Bandpass Filter Strategy The related article is copyrighted material from
Stocks & Commodities Mar 2010
You can use in the xPrice any series: Open, High, Low, Close, HL2, HLC3, OHLC4 and ect...