DatasetWeatherTokyoMeanAirTemperatureLibrary "DatasetWeatherTokyoMeanAirTemperature"
Provides a data set of the monthly mean air temperature (°C) for the city of Tokyo in Japan.
this was just for fun, no financial implications in this.
reference:
www.data.jma.go.jp
TOKYO WMO Station ID:47662 Lat 35o41.5'N Lon 139o45.0'E
year_()
the years of the data set.
Returns: array : year values.
january()
the january values of the dataset
Returns: array\ : data values for january.
february()
the february values of the dataset
Returns: array\ : data values for february.
march()
the march values of the dataset
Returns: array\ : data values for march.
april()
the april values of the dataset
Returns: array\ : data values for april.
may()
the may values of the dataset
Returns: array\ : data values for may.
june()
the june values of the dataset
Returns: array\ : data values for june.
july()
the july values of the dataset
Returns: array\ : data values for july.
august()
the august values of the dataset
Returns: array\ : data values for august.
september()
the september values of the dataset
Returns: array\ : data values for september.
october()
the october values of the dataset
Returns: array\ : data values for october.
november()
the november values of the dataset
Returns: array\ : data values for november.
december()
the december values of the dataset
Returns: array\ : data values for december.
annual()
the annual values of the dataset
Returns: array\ : data values for annual.
select_month(idx)
get the temperature values for a specific month.
Parameters:
idx : int, month index (1 -> 12 | any other value returns annual average values).
Returns: array\ : data values for selected month.
select_value(year_, month_)
get the temperature value of a specified year and month.
Parameters:
year_ : int, year value.
month_ : int, month index (1 -> 12 | any other value returns annual average values).
Returns: float : value of specified year and month.
diff_to_median(month_)
the difference of the month air temperature (ºC) to the median of the sample.
Parameters:
month_ : int, month index (1 -> 12 | any other value returns annual average values).
Returns: float : difference of current month to median in (Cº)
ค้นหาในสคริปต์สำหรับ "12月4号是什么星座"

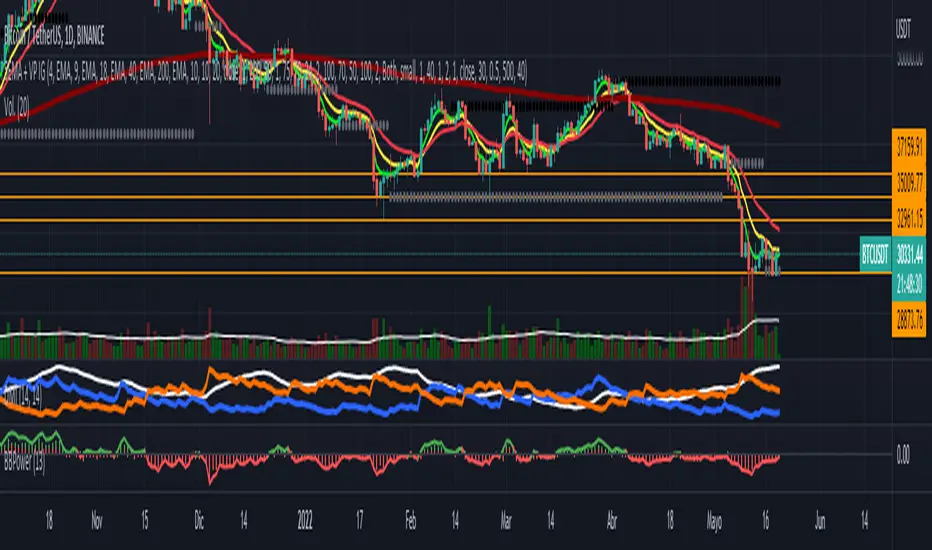
5EMA + VP IGHola Divinis
En una villa nació, fue deseo de Dios
Crecer y sobrevivir a la humilde expresión
Enfrentar la adversidad
Con afán de ganarse a cada paso la vida
En un potrero forjó una zurda inmortal
Con experiencia, sedienta ambición de llegar
De cebollita, soñaba jugar un Mundial
Y consagrarse en Primera
Tal vez jugando pudiera a su familia ayudar
A poco que debutó (Maradó, Maradó)
La 12 fue quien coreó (Maradó, Maradó)
Su sueño tenía una estrella
Llena de gol y gambetas
Y todo el pueblo cantó (Maradó, Maradó)
Nació la mano de Dios (Maradó, Maradó)
Llenó alegría en el pueblo
Regó de gloria este suelo
Carga una cruz en los hombros por ser el mejor
Por no venderse jamás, al poder enfrentó
Curiosa debilidad, si Jesús tropezó
¿Por qué él no habría de hacerlo?
La fama le presentó una blanca mujer
De misterioso sabor y prohibido placer
Que lo hizo adicto al deseo de usarla otra vez
Involucrando su vida
Y es un partido que un día el Diego está por ganar
A poco que debutó (Maradó, Maradó)
La 12 fue quien coreó (Maradó, Maradó)
Su sueño tenía una estrella
Llena de gol y gambetas
Y todo el pueblo cantó (Maradó, Maradó)
Nació la mano de Dios (Maradó, Maradó)
Llenó alegría en el pueblo
Llenó de gloria este suelo
Olé, olé, olé, olé
¡Diego, Diego!
Olé, olé, olé, olé
¡Diego, Diego!
Olé, olé, olé, olé
¡Diego, Diego!
Olé, olé, olé, olé
¡Diego, Diego!
Y todo el pueblo cantó (Maradó, Maradó)
La 12 fue quien coreó (Maradó, Maradó)
Su sueño tenía una estrella
Llena de gol y gambetas
Y todo el pueblo cantó (Maradó, Maradó)
Nació la mano de Dios (Maradó, Maradó)
Llenó alegría en el pueblo
Regó de gloria este suelo
Regó de gloria este suelo
Regó de gloria
Agregar a la playlist
Tamaño
A
A
Cifrado
Imprimir
Corregir
Time█ OVERVIEW
This library is a Pine Script™ programmer’s tool containing a variety of time related functions to calculate or measure time, or format time into string variables.
█ CONCEPTS
`formattedTime()`, `formattedDate()` and `formattedDay()`
Pine Script™, like many other programming languages, uses timestamps in UNIX format, expressed as the number of milliseconds elapsed since 00:00:00 UTC, 1 January 1970. These three functions convert a UNIX timestamp to a formatted string for human consumption.
These are examples of ways you can call the functions, and the ensuing results:
CODE RESULT
formattedTime(timenow) >>> "00:40:35"
formattedTime(timenow, "short") >>> "12:40 AM"
formattedTime(timenow, "full") >>> "12:40:35 AM UTC"
formattedTime(1000 * 60 * 60 * 3.5, "HH:mm") >>> "03:30"
formattedDate(timenow, "short") >>> "4/30/22"
formattedDate(timenow, "medium") >>> "Apr 30, 2022"
formattedDate(timenow, "full") >>> "Saturday, April 30, 2022"
formattedDay(timenow, "E") >>> "Sat"
formattedDay(timenow, "dd.MM.yy") >>> "30.04.22"
formattedDay(timenow, "yyyy.MM.dd G 'at' hh:mm:ss z") >>> "2022.04.30 AD at 12:40:35 UTC"
These functions use str.format() and some of the special formatting codes it allows for. Pine Script™ documentation does not yet contain complete specifications on these codes, but in the meantime you can find some information in the The Java™ Tutorials and in Java documentation of its MessageFormat class . Note that str.format() implements only a subset of the MessageFormat features in Java.
`secondsSince()`
The introduction of varip variables in Pine Script™ has made it possible to track the time for which a condition is true when a script is executing on a realtime bar. One obvious use case that comes to mind is to enable trades to exit only when the exit condition has been true for a period of time, whether that period is shorter that the chart's timeframe, or spans across multiple realtime bars.
For more information on this function and varip please see our Using `varip` variables publication.
`timeFrom( )`
When plotting lines , boxes , and labels one often needs to calculate an offset for past or future end points relative to the time a condition or point occurs in history. Using xloc.bar_index is often the easiest solution, but some situations require the use of xloc.bar_time . We introduce `timeFrom()` to assist in calculating time-based offsets. The function calculates a timestamp using a negative (into the past) or positive (into the future) offset from the current bar's starting or closing time, or from the current time of day. The offset can be expressed in units of chart timeframe, or in seconds, minutes, hours, days, months or years. This function was ported from our Time Offset Calculation Framework .
`formattedNoOfPeriods()` and `secondsToTfString()`
Our final two offerings aim to confront two remaining issues:
How much time is represented in a given timestamp?
How can I produce a "simple string" timeframe usable with request.security() from a timeframe expressed in seconds?
`formattedNoOfPeriods()` converts a time value in ms to a quantity of time units. This is useful for calculating a difference in time between 2 points and converting to a desired number of units of time. If no unit is supplied, the function automatically chooses a unit based on a predetermined time step.
`secondsToTfString()` converts an input time in seconds to a target timeframe string in timeframe.period string format. This is useful for implementing stepped timeframes relative to the chart time, or calculating multiples of a given chart timeframe. Results from this function are in simple form, which means they are useable as `timeframe` arguments in functions like request.security() .
█ NOTES
Although the example code is commented in detail, the size of the library justifies some further explanation as many concepts are demonstrated. Key points are as follows:
• Pivot points are used to draw lines from. `timeFrom( )` calculates the length of the lines in the specified unit of time.
By default the script uses 20 units of the charts timeframe. Example: a 1hr chart has arrows 20 hours in length.
• At the point of the arrows `formattedNoOfPeriods()` calculates the line length in the specified unit of time from the input menu.
If “Use Input Time” is disabled, a unit of time is automatically assigned.
• At each pivot point a label with a formatted date or time is placed with one of the three formatting helper functions to display the time or date the pivot occurred.
• A label on the last bar showcases `secondsSince()` . The label goes through three stages of detection for a timed alert.
If the difference between the high and the open in ticks exceeds the input value, a timer starts and will turn the label red once the input time is exceeded to simulate a time-delayed alert.
• In the bottom right of the screen `secondsToTfString()` posts the chart timeframe in a table. This can be multiplied from the input menu.
Look first. Then leap.
█ FUNCTIONS
formattedTime(timeInMs, format)
Converts a UNIX timestamp (in milliseconds) to a formatted time string.
Parameters:
timeInMs : (series float) Timestamp to be formatted.
format : (series string) Format for the time. Optional. The default value is "HH:mm:ss".
Returns: (string) A string containing the formatted time.
formattedDate(timeInMs, format)
Converts a UNIX timestamp (in milliseconds) to a formatted date string.
Parameters:
timeInMs : (series float) Timestamp to be formatted.
format : (series string) Format for the date. Optional. The default value is "yyyy-MM-dd".
Returns: (string) A string containing the formatted date.
formattedDay(timeInMs, format)
Converts a UNIX timestamp (in milliseconds) to the name of the day of the week.
Parameters:
timeInMs : (series float) Timestamp to be formatted.
format : (series string) Format for the day of the week. Optional. The default value is "EEEE" (complete day name).
Returns: (string) A string containing the day of the week.
secondsSince(cond, resetCond)
The duration in milliseconds that a condition has been true.
Parameters:
cond : (series bool) Condition to time.
resetCond : (series bool) When `true`, the duration resets.
Returns: The duration in seconds for which `cond` is continuously true.
timeFrom(from, qty, units)
Calculates a +/- time offset in variable units from the current bar's time or from the current time.
Parameters:
from : (series string) Starting time from where the offset is calculated: "bar" to start from the bar's starting time, "close" to start from the bar's closing time, "now" to start from the current time.
qty : (series int) The +/- qty of units of offset required. A "series float" can be used but it will be cast to a "series int".
units : (series string) String containing one of the seven allowed time units: "chart" (chart's timeframe), "seconds", "minutes", "hours", "days", "months", "years".
Returns: (int) The resultant time offset `from` the `qty` of time in the specified `units`.
formattedNoOfPeriods(ms, unit)
Converts a time value in ms to a quantity of time units.
Parameters:
ms : (series int) Value of time to be formatted.
unit : (series string) The target unit of time measurement. Options are "seconds", "minutes", "hours", "days", "weeks", "months". If not used one will be automatically assigned.
Returns: (string) A formatted string from the number of `ms` in the specified `unit` of time measurement
secondsToTfString(tfInSeconds, mult)
Convert an input time in seconds to target string TF in `timeframe.period` string format.
Parameters:
tfInSeconds : (simple int) a timeframe in seconds to convert to a string.
mult : (simple float) Multiple of `tfInSeconds` to be calculated. Optional. 1 (no multiplier) is default.
Returns: (string) The `tfInSeconds` in `timeframe.period` format usable with `request.security()`.

Momentum ScoreMomentum is the tendency of assets that have gone up in price to continue going up in price - and for assets that have gone down in price to continue going down in price. The reasons behind it are not well understood by academics, but momentum is a property that exists across geographies and asset classes.
The Momentum Score is a system that scores companies based on their one year total returns, excluding the last month of returns. In other words, a momentum score for today will be based on the total returns of a stock from 12 months ago today to one month ago today.
Our Momentum Score 13612W has the following composition:
MS 13612W = 12 * Roc(1) + 4 * Roc(3) + 2 * Roc(6) + 1 * Roc(12)
with ROC = (p0/pt) - 1, where pt equals price p with a t-month lag
Median Convergence DivergenceIntroduction
The Median Convergence Divergence (MCD) is a derivative of the Moving Average Convergence Divergence (MACD). The difference is the change in the use of the measure of central tendency. In MACD, moving average (mean) is used, whereas, in MCD, the median is used instead. The purpose of using the median is to eliminate the outlying values, which would be calculated for a moving average. The outliers would affect the value of the moving average.
For example: 3, 5, 7, 8, 5, 4, 2, 1, 6, 21, 8. The data set average is 6.3, whereas the median value is 5. There is a difference of about 23% in the example. The reason is the outlying value '21' in the data set.
As the markets are volatile, outlying values can always emerge. A moving average will consider those values; on the other hand, the median will ignore. If the strategy calls for a tool to ignore the outliers, the Median Convergence Divergence would be a great centered oscillator.
The default values have changed to suit the current trading days in a week. When the MACD was introduced, there would be six trading days in a week. Therefore, it used 12 (2 weeks), 26(4 weeks), and 9 ( 1.5 weeks). But now that there are five trading days per week. The default values are adapted to them. Feel free to change them as per your wish.
Recommended Settings
The current settings are set to be used for the Daily Time Frame: 5 day period for the fast line, a 20 day period for the slow line, and a 10 day period for the signal line. (5 days represent a trading week, 10 days is two weeks, and 20 days is 4 weeks or a month)
For the weekly charts, use 4 week period for the fast line, 13 week period for the slow line, and 8 week period for the signal line. (4 weeks represent a month, 8 weeks is two months, and 13 weeks is 3 months or quarterly)
And for monthly charts, use 3 month period for the fast line, 12 month period for the slow line, and 6 month period for the signal line. (3 months is quarterly, 6 months is bi-yearly, and 12 month is yearly)
It'll be challenging to measure for intraday since there are many different timeframes within intraday. The settings mentioned above should also be customized as per the requirements of the trading strategy.
Strategy
The strategy application is the same as the MACD, i.e., Signal Line Crossovers, Zero Line Crossovers, and Divergence.
Signal Line Crossovers: When the MCD line crosses above the Signal line, it's a bullish crossover. When the MCD line crosses below the Signal line, it's a bearish crossover.
Zero Line Crossovers: It's a bullish crossover when the MCD line crosses above the Zero line. When the MCD line crosses below the Zero Line, it's a bearish crossover.
Divergence: When price shows a lower low, but MCD shows a higher low, it's a bullish divergence. When the price shows a higher high but MCD shows a lower high, it's a bearish divergence.
Using other indicators in conjunction with the Median Convergence Divergence is recommended to take entry and exit signals.

DAYOFWEEK performance1 -Objective
"What is the ''best'' day to trade .. Monday, Tuesday...."
This script aims to determine if there are different results depending on the day of the week.
The way it works is by dividing data by day of the week (Monday, Tuesday, Wednesday ... ) and perform calculations for each day of the week.
1 - Objective
2 - Features
3 - How to use (Examples)
4 - Inputs
5 - Limitations
6 - Notes
7 - Final Tooughs
2 - Features
AVG OPEN-CLOSE
Calculate de Percentage change from day open to close
Green % (O-C)
Percentage of days green (open to close)
Average Change
Absolute day change (O-C)
AVG PrevD. Close-Close
Percentage change from the previous day close to the day of the week close
(Example: Monday (C-C) = Friday Close to Monday close
Tuesday (C-C) = Monday C. to Tuesday C.
Green % (C1-C)
Percentage of days green (open to close)
AVG Volume
Day of the week Average Volume
Notes:
*Mon(Nº) - Nº = Number days is currently calculated
Example: Monday (12) calculation based on the last 12 Mondays. Note: Discrepancies in numbers example Monday (12) - Friday (11) depend on the initial/end date or the market was closed (Holidays).
3 - How to use (Examples)
For the following example, NASDAQ:AAPL from 1 Jan 21 to 1 Jul 21 the results are following.
The highest probability of a Close being higher than the Open is Monday with 52.17 % and the Lowest Tuesday with 38.46 %. Meaning that there's a higher chance (for NASDAQ:AAPL ) of closing at a higher value on Monday while the highest chance of closing is lower is Tuesday. With an average gain on Tuesday of 0.21%
Long - The best day to buy (long) at open (on average) is Monday with a 52.2% probability of closing higher
Short - The best day to sell (short) at open (on average) is Tuesday with a 38.5% probability of closing higher (better chance of closing lower)
Since the values change from ticker to ticker, there is a substantial change in the percentages and days of the week. For example let's compare the previous example ( NASDAQ:AAPL ) to NYSE:GM (same settings)
For the same period, there is a substantial difference where there is a 62.5% probability Friday to close higher than the open, while Tuesday there is only a 28% probability.
With an average gain of 0.59% on Friday and an average loss of -0.34%
Also, the size of the table (number of days ) depends if the ticker is traded or not on that day as an example COINBASE:BTCUSD
4 - Inputs
DATE RANGE
Initial Date - Date from which the script will start the calculation.
End Date - Date to which the script will calculate.
TABLE SETTINGS
Text Color - Color of the displayed text
Cell Color - Background color of table cells
Header Color - Color of the column and row names
Table Location - Change the position where the table is located.
Table Size - Changes text size and by consequence the size of the table
5 - LIMITATIONS
The code determines average values based on the stored data, therefore, the range (Initial data) is limited to the first bar time.
As a consequence the lower the timeframe the shorter the initial date can be and fewer weeks can be calculated. To warn about this limitation there's a warning text that appears in case the initial date exceeds the bar limit.
Example with initial date 1 Jan 2021 and end date 18 Jul 2021 in 5m and 10 m timeframe:
6 - Notes and Disclosers
The script can be moved around to a new pane if need. -> Object Tree > Right Click Script > Move To > New pane
The code has not been tested in higher subscriptions tiers that allow for more bars and as a consequence more data, but as far I can tell, it should work without problems and should be in fact better at lower timeframes since it allows more weeks.
The values displayed represent previous data and at no point is guaranteed future values
7 - Final Tooughs
This script was quite fun to work on since it analysis behavioral patterns (since from an abstract point a Tuesday is no different than a Thursday), but after analyzing multiple tickers there are some days that tend to close higher than the open.
PS: If you find any mistake ex: code/misspelling please comment.

Phoenix Ascending 2.201Hi Everyone!
It's time to make this indicator public to relieve myself of replying to requests for access. There has been an update to this indicator; in which a Stochastic RSI was added to this indicator. Please follow the directions to SETUP the indicator in the SETUP VIDEO provided below.
Phoenix Ascending 2.201 and Bollinger Bands Setup Video.
The following are BASIC rules for the Phoenix 2.201 Indicator. More advanced rules and the requirements for those rules can be found in my publications in my public profile. Unfortunately, I do not have organized videos created on how to use this indicator in full but will be available in the future.
IMPORTANT: The BASIC rules below are beneficial but these are NOT all the rules. More rules and requirements for those rules will be available in the future.
RULE NO. 1
We PREFER the Blue LSMA to be at 80% or higher for SAFE EXIT (SHORT) bets.
We PREFER the Blue LSMA to be at 20% or lower for SAFE ENTRY (LONG) bets.
Rule No. 2
ANY time the red line is approaching a green line that’s moving UPWARD,
Be prepared to make an ENTRY (LONG) when the red line is about to touch the green line that’s moving upward.
One can look at a lower time frame to get a better idea of how much longer you may have
To wait for the red line to touch the green line. In many cases, you may make ENTRY (LONG)
Just before the red line actually touches the green line that’s moving up in that higher time frame
You were initially using as your COMPASS. I currently have the 1-Month TF as a compass for EURUSD.
Rule No. 3
ANY time the red line is approaching a green line that’s moving DOWNWARD,
Be prepared to make an EXIT (SHORT) when the red line is about to touch the green line that’s moving downward.
One can look at a lower time frame to get a better idea of how much longer you may have
To wait for the red line to touch the green line. In many cases, you may make your EXIT (SHORT)
Just before the red line actually touches the green line that’s moving downward in that higher time frame
You were initially using as your COMPASS. I currently have the 1-Month TF as a compass for EURUSD.
Rule No. 4
The Green Line and/or Ghost Line can often help one determine when an upward or downward move in a particular time frame
Is nearly exhausted and about to reverse.
Example for Upside Exhaustion about to reverse to the Downside:
When the Green Line and/or Ghost line is at 80% level or higher, this is a good indicator to inform
Us the current upside move may be approaching exhaustion. You can look at a higher time frame to try to gain
More insight as to whether this will only be a brief dip down in the lower time frame IF the higher time frame you
Went to reveals there is a lot more room remaining for the Green and/or Ghost Lines to reach the 80% or higher level.
Example for Downside Exhaustion about to reverse to the Upside:
When the Green Line and/or Ghost line is at 20% level or lower, this is a good indicator to inform
Us the current downside move may be approaching exhaustion. You can look at a higher time frame to try to gain
More insight as to whether this will only be a brief dip up in the lower time frame IF the higher time frame you
Went to reveals there is a lot more room remaining for the Green and/or Ghost Lines to reach the 20% or lower level.
Rule No. 5
The same rules you see in Rule No. 4 also apply to the Stochastic RSI. Keep in mind I changed the colors of the
Stochastic RSI to the following: Red default changed to Purple and Blue changed changed to Black to avoid confusing
Them with the lines in Godmode.
When the Stochastic RSI is at 80% or higher level, we need to be on guard for a reversal to the downside.
When the Stochastic RSI is at 20% or lower level, we need to be on guard for a reversal to the upside.
EXTREMELY IMPORTANT to apply these rules in GROUPS OF TIME FRAMES.
"TYPES" OF TIME FRAME GROUP TRADING SIGNALS
Scalping Group Signals: Signals provided for this group involve analyzing the following two groups of time frames. Short Term Group as a compass and Scalping Group for confirmation and more precise entry/exit.
Scalping Group: 6min. 12min. 23min & 45min.
Short Term Group: 90min. 3hr. 6hr. & 12hr.
Short Term Group Signals: Signals provided for this group involve analyzing the following two groups of time frames. NearTerm Group as a compass and Short Term Group for confirmation and more precise entry/exit.
Short Term Group: 90min. 3hr. 6hr. & 12hr.
Near Term Group: 24hr. 2-Day, 3-Day & 4-Day
Near Term Group Signals: Signals provided for this group involve analyzing the following two groups of time frames. Mid Term Group as a compass and Near Term Group for confirmation and more precise entry/exit.
Near Term Group: 24hr. 2-Day, 3-Day & 4-Day
Mid Term Group: 3-Day, 6-Day, 9-Day & 12-Day
Mid Term Group Signals: Signals provided for this group involve analyzing the following two groups of time frames. Long Term Group as a compass and Mid Term Group for confirmation and more precise entry/exit.
Mid Term Group: 3-Day, 6-Day, 9-Day & 12-Day
Long Term Group: 1-Week, 2-Week, 3-Week & 4-Week
Long Term Group Signals: Signals provided for this group involve analyzing the following two groups of time frames. Macro Term Group as a compass and Long Term Group for confirmation and more precise entry/exit.
Long Term Group: 1-Week, 2-Week, 3-Week & 4-Week
Macro Term Group: 1-Month, 2-Month, 3-Month & 4-Month
Macro Term Group Signals: Signals provided for this group involve analyzing the following two groups of time frames. Macro Term Group as a compass and Long Term Group for confirmation and more precise entry/exit.
Macro Term Group: 1-Month, 2-Month, 3-Month & 4-Month
Super Macro Group: 3-Month , 6-Month, 12-Month & 24-Month

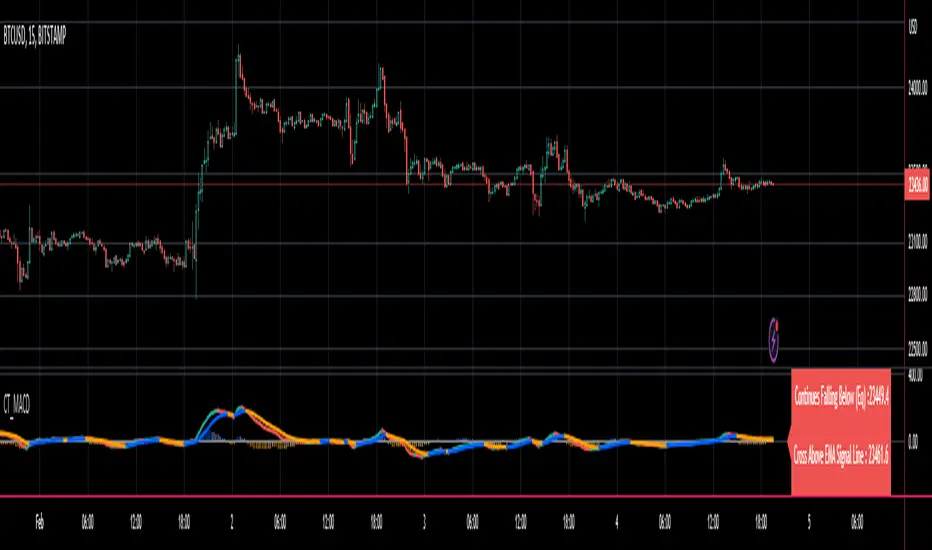
Reverse MACD IndicatorIntroducing the reverse MACD Indicator.
This is my Pinescript implementation of the reverse MACD indicator.
Much respect to Mr Johnny Dough the original creator of this idea.
Feel free to reuse this script, drop me a note below if you find this useful.
Investopedia defines the MACD as a trend-following momentum indicator that shows the relationship between two moving averages of a security’s price.
The MACD is calculated by subtracting the 26-period Exponential Moving Average ( EMA ) from the 12-period EMA .
The result of that calculation is the MACD line.
A nine-day EMA of the MACD called the "signal line," is then plotted on top of the MACD line, which can function as a trigger for buy and sell signals.
Traders may buy the security when the MACD crosses above its signal line and sell—or short—the security when the MACD crosses below the signal line.
Moving Average Convergence Divergence ( MACD ) indicators can be interpreted in several ways, but the more common methods are crossovers, divergences, and rapid rises/falls.
MACD triggers technical signals when it crosses above (to buy) or below (to sell) its signal line.
The speed of crossovers is also taken as a signal of a market is overbought or oversold.
MACD helps investors understand whether the bullish or bearish movement in the price is strengthening or weakening.
The MACD has a positive value (shown as the red line on the price chart ) whenever the 12-period EMA ( indicated by the blue line on the price chart) is above the 26-period EMA (the red line in the price chart) and a negative value when the 12-period EMA is below the 26-period EMA .
The more distant the MACD is above or below its baseline indicates that the distance between the two EMAs is growing.
The baseline here is the white line.
The Reverse function of the MACD provides value by letting the user know the specific price needed to expect a MACD cross over in the opposite direction.
This function can be used to designate risk parameters for a potential trade if using the MACD as their source of edge, letting the user know exactly where and how much their risk is for a potential trade which can be used to design an effective trading plan.
Percentage Volume Oscillator (PVO)The Percentage Volume Oscillator (PVO) is a momentum oscillator for volume. The PVO measures the difference between two volume-based moving averages as a percentage of the larger moving average. As with MACD and the Percentage Price Oscillator (PPO), it is shown with a signal line, a histogram and a centerline. The PVO is positive when the shorter volume EMA is above the longer volume EMA and negative when the shorter volume EMA is below. This indicator can be used to define the ups and downs for volume, which can then be used to confirm or refute other signals. Typically, a breakout or support break is validated when the PVO is rising or positive.
Generally speaking, volume is above average when the PVO is positive and below average when the PVO is negative. A negative and rising PVO indicates that volume levels are increasing. A positive and falling PVO indicates that volume levels are decreasing. Chartists can use this information to confirm or refute movements on the price chart.
Even though the PVO is based on a momentum oscillator formula, it is important to remember that moving averages lag. A 12-day EMA include 12 days of volume data, with newer data weighted more heavily. A 26-day EMA lags even more because it contains 26 days of data. This means that the PVO(12,26,9) can sometimes be out of sync with price action.
The Percentage Volume Oscillator (PVO) is a momentum indicator applied to volume. This oscillator can be quite choppy due to the fact that volume doesn't trend. Bullish and bearish divergences are not well suited for the PVO. Instead, chartists would be better off looking for signs of increasing volume with a move into positive territory and signs of decreasing volume with a move into negative territory. Increasing volume can validate a support or resistance break. Similarly, a surge or significant support break on low volume may be less robust. As with all technical indicators, it is important to use the Percentage Volume Oscillator (PVO) in conjunction with other aspects of technical analysis, such as chart patterns and momentum oscillators.

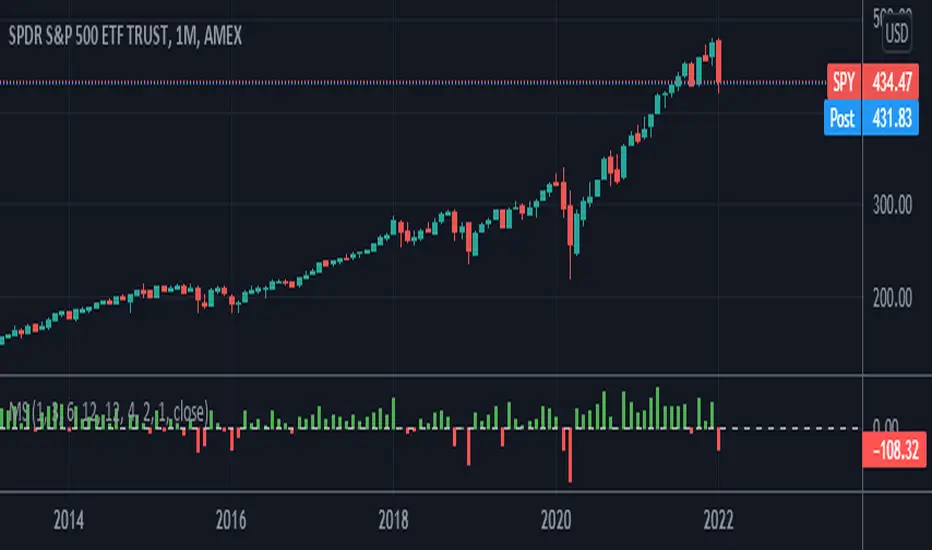
ETF / Stocks / Crypto - DCA Strategy v1Simple "benchmark" strategy for ETFs, Stocks and Crypto! Super-easy to implement for beginners, a DCA (dollar-cost-averaging) strategy means that you buy a fixed amount of an ETF / Stock / Crypto every several months. For instance, to DCA the S&P 500 (SPY), you could purchase $10,000 USD every 12 months, irrespective of the market price. Assuming the macro-economic conditions of the underlying country remain favourable, DCA strategies will result in capital gains over a period of many years, e.g. 10 years. DCA is the safest strategy that beginners can employ to make money in the markets, and all other types of strategies should be "benchmarked" against DCA; if your strategy cannot outperform DCA, then your strategy is useless.
Recommended Chart Settings:
Asset Class: ETF / Stocks / Crypto
Time Frame: H1 (Hourly) / D1 (Daily) / W1 (Weekly) / M1 (Monthly)
Necessary ETF Macro Conditions:
1. Country must have healthy demographics, good ratio of young > old
2. Country population must be increasing
3. Country must be experiencing price-inflation
Necessary Stock Conditions:
1. Growing revenue
2. Growing net income
3. Consistent net margins
4. Higher gross/net profit margin compared to its peers in the industry
5. Growing share holders equity
6. Current ratios > 1
7. Debt to equity ratio (compare to peers)
8. Debt servicing ratio < 30%
9. Wide economic moat
10. Products and services used daily, and will stay relevant for at least 1 decade
Necessary Crypto Conditions:
1. Honest founders
2. Competent technical co-founders
3. Fair or non-existent pre-mine
4. Solid marketing and PR
5. Legitimate use-cases / adoption
Default Robot Settings:
Contribution (USD): $10,000
Frequency (Months): 12
*Robot buys $10,000 worth of ETF, Stock, Crypto, regardless of the market price, every 12 months since its founding time.*
*Equity curve can be seen from the bottom panel*
Risk Warning:
This strategy is low-risk, however it assumes you have a long time horizon of at least 5 to 10 years. The longer your holding-period, the better your returns. The only thing the user has to keep-in-mind are the macro-economic conditions as stated above. If unsure, please stick to ETFs rather than buying individual stocks or cryptocurrencies.

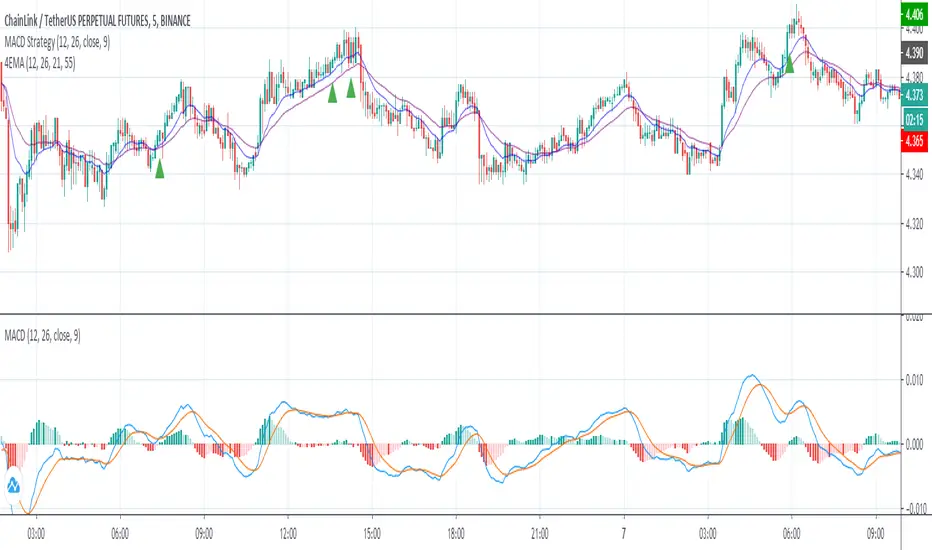
MACD StrategyThis script sends buy and sell signals as alerts to 3Commas (online software with trading bots in cryptocurreny)
It's based on 2 indicators:
- MACD
- 12 EMA and 26 EMA
When the 12 EMA and 26 EMA crossover, the MACD line crosses above 0. The goal here is to look for buy signals when the MACD and Signal are below 0, the histogram is positive, and there was or will be a 12 EMA and 26 EMA crossover.
I struggle with the following:
- There are multiple ways to use this as a crossover signal. I want to calculate the win rate of every posibility.
- What should be my take profit and my stoploss?
I think a 2:1 R/R,and a 60% win rate would make a great strategy! I could use some advice.
PowerX Strategy Bar Coloring [OFFICIAL VERSION]This script colors the bars according to the PowerX Strategy by Markus Heitkoetter:
The PowerX Strategy uses 3 indicators:
- RSI (7)
- Stochastics (14, 3, 3)
- MACD (12, 26 , 9)
The bars are colored GREEN if...
1.) The RSI (7) is above 50 AND
2.) The Stochastic (14, 3, 3) is above 50 AND
3.) The MACD (12, 26, 9) is above its Moving Average, i.e. MACD Histogram is positive.
The bars are colored RED if...
1.) The RSI (7) is below 50 AND
2.) The Stochastic (14, 3, 3) is below 50 AND
3.) The MACD (12, 26, 9) is below its Moving Average, i.e. MACD Histogram is negative.
If only 2 of these 3 conditions are met, then the bars are black (default color)
We highly recommend plotting the indicators mentioned above on your chart, too, so that you can see when bars are getting close to being "RED" or "GREEN", e.g. RSI is getting close to the 50 line.

Price Action and 3 EMAs Momentum plus Sessions FilterThis indicator plots on the chart the parameters and signals of the Price Action and 3 EMAs Momentum plus Sessions Filter Algorithmic Strategy. The strategy trades based on time-series (absolute) and relative momentum of price close, highs, lows and 3 EMAs.
I am still learning PS and therefore I have only been able to write the indicator up to the Signal generation. I plan to expand the indicator to Entry Signals as well as the full Strategy.
The strategy works best on EURUSD in the 15 minutes TF during London and New York sessions with 1 to 1 TP and SL of 30 pips with lots resulting in 3% risk of the account per trade. I have already written the full strategy in another language and platform and back tested it for ten years and it was profitable for 7 of the 10 years with average profit of 15% p.a which can be easily increased by increasing risk per trade. I have been trading it live in that platform for over two years and it is profitable.
Contributions from experienced PS coders in completing the Indicator as well as writing the Strategy and back testing it on Trading View will be appreciated.
STRATEGY AND INDICATOR PARAMETERS
Three periods of 12, 48 and 96 in the 15 min TF which are equivalent to 3, 12 and 24 hours i.e (15 min * period / 60 min) are the foundational inputs for all the parameters of the PA & 3 EMAs Momentum + SF Algo Strategy and its Indicator.
3 EMAs momentum parameters and conditions
• FastEMA = ema of 12 periods
• MedEMA = ema of 48 periods
• SlowEMA = ema of 96 periods
• All the EMAs analyse price close for up to 96 (15 min periods) equivalent to 24 hours
• There’s Upward EMA momentum if price close > FastEMA and FastEMA > MedEMA and MedEMA > SlowEMA
• There’s Downward EMA momentum if price close < FastEMA and FastEMA < MedEMA and MedEMA < SlowEMA
PA momentum parameters and conditions
• HH = Highest High of 48 periods from 1st closed bar before current bar
• LL = Lowest Low of 48 periods from 1st closed bar from current bar
• Previous HH = Highest High of 84 periods from 12th closed bar before current bar
• Previous LL = Lowest Low of 84 periods from 12th closed bar before current bar
• All the HH & LL and prevHH & prevLL are within the 96 periods from the 1st closed bar before current bar and therefore indicative of momentum during the past 24 hours
• There’s Upward PA momentum if price close > HH and HH > prevHH and LL > prevLL
• There’s Downward PA momentum if price close < LL and LL < prevLL and HH < prevHH
Signal conditions and Status (BuySignal, SellSignal or Neutral)
• The strategy generates Buy or Sell Signals if both 3 EMAs and PA momentum conditions are met for each direction and these occur during the London and New York sessions
• BuySignal if price close > FastEMA and FastEMA > MedEMA and MedEMA > SlowEMA and price close > HH and HH > prevHH and LL > prevLL and timeinrange (LDN&NY) else Neutral
• SellSignal if price close < FastEMA and FastEMA < MedEMA and MedEMA < SlowEMA and price close < LL and LL < prevLL and HH < prevHH and timeinrange (LDN&NY) else Neutral
Entry conditions and Status (EnterBuy, EnterSell or Neutral)(NOT CODED YET)
• ENTRY IS NOT AT THE SIGNAL BAR but at the current bar tick price retracement to FastEMA after the signal
• EnterBuy if current bar tick price <= FastEMA and current bar tick price > prevHH at the time of the Buy Signal
• EnterSell if current bar tick price >= FastEMA and current bar tick price > prevLL at the time of the Sell Signal

Smart labelling - Candlestick FunctionOftentimes a single look at the candlestick configuration happens to be enough to understand what is going on. The chandlestick function is an experiment in smart labelling that produces candles for various time frames, not only for the fixed 1m, 3m , 5m, 15m, etc. ones, and helps in decision-making when eye-balling the chart. This function generates up to 12 last candlesticks , which is generally more than enough.
Mind that since this is an experiment, the function does not cover all possible combinations. In some time frames the produced candles overlap. This is a todo item for those who are unterested. For instance, the current version covers the following TFs:
Chart - TF in the script
1m - 1-20,24,30,32
3m - 1-10
5m - 1-4,6,9,12,18,36
15m - 1-4,6,12
Tested chart TFs: 1m, 3m ,5m,15m. Tested securities: BTCUSD , EURUSD

[astropark] Power Tools Overlay//******************************************************************************
// Power Tools Overlay
// Inner Version 1.2.1 13/12/2018
// Developer: iDelphi
// Developer: astropark (Ichimoku Cloud), SMA EMA & Cross tools
//------------------------------------------------------------------------------
// 21/11/2018 Added EMA SMA WMA
// 21/11/2018 Added SMA-EMA EMA-WMA WMA-SMA (Thanks to mariobros1 for the idea of the Simultaneous MA)
// 21/11/2018 Added Bollinger Bands
// 21/11/2018 Added Ichimoku Cloud (Thanks to astropark for all the code of the Ichimoku Cloud)
// 23/11/2018 Show all the indicator as default
// 23/11/2018 Added a cross when single Moving Averages crossing (Thanks to astropark for the idea)
// 24/11/2018 Descriptions Fix
// 24/11/2018 Added Option to enable/disable all Moving Averages
// 10/12/2018 Added EMAs and Crosses
// 13/12/2018 indicator number fixes
//******************************************************************************

[Delphi] Power Tools OscillatorsFEATURES
- RSI
- Stochastic
//******************************************************************************
// Power Tools Oscillators
// Inner Version 1.0 04/12/2018
// Developer: iDelphi
//------------------------------------------------------------------------------
// 04/12/2018 Added RSI
// 04/12/2018 Added Stochastic
//******************************************************************************

Multi SMA EMA WMA HMA BB (4x3 MAs Bollinger Bands) Pro MTF - RRBMulti SMA EMA WMA HMA 4x3 Moving Averages with Bollinger Bands Pro MTF by RagingRocketBull 2018
Version 1.0
This indicator shows multiple MAs of any type SMA EMA WMA HMA etc with BB and MTF support, can show MAs as dynamically moving levels.
There are 4 MA groups + 1 BB group. You can assign any type/timeframe combo to a group, for example:
- EMAs 50,100,200 x H1, H4, D1, W1 (4 TFs x 3 MAs x 1 type)
- EMAs 8,13,21,55,100,200 x M15, H1 (2 TFs x 6 MAs x 1 type)
- D1 EMAs and SMAs 12,26,50,100,200,400 (1 TF x 6 MAs x 2 types)
- H1 WMAs 7,77,231; H4 HMAs 50,100,200; D1 EMAs 144,169,233; W1 SMAs 50,100,200 (4 TFs x 3 MAs x 4 types)
- +1 extra MA type/timeframe for BB
compile time: 25-30 sec
full redraw time after parameter change in UI: 3 sec
There are several versions: Simple, MTF, Pro MTF, Advanced MTF and Ultimate MTF. This is the Pro MTF version. The Differences are listed below. All versions have BB
- Simple: you have 2 groups of MAs that can be assigned any type (5+5)
- MTF: +2 custom Timeframes for each group (2x5 MTF)
- Pro MTF: +4 custom Timeframes for each group (4x3 MTF), MA levels and show max bars back options
- Advanced MTF: +2 extra MAs/group (4x5 MTF), custom Ticker/Symbol, backreferences for type, TF and MA lengths in UI
- Ultimate MTF: +individual settings for each MA, custom Ticker/Symbols
Features:
- 4x3 = 12 MAs of any type including Hull Moving Average (HMA)
- 4x MTF groups with step line smoothing
- BB +1 extra TF/type for BB MAs
- 12 MA levels with adjustable group offsets, indents and shift
- show max bars back
- you can show/hide both groups of MAs/levels and individual MAs
Notes:
1. based on 3EmaBB, uses plot*, barssince and security functions
2. you can't set certain constants from input due to Pinescript limitations - change the code as needed, recompile and use as a private version
3. Levels = trackprice implementation
4. Show Max Bars Back = show_last implementation
5. uses timeframe textbox instead of input resolution to allow for 120 240 and other custom TFs. Also supports TFs in hours: 2H or H2
6. swma has a fixed length = 4, alma and linreg have additional offset and smoothing params
7. Smoothing is applied by default for visual aesthetics on MTF. To use exact ma mtf values (lines with stair stepping) - disable it
MTF Notes:
- uses simple timeframe textbox instead of input resolution dropdown to allow for 120, 240 and other custom TFs, also supports timeframes in H: 2H, H2
- Groups that are not assigned a Custom TF will use Current Timeframe (0).
- MTF will work for any MA type assigned to the group
- MTF works both ways: you can display a higher TF MA/BB on a lower TF or a lower TF MA/BB on a higher TF.
- MTF MA values are normally aligned at the boundary of their native timeframe. This produces stair stepping when a higher TF MA is viewed on a lower TF.
Therefore X Y Point Density/Smoothing is applied by default on MA MTF for visual aesthetics. Set both to 0 to disable and see exact ma mtf values (lines with stair stepping and original mtf alignment).
- Smoothing is disabled for BB MTF bands because fill doesn't work with smoothed MAs after duplicate values are replaced with na.
- MTF MA Value fluctuation is possible on the current bar due to default security lookahead
Smoothing:
- X,Y == 0 - X,Y smoothing disabled (stair stepping on high TFs)
- X == 0, Y > 0 - X,Y smoothing applied to all TFs
- Y == 0, X > 0 - X smoothing applied to all TFs < deltaX_max_tf, Y smoothing disabled
- X > 0, Y > 0 - Y smoothing applied to all TFs, then X smoothing applied to all TFs < deltaX_max_tf
X Smoothing with Y == 0 - shows only every deltaX-th point starting from the first bar.
X Smoothing with Y > 0 - shows only every deltaX-th point starting from the last shown Y point, essentially filling huge gaps remaining after Y Smoothing with points and preserving the curve's general shape
X Smoothing on high TFs with already scarce points produces weird curve shapes, it works best only on high density lower TFs
Y Smoothing reduces points on all TFs, removes adjacent points with prices within deltaY, while preserving the smaller curve details.
A combination of X,Y produces the most accurate smoothing. Higher delta value - larger range, more points removed.
Show Max Bars Back:
- can't set plot show_last from input -> implemented using a timenow based range check
- you can't delete/modify history once plotted, so essentially it just sets a start point for plotting (from num_bars bars back) that works only in realtime mode (not in replay)
Levels:
You can plot current MA value using plot trackprice=true or by checking Show Price Line in Style. Problem is:
- you can only change color (not the dashed line style, width), have both ma + price line (not just the line), and it's full screen wide
- you can't set plot trackprice from input => implemented using plotshape/plotchar with fixed text labels serving as levels
- there's no other way of creating a dynamic level: hline, plot, offset - nothing else works.
- you can't plot a text var - all text strings must be constants, so you can't change the style, width and text labels without recompiling.
- from input you can only adjust offset, indent and shift for each level group, and change color
- the dot below each level line is the exact MA value. If you want just the line swap plotshape with plotchar, recompile and save as your private version, adjust Y shift.
To speed up redraw times: reduce last_bars to ~2000, recompile and use as your own private version
Pinescript is a rudimentary language (should be called Painscript instead) that can basically only plot data. You can't do much else. Please see the code for tips and hints.
Certain things just can't be done or require shady workarounds and weeks of testing trying to resolve weird node.js compiler errors.
Feel free to learn from/reuse/change the code as needed and use as your own private version. See comments in code. Good Luck!

Get_rich_aggressively# Get_rich_aggressively - Professional Order Flow Indicator
## 📊 Overview
**Get_rich_aggressively (GRA)** is a professional-grade order flow indicator designed for futures and crypto traders who understand Auction Market Theory and want to identify high-probability setups with exceptional risk-to-reward ratios (3:1 to 5:1).
This indicator answers the two most critical questions in trading:
1. **Who is in control?** Bulls or Bears based on volume delta and aggression
2. **Where are traders trapped?** Identifying failed breakouts that lead to explosive moves
Built specifically for **NQ (Nasdaq 100 Futures)**, **GC (Gold Futures)**, and **BTC (Bitcoin)**, with optimized settings for each instrument's unique volatility profile.
---
## 🎯 Core Concepts
### Volume Delta & Imbalance
The indicator calculates **buying pressure vs selling pressure** within each candle using intrabar analysis. When one side significantly overpowers the other, an **imbalance** exists—these are the moments where price moves with conviction.
**Imbalance Ratio Interpretation:**
- `1.5:1` → Moderate imbalance (tradeable)
- `2.0:1` → Strong imbalance (high conviction)
- `3.0:1+` → Extreme imbalance (institutional activity)
### Aggression Detection
The indicator identifies which side is **aggressing** (hitting market orders) vs **absorbing** (resting limit orders). When aggressive buyers overwhelm sellers, price moves UP. When aggressive sellers overwhelm buyers, price moves DOWN.
### Trap Detection
**Bull Traps** and **Bear Traps** are failed breakouts where traders get caught on the wrong side. These setups often lead to explosive reversals as trapped traders are forced to exit.
---
## 🔧 How To Use
### Visual Elements
| Element | Meaning |
|---------|---------|
| **Green Bubbles** (below bar) | Bullish volume aggression - buyers winning |
| **Red Bubbles** (above bar) | Bearish volume aggression - sellers winning |
| **▲ Triangle Up** | Long signal (3:1 or 4:1+ R:R) |
| **▼ Triangle Down** | Short signal (3:1 or 4:1+ R:R) |
| **BT / BT!** | Bull Trap (short opportunity) |
| **BrT / BrT!** | Bear Trap (long opportunity) |
| **Diamond** | Absorption candle (institutional activity) |
| **Colored Candles** | Green = positive delta, Red = negative delta |
### Info Panel (Top Right)
| Field | Description |
|-------|-------------|
| **Delta** | Current bar's volume delta (buy - sell pressure) |
| **Vol** | Volume ratio vs 20-period average |
| **Imb** | Imbalance ratio (who's winning) |
| **Ctrl** | Who's in control: BULLS / BEARS |
| **CVD** | Cumulative Volume Delta for session |
| **Sess** | Current session (LDN! = London Open, NY! = NY Open) |
| **Mkt** | Market condition: CHOP / FV / IMB! / OK |
| **Sig** | Active signal if any |
### Signal Hierarchy
**High Conviction Signals (4:1+ R:R):**
- Displayed as `▲ 4:1+` or `▼ 4:1+`
- Require: Strong imbalance (2:1+) + Big volume (2.5x+) + Delta trend confirmation
- Best during London Open or NY Open sessions
**Standard Signals (3:1 R:R):**
- Displayed as `▲ 3:1` or `▼ 3:1`
- Require: Moderate imbalance (1.5:1+) + Volume spike (1.5x+)
- Good any time market is not choppy
**Trap Signals:**
- `BT!` = Strong Bull Trap → SHORT
- `BrT!` = Strong Bear Trap → LONG
- Occur at swing highs/lows with rejection wicks
---
## ⚙️ Recommended Settings by Instrument
### 📈 NQ (Nasdaq 100 E-mini Futures)
NQ is highly liquid with clear institutional footprints. The default settings work excellently.
```
═══════════ VOLUME ANALYSIS ═══════════
Volume MA Length: 20
Volume Spike Threshold: 1.5
Big Trade Threshold: 2.5
Extreme Volume Threshold: 4.0
═══════════ IMBALANCE DETECTION ═══════════
Imbalance Ratio Threshold: 1.5
Strong Imbalance Threshold: 2.0
Delta Confirmation Bars: 3
Fair Value Range (%): 0.3
═══════════ TRAP DETECTION ═══════════
Swing Lookback Period: 20
Minimum Wick Ratio: 0.4
Max Body Ratio (Absorption): 0.35
═══════════ SESSION SETTINGS ═══════════
Timezone: America/New_York
London Open Window: 0300-0500
NY Open Window: 0930-1130
Only Signal During Key Sessions: OFF (or ON for higher conviction)
═══════════ TIMEFRAME SETTINGS ═══════════
Analysis Timeframe: 1 (1-minute intrabar analysis)
Use Intrabar Analysis: ON
```
**Best Timeframes for NQ:**
- **1-minute**: Scalping, quick entries
- **5-minute**: Day trading (RECOMMENDED)
- **15-minute**: Swing entries within day
**NQ Trading Tips:**
- Most reliable signals occur during **9:30-11:30 AM EST** (NY Open)
- Watch for traps at **overnight high/low** levels
- Volume spikes of **3x+** often precede 10-20 point moves
- Avoid trading during **12:00-2:00 PM EST** (lunch chop)
---
### 🥇 GC (Gold Futures)
Gold has different volatility patterns. Increase thresholds slightly to filter noise.
```
═══════════ VOLUME ANALYSIS ═══════════
Volume MA Length: 20
Volume Spike Threshold: 1.8 ← Increased (gold has more noise)
Big Trade Threshold: 3.0 ← Increased
Extreme Volume Threshold: 5.0 ← Increased
═══════════ IMBALANCE DETECTION ═══════════
Imbalance Ratio Threshold: 1.6 ← Slightly higher
Strong Imbalance Threshold: 2.2 ← Slightly higher
Delta Confirmation Bars: 4 ← More confirmation needed
Fair Value Range (%): 0.4 ← Gold chops more
═══════════ TRAP DETECTION ═══════════
Swing Lookback Period: 25 ← Wider swings
Minimum Wick Ratio: 0.45 ← Bigger wicks needed
Max Body Ratio (Absorption): 0.30 ← Tighter for absorption
═══════════ SESSION SETTINGS ═══════════
Timezone: America/New_York
London Open Window: 0300-0500 ← Gold moves well here
NY Open Window: 0830-1030 ← Earlier due to economic news
Only Signal During Key Sessions: ON ← Recommended for GC
═══════════ TIMEFRAME SETTINGS ═══════════
Analysis Timeframe: 1
Use Intrabar Analysis: ON
```
**Best Timeframes for GC:**
- **5-minute**: Day trading (RECOMMENDED)
- **15-minute**: Position entries
- **1-hour**: Swing trading
**Gold Trading Tips:**
- Gold reacts strongly to **economic data releases** (8:30 AM EST)
- **London session** (3-5 AM EST) often sets the daily direction
- Watch for traps at **round numbers** ($2000, $2050, etc.)
- Gold respects **previous day high/low** as key levels
- Absorption candles near support/resistance signal reversals
---
### ₿ BTC (Bitcoin)
Bitcoin trades 24/7 with unique session dynamics. Adjust for higher volatility.
```
═══════════ VOLUME ANALYSIS ═══════════
Volume MA Length: 30 ← Longer average (24/7 market)
Volume Spike Threshold: 2.0 ← Higher threshold (crypto volatility)
Big Trade Threshold: 3.5 ← Higher for significance
Extreme Volume Threshold: 6.0 ← Much higher for crypto
═══════════ IMBALANCE DETECTION ═══════════
Imbalance Ratio Threshold: 1.7 ← Higher due to volatility
Strong Imbalance Threshold: 2.5 ← Higher for conviction
Delta Confirmation Bars: 3
Fair Value Range (%): 0.5 ← BTC ranges more
═══════════ TRAP DETECTION ═══════════
Swing Lookback Period: 30 ← Wider lookback
Minimum Wick Ratio: 0.5 ← BTC has massive wicks
Max Body Ratio (Absorption): 0.25 ← Tighter (many dojis in crypto)
═══════════ SESSION SETTINGS ═══════════
Timezone: America/New_York
London Open Window: 0300-0500 ← European session start
NY Open Window: 0930-1130 ← US session (big moves)
Only Signal During Key Sessions: OFF ← BTC moves 24/7
═══════════ TIMEFRAME SETTINGS ═══════════
Analysis Timeframe: 1
Use Intrabar Analysis: ON
```
**Best Timeframes for BTC:**
- **5-minute**: Active trading
- **15-minute**: Day trading (RECOMMENDED)
- **1-hour**: Swing trading
- **4-hour**: Position trading
**Bitcoin Trading Tips:**
- **US Session** (9:30 AM - 4:00 PM EST) has highest volume
- **Asian Session** (8 PM - 4 AM EST) often consolidates
- Watch for traps at **psychological levels** ($60K, $65K, $70K, etc.)
- **Funding rate flips** often coincide with trap signals
- Weekend volume is lower—signals less reliable
---
## 📋 Trading Playbook
### Setup 1: High Conviction Imbalance Entry
**Conditions:**
- ▲ or ▼ signal appears with "4:1+" label
- Info panel shows "Ctrl: BULLS" or "Ctrl: BEARS"
- Info panel shows "Mkt: IMB!"
- During active session (LDN! or NY!)
**Entry:** Market order on signal bar close
**Stop Loss:** Beyond the signal candle's wick
**Take Profit:** 4:1 risk-to-reward minimum
---
### Setup 2: Trap Reversal
**Conditions:**
- BT! (Bull Trap) or BrT! (Bear Trap) appears
- Signal occurs at swing high/low
- Volume spike confirms (2x+ average)
**Entry:**
- Bull Trap → SHORT on close below signal bar
- Bear Trap → LONG on close above signal bar
**Stop Loss:** Beyond the trap wick
**Take Profit:** Previous swing level (3:1+ R:R typical)
---
### Setup 3: Absorption Reversal
**Conditions:**
- Diamond marker appears (absorption)
- At key support/resistance level
- Followed by opposite-colored candle with volume
**Entry:** On confirmation candle close
**Stop Loss:** Beyond absorption candle
**Take Profit:** 2:1 minimum
---
### Setup 4: Session Open Momentum
**Conditions:**
- "L" (London) or "N" (NY) session marker appears
- First 30 minutes show clear delta direction
- Imbalance ratio > 1.5:1
**Entry:** With the dominant delta direction
**Stop Loss:** Session open price
**Take Profit:** Previous day high/low or 3:1 R:R
---
## ⚠️ When NOT to Trade
Avoid taking signals when:
1. **Info panel shows "Mkt: CHOP"** - Market is ranging without conviction
2. **Info panel shows "Mkt: FV"** - Fair value zone, expect mean reversion
3. **Ctrl shows "---"** - Neither side in control
4. **During lunch hours** (12:00-2:00 PM EST for futures)
5. **Before major news** (FOMC, NFP, CPI)
6. **Low volume sessions** (holidays, weekends for futures)
---
## 🔔 Alerts Setup
The indicator includes pre-built alerts. To set them up:
1. Click the "Alerts" button (clock icon) in TradingView
2. Select "Get_rich_aggressively" as condition
3. Choose from available alerts:
- **EXTREME LONG** - 4:1+ bullish setup
- **EXTREME SHORT** - 4:1+ bearish setup
- **HIGH CONV LONG** - 3:1 bullish setup
- **HIGH CONV SHORT** - 3:1 bearish setup
- **BULL TRAP** - Failed breakout, short opportunity
- **BEAR TRAP** - Failed breakdown, long opportunity
- **LONDON OPEN** - Session notification
- **NY OPEN** - Session notification
---
## 📚 Understanding the Logic
### Volume Delta Calculation
The indicator uses **intrabar analysis** to calculate precise volume delta:
```
For each lower-timeframe bar within the current bar:
Buy Pressure = ((Close - Low) / Range) × Volume
Sell Pressure = ((High - Close) / Range) × Volume
Delta = Buy Pressure - Sell Pressure
Total Delta = Sum of all intrabar deltas
```
This method is more accurate than simple "green candle = buying" logic because it captures the **internal auction** within each candle.
### Imbalance Ratio
```
Bullish Imbalance = Buy Pressure / Sell Pressure
Bearish Imbalance = Sell Pressure / Buy Pressure
If ratio ≥ 1.5 AND volume spike → Standard signal
If ratio ≥ 2.0 AND big volume → High conviction signal
```
### Trap Detection
```
Bull Trap =
Price breaks ABOVE swing high +
Closes BACK BELOW swing high +
Upper wick ≥ 40% of candle range +
Volume spike present
Bear Trap =
Price breaks BELOW swing low +
Closes BACK ABOVE swing low +
Lower wick ≥ 40% of candle range +
Volume spike present
```
---
## 💡 Pro Tips
1. **Combine with market structure** - Signals at key S/R levels are stronger
2. **Watch CVD divergence** - If CVD trends opposite to price, reversal likely
3. **Stack confluences** - Trap + Absorption + Session Open = highest probability
4. **Scale in** - Enter 50% on signal, add on confirmation
5. **Use session filter** - Enable "Only Signal During Key Sessions" for cleaner signals
6. **Check higher timeframe** - Ensure signal aligns with HTF trend/bias
---
## ⚠️ Disclaimer
This indicator is a tool to assist your trading decisions, not a guarantee of profits. Past performance does not indicate future results. Always:
- Use proper risk management (1-2% max per trade)
- Paper trade before going live
- Understand the instrument you're trading
- Never risk more than you can afford to lose
---
## 🔄 Version History
**v1.0** - Initial release
- Volume delta calculation with intrabar analysis
- Imbalance detection and signals
- Bull/Bear trap identification
- Absorption candle detection
- Session filtering (London/NY)
- Real-time info panel
- Comprehensive alert system
---
## 📬 Support
If you have questions or suggestions, leave a comment below or send me a message.
**Happy Trading! Let's Get Rich Aggressively! 🚀**
---
*This indicator is inspired by Auction Market Theory, Order Flow concepts, and professional tools like DeepCharts, Sierra Chart, and Bookmap. It brings institutional-grade analysis to TradingView.*

Smart RSI MTF Matrix [DotGain]Summary
Are you tired of trading trend signals, only to miss the bigger picture because you are focused on a single timeframe?
The Smart RSI MTF Matrix is the ultimate "Cockpit View" for momentum traders. Unlike chart overlays that can sometimes clutter your price action, this indicator organizes RSI conditions across 10 different timeframes simultaneously into a clean, separate Heatmap pane.
It monitors everything from the 5-minute chart all the way up to the 12-Month view , giving you a complete X-ray vision of the market's momentum structure instantly.
⚙️ Core Components and Logic
The Smart RSI MTF Matrix relies on a sophisticated hierarchy to deliver clear, actionable context:
Multi-Timeframe Engine: The script runs 10 independent RSI calculations in the background, organized in rows from bottom (Short Term) to top (Long Term).
Classic RSI Thresholds:
Overbought (> 70): Indicates price may be extended to the upside.
Oversold (< 30): Indicates price may be extended to the downside.
Smart Visibility System (The "Secret Sauce"): Not all signals are equal. A 5-minute signal is "noise" compared to a Yearly signal. This indicator automatically applies Transparency to differentiate importance. The visibility increases by 10% for each higher timeframe slot (Row).
🚦 How to Read the Matrix
The indicator plots dots in 10 stacked rows. The position and opacity tell you the direction and significance:
🟥 RED DOTS (Overbought Condition)
Trigger: RSI is above 70 on that specific timeframe.
Meaning: Potential bearish reversal or pullback.
🟩 GREEN DOTS (Oversold Condition)
Trigger: RSI is below 30 on that specific timeframe.
Meaning: Potential bullish reversal or bounce.
⚪ GRAY DOTS (Neutral)
Trigger: RSI is between 30 and 70.
Meaning: No extreme momentum present.
👻 TRANSPARENCY (Signal Strength)
The visibility of the dot tells you exactly which Timeframe (Row) is triggered. The higher the row, the more solid the color:
Faint (10-30% Visibility): Rows 1-3 (5m, 15m, 1h). Used for scalping entries.
Medium (40-60% Visibility): Rows 4-6 (4h, 1D, 1W). Used for swing trading context.
Solid (70-100% Visibility): Rows 7-10 (1M, 3M, 6M, 12M). Used for identifying major macro cycles.
Visual Elements
Structure: Row 1 (Bottom) represents the 5-minute timeframe. Row 10 (Top) represents the 12-Month timeframe.
Vertical Alignment: If you see a vertical column of Red or Green dots, it indicates Multi-Timeframe Confluence —a highly probable reversal point.
Key Benefit
The goal of the Smart RSI MTF Matrix is to keep your main chart clean while providing maximum information. You can instantly see if a short-term pullback (Faint Green Dot) is happening within a long-term uptrend (Solid Gray/Red Dot), allowing for precision entries.
Have fun :)
Disclaimer
This "Smart RSI MTF Matrix" indicator is provided for informational and educational purposes only. It does not, and should not be construed as, financial, investment, or trading advice.
The signals generated by this tool (both "Buy" and "Sell" indications) are the result of a specific set of algorithmic conditions. They are not a direct recommendation to buy or sell any asset. All trading and investing in financial markets involves substantial risk of loss. You can lose all of your invested capital.
Past performance is not indicative of future results. The signals generated may produce false or losing trades. The creator (© DotGain) assumes no liability for any financial losses or damages you may incur as a result of using this indicator.
You are solely responsible for your own trading and investment decisions. Always conduct your own research (DYOR) and consider your personal risk tolerance before making any trades.

BifaneiroSinaleiro V3 ULTIMATEBifaneiroSinaleiro V3 ULTIMATE - Complete ICT Analysis System & Signal Generator
This isn't just an indicator - it's your 24/7 ICT analyst that does the manual work for you.
━━━━━━━━━━━━━━━━━━━━━━━━━━━━━━━━━━━━━━
🔥 WHAT IT DOES FOR YOU:
━━━━━━━━━━━━━━━━━━━━━━━━━━━━━━━━━━━━━━
✅ Marks ALL ICT Concepts Automatically:
- Fair Value Gaps (LTF + HTF with priority)
- Market Structure (BOS/CHoCH in real-time)
- Breaker Blocks (validated with volume + killzone)
- Liquidity Sweeps (Asian High/Low runs)
- Premium/Discount Arrays + OTE Zones
- Institutional Sessions (London, NY Silver Bullets)
✅ Advanced Pattern Recognition:
- Turtle Soup (sweep + reversal)
- Unicorn Model (sweep → BOS → FVG)
- SMT Divergences (monitors correlated pairs)
- PO3/AMD Phases (Accumulation → Manipulation → Distribution)
✅ Intelligent Scoring System:
- 12+ confluence factors analyzed
- Minimum score 12 for signals (configurable)
- Score 20+ = EXTREME (enables 2nd trade in session)
- Visual score display on every signal
✅ Professional Trade Management:
- 1 trade per session (London, NY AM, NY PM) = max 3/day
- EXTREME mode: 2 trades per session = max 6/day
- Automatic stop loss (session range-based)
- Dynamic take profit (score-adjusted multiplier)
- Auto breakeven after 2.5x move
- EOD close (23:59) with P&L label
- Weekend close (Fri 23:55) with P&L label
✅ 100% ICT Pure Methodology:
- NO EMAs, NO ATR, NO lagging indicators
- Pure price action: High/Low/Range only
- HTF confirmation via Premium/Discount (not EMAs!)
- Stop loss via Asian Range (not ATR!)
━━━━━━━━━━━━━━━━━━━━━━━━━━━━━━━━━━━━━━
⚡ WHY IT'S DIFFERENT:
━━━━━━━━━━━━━━━━━━━━━━━━━━━━━━━━━━━━━━
Traditional indicators show 1-2 concepts. This shows 10+ simultaneously.
Manual ICT takes 2-3 hours per session. This does it in milliseconds.
Other systems guess. This scores with objective confluence.
You save hours daily. You trade better. You profit more consistently.
━━━━━━━━━━━━━━━━━━━━━━━━━━━━━━━━━━━━━━
📊 WHAT YOU GET:
━━━━━━━━━━━━━━━━━━━━━━━━━━━━━━━━━━━━━━
- Real-time dashboard (scores, confluences, structure)
- Precision signals (only in killzones, only with confluences)
- Trade tracking (win rate, RR, P&L by session)
- Multi-timeframe analysis (automatic)
- News block filter (configurable)
- Full customization (colors, thresholds, sessions)
- Comprehensive alerts (8+ types)
Works on: Forex, Indices, Commodities, Crypto
Best on: 1m-5m for execution, 15m+ for swing
Timezone: Configured for CET (UTC+1), easily adjustable
⚠️ This is a professional tool requiring ICT/SMC understanding.
Not magic - it's methodology, automated.
🚀 Stop drawing. Start trading. Add to chart now.
coinjin 정·역배열 대시보드 (Progress+Events)This script analyzes trend alignment using the 5 / 20 / 60 / 112 / 224 / 448 / 896 SMAs,
providing highly precise detection of bullish and bearish stack conditions,
and identifies 12 advanced trend-reversal signals through a multi-timeframe dashboard.
이 스크립트는 5 / 20 / 60 / 112 / 224 / 448 / 896 SMA 기준으로
정배열·역배열 상태를 매우 정교하게 분석하고,
12가지 고급 추세 전환 시그널을 자동 탐지하는 멀티타임프레임 대시보드입니다.

Scout Regiment - MACD# Scout Regiment - MACD Indicator
## English Documentation
### Overview
Scout Regiment - MACD is an advanced implementation of the Moving Average Convergence Divergence indicator with enhanced features including dual divergence detection (histogram and MACD line), customizable moving average types, multi-timeframe analysis, and sophisticated visual elements. This indicator provides traders with comprehensive momentum analysis and high-probability reversal signals.
### What is MACD?
MACD (Moving Average Convergence Divergence) is a trend-following momentum indicator that shows the relationship between two moving averages:
- **MACD Line**: Difference between fast and slow EMAs
- **Signal Line**: Moving average of the MACD line
- **Histogram**: Difference between MACD line and signal line
- **Purpose**: Identifies trend direction, momentum strength, and potential reversals
### Key Features
#### 1. **Enhanced MACD Display**
**Three Core Components:**
**MACD Line** (Default: Blue/Orange, 2px)
- Fast EMA (13) minus Slow EMA (34)
- Shows momentum direction
- Color changes based on position relative to signal line:
- Blue: Above signal line (bullish)
- Orange: Below signal line (bearish)
- Can be toggled on/off
**Signal Line** (Default: White/Blue with transparency, 2px)
- EMA (9) of the MACD line
- Serves as trigger line for crossover signals
- Color varies based on settings
- Essential for identifying entry/exit points
**Histogram** (Default: 4-color gradient, 4px columns)
- Difference between MACD and signal line
- Visual representation of momentum strength
- Advanced 4-color scheme:
- **Dark Green (#26A69A)**: Positive and increasing (strong bullish)
- **Light Green (#B2DFDB)**: Positive but decreasing (weakening bullish)
- **Dark Red (#FF5252)**: Negative and decreasing (strong bearish)
- **Light Red (#FFCDD2)**: Negative but increasing (weakening bearish)
- Histogram tells the "story" of momentum changes
#### 2. **Customizable Moving Average Types**
**Oscillator MA Type** (MACD Line calculation):
- **EMA** (Exponential) - Default, more responsive
- **SMA** (Simple) - Smoother, less responsive
**Signal Line MA Type**:
- **EMA** (Exponential) - Default, faster signals
- **SMA** (Simple) - Slower, fewer false signals
**Flexibility**: Mix and match for different trading styles
- EMA/EMA: Most responsive (day trading)
- SMA/SMA: Smoothest (swing trading)
- EMA/SMA or SMA/EMA: Balanced approaches
#### 3. **Multi-Timeframe Capability**
**Current Chart Period** (Default: Enabled)
- Uses current timeframe automatically
- Simplest option for most traders
**Custom Timeframe Selection**
- Calculate MACD on any timeframe
- Display higher timeframe MACD on lower timeframe charts
- Example: View 1H MACD on 15min chart
- **Use Case**: Align lower timeframe trades with higher timeframe momentum
#### 4. **Visual Enhancement Features**
**Golden Cross / Death Cross Markers**
- Circles mark crossover points
- Color matches MACD line color
- Clearly identifies entry/exit signals
- Can be toggled on/off
**Zero Line** (White, 2px solid)
- Reference for positive/negative momentum
- Critical level for trend identification
- MACD above zero = Bullish bias
- MACD below zero = Bearish bias
**Color Transitions**
- MACD line changes color at signal line crosses
- Histogram shows momentum acceleration/deceleration
- Provides early warning of trend changes
#### 5. **Dual Divergence Detection System**
This indicator features TWO separate divergence detection systems:
**A. Histogram Divergence Detection**
- **Purpose**: Earlier divergence signals (most sensitive)
- **Detects**: Regular bullish and bearish divergences
- **Label**: "H涨" (Histogram Up), "H跌" (Histogram Down)
- **Special Feature**: Same-sign requirement option
- Top divergence: Both histogram points must be positive
- Bottom divergence: Both histogram points must be negative
- Filters out less reliable divergences
**B. MACD Line Divergence Detection**
- **Purpose**: Stronger, more reliable divergences
- **Detects**: Regular bullish and bearish divergences
- **Label**: "M涨" (MACD Up), "M跌" (MACD Down)
- **Use**: Confirmation of histogram divergences or standalone
**Divergence Types Explained:**
**Regular Bullish Divergence (Yellow)**
- **Price**: Lower lows
- **Indicator**: Higher lows (histogram OR MACD line)
- **Signal**: Potential upward reversal
- **Best**: Near support levels, oversold conditions
- **Entry**: After price breaks above recent resistance
**Regular Bearish Divergence (Blue)**
- **Price**: Higher highs
- **Indicator**: Lower highs (histogram OR MACD line)
- **Signal**: Potential downward reversal
- **Best**: Near resistance levels, overbought conditions
- **Entry**: After price breaks below recent support
#### 6. **Advanced Divergence Parameters**
**Histogram Divergence Settings:**
- **Price Reference**: Wicks (default) or Bodies
- **Right Lookback**: Bars to right of pivot (default: 2)
- **Left Lookback**: Bars to left of pivot (default: 5)
- **Max Range**: Maximum bars between divergences (default: 60)
- **Min Range**: Minimum bars between divergences (default: 5)
- **Same Sign Requirement**: Ensures both histogram points have same sign
- **Show Regular Divergence**: Toggle display
- **Show Labels**: Toggle divergence labels
**MACD Line Divergence Settings:**
- **Price Reference**: Wicks (default) or Bodies
- **Right Lookback**: Bars to right of pivot (default: 1)
- **Left Lookback**: Bars to left of pivot (default: 5)
- **Max Range**: Maximum bars between divergences (default: 60)
- **Min Range**: Minimum bars between divergences (default: 5)
- **Show Regular Divergence**: Toggle display
- **Show Labels**: Toggle divergence labels
**Independent Control**: Adjust histogram and MACD line divergences separately
### Configuration Settings
#### MACD Basic Settings
- **Fast EMA Period**: Fast moving average length (default: 13)
- **Slow EMA Period**: Slow moving average length (default: 34)
- **Signal Line Period**: Signal line length (default: 9)
- **Use Current Chart Period**: Auto-adjust to current timeframe
- **Select Period**: Choose custom timeframe
- **Show MACD & Signal Lines**: Toggle lines display
- **Show Cross Markers**: Toggle golden/death cross dots
- **Show Histogram**: Toggle histogram display
- **Show Crossover Color Change**: Enable MACD line color change
- **Show Histogram Colors**: Enable 4-color histogram scheme
- **Oscillator MA Type**: Choose SMA or EMA for MACD
- **Signal Line MA Type**: Choose SMA or EMA for signal
#### Histogram Divergence Settings
- **Show Histogram Divergence**: Enable histogram divergence detection
- **Price Reference**: Wicks or Bodies for price comparison
- **Right/Left Lookback**: Pivot detection parameters
- **Max/Min Range**: Distance constraints between pivots
- **Show Regular Divergence**: Display histogram divergence lines
- **Show Labels**: Display histogram divergence labels
- **Require Same Sign**: Enforce histogram sign consistency
#### MACD Line Divergence Settings
- **Show MACD Line Divergence**: Enable MACD line divergence detection
- **Price Reference**: Wicks or Bodies for price comparison
- **Right/Left Lookback**: Pivot detection parameters
- **Max/Min Range**: Distance constraints between pivots
- **Show Regular Divergence**: Display MACD line divergence lines
- **Show Labels**: Display MACD line divergence labels
### How to Use
#### For Basic Trend Following
1. **Enable Core Components**
- MACD line, signal line, and histogram
- Enable cross markers
2. **Identify Trend**
- MACD above zero = Uptrend
- MACD below zero = Downtrend
3. **Watch for Crossovers**
- Golden cross (MACD crosses above signal) = Buy signal
- Death cross (MACD crosses below signal) = Sell signal
4. **Confirm with Histogram**
- Increasing histogram = Strengthening trend
- Decreasing histogram = Weakening trend
#### For Divergence Trading
1. **Enable Both Divergence Systems**
- Histogram divergence (early signals)
- MACD line divergence (confirmation)
2. **Wait for Divergence Signals**
- "H涨" or "H跌" = Early warning
- "M涨" or "M跌" = Confirmation
3. **Best Divergences**
- Both histogram AND MACD line showing divergence
- Divergence at key support/resistance levels
- Multiple divergences on same trend
4. **Entry Timing**
- Wait for price structure break
- Enter on pullback after confirmation
- Use MACD crossover as trigger
#### For Multi-Timeframe Analysis
1. **Set Higher Timeframe**
- Example: 4H MACD on 1H chart
- Uncheck "Use Current Chart Period"
- Select desired timeframe
2. **Identify Higher TF Trend**
- MACD position relative to zero
- MACD vs signal line relationship
3. **Trade with HTF Direction**
- Only take long signals if HTF MACD bullish
- Only take short signals if HTF MACD bearish
4. **Use Current TF for Entries**
- Higher TF for bias
- Current TF for precise timing
#### For Histogram Analysis
1. **Enable 4-Color Histogram**
- Watch color transitions
- Dark colors = Strong momentum
- Light colors = Weakening momentum
2. **Momentum Stages**
- Dark green → Light green = Bullish losing steam
- Light red → Dark red = Bearish gaining strength
3. **Trade Transitions**
- Light green to light red = Momentum shift (potential reversal)
- Entry on confirmation crossover
### Trading Strategies
#### Strategy 1: Classic MACD Crossover
**Setup:**
- Standard settings (13/34/9)
- Enable MACD, signal line, and cross markers
- Clear trend on higher timeframe
**Entry:**
- **Long**: Golden cross (circle marker) above zero line
- **Short**: Death cross (circle marker) below zero line
**Confirmation:**
- Histogram color supporting direction
- Volume increase helps
**Stop Loss:**
- Below recent swing low (long)
- Above recent swing high (short)
**Exit:**
- Opposite crossover
- MACD crosses zero line against position
**Best For:** Trend following, clear trending markets
#### Strategy 2: Zero Line Bounce
**Setup:**
- Enable all components
- Established trend (MACD staying one side of zero)
- Wait for pullback to zero line
**Entry:**
- **Long**: MACD touches zero from above, bounces up with golden cross
- **Short**: MACD touches zero from below, bounces down with death cross
**Confirmation:**
- Histogram color change
- Price at support/resistance
**Stop Loss:**
- Just beyond zero line (opposite side)
**Exit:**
- Target previous extreme
- Or opposite crossover
**Best For:** Trend continuation, strong markets
#### Strategy 3: Dual Divergence Confirmation
**Setup:**
- Enable both histogram and MACD line divergences
- Price at extreme (high/low)
- Wait for divergence signals
**Entry:**
- **Long**: Both "H涨" AND "M涨" labels appear
- **Short**: Both "H跌" AND "M跌" labels appear
**Confirmation:**
- Price breaks structure
- Volume increase
- Golden/death cross confirms
**Stop Loss:**
- Beyond divergence pivot point
**Exit:**
- MACD crosses zero line
- Or opposite divergence appears
**Best For:** Reversal trading, swing trading
#### Strategy 4: Histogram Color Transition
**Setup:**
- Enable 4-color histogram
- Focus on color changes
- Price in trend
**Entry:**
- **Long**: Light red → Light green transition + golden cross
- **Short**: Light green → Light red transition + death cross
**Rationale:**
- Light colors show momentum exhaustion
- Color flip = momentum shift
- Early entry before full trend reversal
**Stop Loss:**
- Recent swing point
**Exit:**
- Histogram color turns light against position
- Or at predetermined target
**Best For:** Scalping, day trading, early entries
#### Strategy 5: Multi-Timeframe Momentum
**Setup:**
- Display higher timeframe MACD (e.g., 4H on 1H chart)
- Current chart shows current momentum
- Higher TF shows overall bias
**Entry:**
- **Long**: HTF MACD above zero + current TF golden cross
- **Short**: HTF MACD below zero + current TF death cross
**Confirmation:**
- HTF histogram supporting direction
- Both timeframes aligned
**Stop Loss:**
- Based on current timeframe structure
**Exit:**
- Current TF opposite crossover
- Or HTF MACD momentum weakens
**Best For:** Swing trading, high-probability setups
#### Strategy 6: Histogram-Only Divergence Scout
**Setup:**
- Enable only histogram divergence
- Use "same sign requirement"
- Focus on early signals
**Entry:**
- **Long**: "H涨" label + price at support
- **Short**: "H跌" label + price at resistance
**Confirmation:**
- Wait for MACD/signal crossover
- Or price structure break
**Advantage:**
- Earliest divergence signals
- Get in before crowd
**Risk:**
- More false signals than MACD line divergence
- Requires strict confirmation
**Stop Loss:**
- Tight stop beyond entry bar
**Exit:**
- Quick targets (30-50% of expected move)
- Or trail stop
**Best For:** Active traders, scalpers seeking early entries
### Best Practices
#### MACD Period Selection
**Standard (13/34/9)** - Default
- Balanced for most markets
- Good for day trading and swing trading
- Widely used, works with general market psychology
**Faster (8/21/5 or 12/26/9)**
- More responsive
- More signals, more noise
- Best for: Scalping, volatile markets
- Risk: More false signals
**Slower (21/55/13)**
- Smoother signals
- Fewer but stronger signals
- Best for: Swing trading, position trading
- Benefit: Higher reliability
#### Histogram vs MACD Line Divergences
**Histogram Divergence:**
- ✅ Earlier signals
- ✅ Catch moves before others
- ❌ More false signals
- ❌ Requires confirmation
- **Best for**: Active traders, scalpers
**MACD Line Divergence:**
- ✅ More reliable
- ✅ Stronger divergences
- ❌ Later signals
- ❌ May miss early moves
- **Best for**: Swing traders, conservative traders
**Both Together:**
- ✅ Maximum confidence
- ✅ Histogram for alert, MACD for confirmation
- ✅ Highest probability setups
- **Best for**: All traders seeking quality over quantity
#### Same Sign Requirement Feature
**Enabled (Recommended):**
- Filters low-quality divergences
- Top divergence: Both histogram points positive
- Bottom divergence: Both histogram points negative
- Results in fewer but more reliable signals
**Disabled:**
- More divergence signals
- Includes zero-line crossing divergences
- Higher false signal rate
- Only for experienced traders
#### Price Reference: Wicks vs Bodies
**Wicks (Default):**
- Uses high/low prices
- Catches all extremes
- More divergences detected
- Best for: Most trading styles
**Bodies:**
- Uses open/close prices
- Filters out spike movements
- Fewer but cleaner divergences
- Best for: Noisy markets, crypto
#### Visual Settings Recommendations
**For Beginners:**
- Enable: MACD line, signal line, histogram
- Enable: Cross markers
- Enable: Histogram colors
- Disable: Both divergence systems initially
- Focus: Learn basic crossovers first
**For Intermediate:**
- All basic components
- Add: Histogram divergence only
- Use: Same sign requirement
- Focus: Early reversal signals
**For Advanced:**
- All components
- Both divergence systems
- Custom parameters per market
- Multi-timeframe analysis
- Focus: High-probability confluence setups
### Indicator Combinations
**With Moving Averages (EMAs):**
- EMAs (21/55/144) show trend
- MACD shows momentum
- Enter when both align
- Exit when MACD turns first
**With RSI:**
- RSI for overbought/oversold
- MACD for momentum confirmation
- Divergence on both = Extremely strong signal
- RSI + MACD divergence = High probability trade
**With Volume:**
- Volume confirms MACD signals
- Crossover + volume spike = Valid breakout
- Divergence + volume divergence = Strong reversal
**With Support/Resistance:**
- S/R levels for entry/exit targets
- MACD divergence at levels = Highest probability
- MACD crossover at level = Strong confirmation
**With Bias Indicator:**
- Bias shows price deviation from EMA
- MACD shows momentum
- Both diverging = Powerful reversal signal
- Bias extreme + MACD divergence = High conviction trade
**With OBV:**
- OBV shows volume trend
- MACD shows price momentum
- OBV + MACD divergence = Volume not supporting price
- Strong reversal indication
**With KSI (RSI/CCI):**
- KSI for oscillator extremes
- MACD for momentum direction
- KSI extreme + MACD divergence = Reversal likely
- All aligned = Maximum confidence
### Common MACD Patterns
1. **Bullish Cross Above Zero**: Strong uptrend continuation signal
2. **Bearish Cross Below Zero**: Strong downtrend continuation signal
3. **Zero Line Rejection**: Price respects zero as support/resistance
4. **Histogram Peak**: Momentum climax, watch for reversal
5. **Double Divergence**: Two divergences without reversal = Very strong signal when it finally reverses
6. **Histogram Convergence**: Histogram narrowing = Trend losing steam
7. **Signal Line Hug**: MACD stays close to signal = Consolidation, expect breakout
### Performance Tips
- Start with default settings (13/34/9 EMA/EMA)
- Test one divergence system at a time
- Use same sign requirement initially
- Enable cross markers for clear signals
- Adjust lookback parameters per market volatility
- Higher timeframe MACD more reliable than lower
- Combine histogram early signal with MACD line confirmation
- Don't trade every divergence - wait for best setups
### Alert Conditions
While not explicitly coded, you can set custom alerts on:
- MACD crossing above/below signal line
- MACD crossing above/below zero line
- Histogram crossing zero
- When divergence labels appear (using visual alerts)
---
## 中文说明文档
### 概述
Scout Regiment - MACD 是移动平均线收敛发散指标的高级实现版本,具有增强功能,包括双重背离检测(直方图和MACD线)、可自定义的移动平均类型、多时间框架分析和复杂的视觉元素。该指标为交易者提供全面的动量分析和高概率反转信号。
### 什么是MACD?
MACD(移动平均线收敛发散)是一个趋势跟随动量指标,显示两条移动平均线之间的关系:
- **MACD线**:快速和慢速EMA之间的差值
- **信号线**:MACD线的移动平均
- **直方图**:MACD线和信号线之间的差值
- **用途**:识别趋势方向、动量强度和潜在反转
### 核心功能
#### 1. **增强的MACD显示**
**三个核心组件:**
**MACD线**(默认:蓝色/橙色,2像素)
- 快速EMA(13)减去慢速EMA(34)
- 显示动量方向
- 根据相对于信号线的位置改变颜色:
- 蓝色:信号线上方(看涨)
- 橙色:信号线下方(看跌)
- 可开关显示
**信号线**(默认:白色/蓝色带透明度,2像素)
- MACD线的EMA(9)
- 作为交叉信号的触发线
- 颜色根据设置变化
- 识别进出场点的关键
**直方图**(默认:4色渐变,4像素柱)
- MACD和信号线之间的差值
- 动量强度的视觉表示
- 高级4色方案:
- **深绿色(#26A69A)**:正值且增加(强劲看涨)
- **浅绿色(#B2DFDB)**:正值但减少(看涨减弱)
- **深红色(#FF5252)**:负值且减少(强劲看跌)
- **浅红色(#FFCDD2)**:负值但增加(看跌减弱)
- 直方图讲述动量变化的"故事"
#### 2. **可自定义的移动平均类型**
**振荡器MA类型**(MACD线计算):
- **EMA**(指数)- 默认,反应更快
- **SMA**(简单)- 更平滑,反应较慢
**信号线MA类型**:
- **EMA**(指数)- 默认,更快信号
- **SMA**(简单)- 更慢,假信号更少
**灵活性**:混合搭配以适应不同交易风格
- EMA/EMA:最灵敏(日内交易)
- SMA/SMA:最平滑(波段交易)
- EMA/SMA或SMA/EMA:平衡方法
#### 3. **多时间框架功能**
**当前图表周期**(默认:启用)
- 自动使用当前时间框架
- 大多数交易者的最简单选项
**自定义时间框架选择**
- 在任何时间框架上计算MACD
- 在低时间框架图表上显示高时间框架MACD
- 示例:在15分钟图上查看1小时MACD
- **使用场景**:使低时间框架交易与高时间框架动量保持一致
#### 4. **视觉增强功能**
**金叉/死叉标记**
- 圆点标记交叉点
- 颜色与MACD线颜色匹配
- 清晰识别进出场信号
- 可开关
**零线**(白色,2像素实线)
- 正负动量的参考
- 趋势识别的关键水平
- MACD在零线上方 = 看涨偏向
- MACD在零线下方 = 看跌偏向
**颜色转换**
- MACD线在信号线交叉处改变颜色
- 直方图显示动量加速/减速
- 提供趋势变化的早期警告
#### 5. **双重背离检测系统**
该指标具有两个独立的背离检测系统:
**A. 直方图背离检测**
- **用途**:更早的背离信号(最敏感)
- **检测**:常规看涨和看跌背离
- **标签**:"H涨"(直方图上涨)、"H跌"(直方图下跌)
- **特殊功能**:同符号要求选项
- 顶背离:两个直方图点都必须为正
- 底背离:两个直方图点都必须为负
- 过滤不太可靠的背离
**B. MACD线背离检测**
- **用途**:更强、更可靠的背离
- **检测**:常规看涨和看跌背离
- **标签**:"M涨"(MACD上涨)、"M跌"(MACD下跌)
- **用途**:确认直方图背离或独立使用
**背离类型说明:**
**常规看涨背离(黄色)**
- **价格**:更低的低点
- **指标**:更高的低点(直方图或MACD线)
- **信号**:潜在向上反转
- **最佳**:在支撑水平附近、超卖状况
- **入场**:价格突破近期阻力后
**常规看跌背离(蓝色)**
- **价格**:更高的高点
- **指标**:更低的高点(直方图或MACD线)
- **信号**:潜在向下反转
- **最佳**:在阻力水平附近、超买状况
- **入场**:价格跌破近期支撑后
#### 6. **高级背离参数**
**直方图背离设置:**
- **价格参考**:影线(默认)或实体
- **右侧回溯**:枢轴点右侧K线数(默认:2)
- **左侧回溯**:枢轴点左侧K线数(默认:5)
- **最大范围**:背离之间最大K线数(默认:60)
- **最小范围**:背离之间最小K线数(默认:5)
- **同符号要求**:确保两个直方图点符号相同
- **显示常规背离**:切换显示
- **显示标签**:切换背离标签
**MACD线背离设置:**
- **价格参考**:影线(默认)或实体
- **右侧回溯**:枢轴点右侧K线数(默认:1)
- **左侧回溯**:枢轴点左侧K线数(默认:5)
- **最大范围**:背离之间最大K线数(默认:60)
- **最小范围**:背离之间最小K线数(默认:5)
- **显示常规背离**:切换显示
- **显示标签**:切换背离标签
**独立控制**:分别调整直方图和MACD线背离
### 配置设置
#### MACD基础设置
- **快速EMA周期**:快速移动平均长度(默认:13)
- **慢速EMA周期**:慢速移动平均长度(默认:34)
- **信号线周期**:信号线长度(默认:9)
- **使用当前图表周期**:自动调整到当前时间框架
- **选择周期**:选择自定义时间框架
- **显示MACD线和信号线**:切换线条显示
- **显示金叉死叉圆点标记**:切换金叉/死叉圆点
- **显示直方图**:切换直方图显示
- **显示穿越变化MACD线**:启用MACD线颜色变化
- **显示直方图颜色**:启用4色直方图方案
- **振荡器MA类型**:为MACD选择SMA或EMA
- **信号线MA类型**:为信号线选择SMA或EMA
#### 直方图背离设置
- **显示直方图背离信号**:启用直方图背离检测
- **价格参考**:影线或实体用于价格比较
- **右侧/左侧回溯**:枢轴检测参数
- **最大/最小范围**:枢轴之间的距离约束
- **显示直方图常规背离**:显示直方图背离线
- **显示直方图常规背离标签**:显示直方图背离标签
- **要求背离点柱状图同符号**:强制直方图符号一致性
#### MACD线背离设置
- **显示MACD线背离信号**:启用MACD线背离检测
- **价格参考**:影线或实体用于价格比较
- **右侧/左侧回溯**:枢轴检测参数
- **最大/最小范围**:枢轴之间的距离约束
- **显示线常规背离**:显示MACD线背离线
- **显示线常规背离标签**:显示MACD线背离标签
### 使用方法
#### 基础趋势跟随
1. **启用核心组件**
- MACD线、信号线和直方图
- 启用交叉标记
2. **识别趋势**
- MACD在零线上方 = 上升趋势
- MACD在零线下方 = 下降趋势
3. **观察交叉**
- 金叉(MACD向上穿越信号线)= 买入信号
- 死叉(MACD向下穿越信号线)= 卖出信号
4. **用直方图确认**
- 直方图增加 = 趋势加强
- 直方图减少 = 趋势减弱
#### 背离交易
1. **启用两个背离系统**
- 直方图背离(早期信号)
- MACD线背离(确认)
2. **等待背离信号**
- "H涨"或"H跌" = 早期警告
- "M涨"或"M跌" = 确认
3. **最佳背离**
- 直方图和MACD线都显示背离
- 在关键支撑/阻力水平的背离
- 同一趋势上多个背离
4. **入场时机**
- 等待价格结构突破
- 确认后回调时进入
- 使用MACD交叉作为触发
#### 多时间框架分析
1. **设置更高时间框架**
- 示例:在1小时图上显示4小时MACD
- 取消勾选"使用当前图表周期"
- 选择所需时间框架
2. **识别更高TF趋势**
- MACD相对于零线的位置
- MACD与信号线的关系
3. **顺HTF方向交易**
- 仅在HTF MACD看涨时接受多头信号
- 仅在HTF MACD看跌时接受空头信号
4. **使用当前TF入场**
- 更高TF确定偏向
- 当前TF精确定时
#### 直方图分析
1. **启用4色直方图**
- 观察颜色转换
- 深色 = 强动量
- 浅色 = 动量减弱
2. **动量阶段**
- 深绿色→浅绿色 = 看涨失去动力
- 浅红色→深红色 = 看跌获得力量
3. **交易转换**
- 浅绿色到浅红色 = 动量转变(潜在反转)
- 确认交叉时入场
### 交易策略
#### 策略1:经典MACD交叉
**设置:**
- 标准设置(13/34/9)
- 启用MACD、信号线和交叉标记
- 更高时间框架明确趋势
**入场:**
- **多头**:零线上方金叉(圆点标记)
- **空头**:零线下方死叉(圆点标记)
**确认:**
- 直方图颜色支持方向
- 成交量增加有帮助
**止损:**
- 近期波动低点之下(多头)
- 近期波动高点之上(空头)
**离场:**
- 相反交叉
- MACD反向穿越零线
**适合:**趋势跟随、明确趋势市场
#### 策略2:零线反弹
**设置:**
- 启用所有组件
- 已建立趋势(MACD保持在零线一侧)
- 等待回调至零线
**入场:**
- **多头**:MACD从上方触及零线,向上反弹并金叉
- **空头**:MACD从下方触及零线,向下反弹并死叉
**确认:**
- 直方图颜色变化
- 价格在支撑/阻力位
**止损:**
- 零线对面一侧
**离场:**
- 目标前一极值
- 或相反交叉
**适合:**趋势延续、强势市场
#### 策略3:双重背离确认
**设置:**
- 启用直方图和MACD线背离
- 价格在极值(高点/低点)
- 等待背离信号
**入场:**
- **多头**:"H涨"和"M涨"标签都出现
- **空头**:"H跌"和"M跌"标签都出现
**确认:**
- 价格突破结构
- 成交量增加
- 金叉/死叉确认
**止损:**
- 背离枢轴点之外
**离场:**
- MACD穿越零线
- 或出现相反背离
**适合:**反转交易、波段交易
#### 策略4:直方图颜色转换
**设置:**
- 启用4色直方图
- 关注颜色变化
- 价格处于趋势
**入场:**
- **多头**:浅红色→浅绿色转换 + 金叉
- **空头**:浅绿色→浅红色转换 + 死叉
**原理:**
- 浅色显示动量衰竭
- 颜色翻转 = 动量转变
- 完全趋势反转前的早期入场
**止损:**
- 近期波动点
**离场:**
- 直方图颜色变为反向浅色
- 或预定目标
**适合:**剥头皮、日内交易、早期入场
#### 策略5:多时间框架动量
**设置:**
- 显示更高时间框架MACD(例如,在1小时图上显示4小时)
- 当前图表显示当前动量
- 更高TF显示整体偏向
**入场:**
- **多头**:HTF MACD在零线上方 + 当前TF金叉
- **空头**:HTF MACD在零线下方 + 当前TF死叉
**确认:**
- HTF直方图支持方向
- 两个时间框架对齐
**止损:**
- 基于当前时间框架结构
**离场:**
- 当前TF相反交叉
- 或HTF MACD动量减弱
**适合:**波段交易、高概率设置
#### 策略6:仅直方图背离侦察
**设置:**
- 仅启用直方图背离
- 使用"同符号要求"
- 关注早期信号
**入场:**
- **多头**:"H涨"标签 + 价格在支撑位
- **空头**:"H跌"标签 + 价格在阻力位
**确认:**
- 等待MACD/信号线交叉
- 或价格结构突破
**优势:**
- 最早的背离信号
- 在大众之前进入
**风险:**
- 比MACD线背离假信号更多
- 需要严格确认
**止损:**
- 入场K线之外紧密止损
**离场:**
- 快速目标(预期波动的30-50%)
- 或移动止损
**适合:**活跃交易者、寻求早期入场的剥头皮交易者
### 最佳实践
#### MACD周期选择
**标准(13/34/9)** - 默认
- 大多数市场的平衡
- 适合日内交易和波段交易
- 广泛使用,符合一般市场心理
**更快(8/21/5或12/26/9)**
- 更灵敏
- 更多信号,更多噪音
- 最适合:剥头皮、波动市场
- 风险:更多假信号
**更慢(21/55/13)**
- 更平滑的信号
- 信号较少但更强
- 最适合:波段交易、仓位交易
- 优势:更高可靠性
#### 直方图vs MACD线背离
**直方图背离:**
- ✅ 更早信号
- ✅ 在其他人之前捕捉波动
- ❌ 更多假信号
- ❌ 需要确认
- **最适合**:活跃交易者、剥头皮交易者
**MACD线背离:**
- ✅ 更可靠
- ✅ 更强的背离
- ❌ 信号较晚
- ❌ 可能错过早期波动
- **最适合**:波段交易者、保守交易者
**两者结合:**
- ✅ 最大信心
- ✅ 直方图警报,MACD确认
- ✅ 最高概率设置
- **最适合**:所有寻求质量而非数量的交易者
#### 同符号要求功能
**启用(推荐):**
- 过滤低质量背离
- 顶背离:两个直方图点都为正
- 底背离:两个直方图点都为负
- 产生更少但更可靠的信号
**禁用:**
- 更多背离信号
- 包括零线穿越背离
- 假信号率更高
- 仅适合有经验的交易者
#### 价格参考:影线vs实体
**影线(默认):**
- 使用最高/最低价
- 捕捉所有极值
- 检测到更多背离
- 最适合:大多数交易风格
**实体:**
- 使用开盘/收盘价
- 过滤突刺波动
- 背离更少但更干净
- 最适合:噪音市场、加密货币
#### 视觉设置建议
**新手:**
- 启用:MACD线、信号线、直方图
- 启用:交叉标记
- 启用:直方图颜色
- 禁用:初始禁用两个背离系统
- 重点:先学习基本交叉
**中级:**
- 所有基本组件
- 添加:仅直方图背离
- 使用:同符号要求
- 重点:早期反转信号
**高级:**
- 所有组件
- 两个背离系统
- 每个市场自定义参数
- 多时间框架分析
- 重点:高概率汇合设置
### 指标组合
**与移动平均线(EMA)配合:**
- EMA(21/55/144)显示趋势
- MACD显示动量
- 两者一致时进入
- MACD先转向时退出
**与RSI配合:**
- RSI用于超买超卖
- MACD用于动量确认
- 两者都背离 = 极强信号
- RSI + MACD背离 = 高概率交易
**与成交量配合:**
- 成交量确认MACD信号
- 交叉 + 成交量激增 = 有效突破
- 背离 + 成交量背离 = 强反转
**与支撑/阻力配合:**
- 支撑阻力水平用于进出目标
- 水平处的MACD背离 = 最高概率
- 水平处的MACD交叉 = 强确认
**与Bias指标配合:**
- Bias显示价格相对EMA的偏离
- MACD显示动量
- 两者都背离 = 强大反转信号
- Bias极值 + MACD背离 = 高信念交易
**与OBV配合:**
- OBV显示成交量趋势
- MACD显示价格动量
- OBV + MACD背离 = 成交量不支持价格
- 强反转迹象
**与KSI(RSI/CCI)配合:**
- KSI用于振荡器极值
- MACD用于动量方向
- KSI极值 + MACD背离 = 可能反转
- 全部对齐 = 最大信心
### 常见MACD形态
1. **零线上方看涨交叉**:强上升趋势延续信号
2. **零线下方看跌交叉**:强下降趋势延续信号
3. **零线拒绝**:价格将零线作为支撑/阻力
4. **直方图峰值**:动量高潮,注意反转
5. **双重背离**:两次背离未反转 = 最终反转时非常强
6. **直方图收敛**:直方图变窄 = 趋势失去动力
7. **信号线紧贴**:MACD紧贴信号线 = 盘整,预期突破
### 性能提示
- 从默认设置开始(13/34/9 EMA/EMA)
- 一次测试一个背离系统
- 初始使用同符号要求
- 启用交叉标记以获得清晰信号
- 根据市场波动性调整回溯参数
- 更高时间框架MACD比更低的更可靠
- 结合直方图早期信号与MACD线确认
- 不要交易每个背离 - 等待最佳设置
### 警报条件
虽然没有明确编码,但您可以设置自定义警报:
- MACD向上/向下穿越信号线
- MACD向上/向下穿越零线
- 直方图穿越零线
- 背离标签出现时(使用视觉警报)
---
## Technical Support
For questions or issues, please refer to the TradingView community or contact the indicator creator.
## 技术支持
如有问题,请参考TradingView社区或联系指标创建者。

Scout Regiment - D17# Scout Regiment - D17 Indicator
## English Documentation
### Overview
Scout Regiment - D17 is a comprehensive TradingView indicator that combines multiple technical analysis tools into one powerful overlay indicator. It provides traders with market structure analysis, divergence detection, volume profiling, smart money concepts, and session analysis.
### Key Features
#### 1. **EMA (Exponential Moving Averages)**
- **Purpose**: Trend identification and dynamic support/resistance levels
- **Configuration**: 13 customizable EMAs with adjustable periods
- **Default Active EMAs**: EMA 3 (21), EMA 5 (55), EMA 7 (144), EMA 8 (233)
- **Uses**: Identify trend direction, entry/exit points, and trend strength
- **Color Coding**: Different colors for easy visual distinction
#### 2. **TFMA (Timeframe Moving Averages)**
- **Purpose**: Multi-timeframe trend analysis
- **Features**:
- 3 EMAs on higher timeframes
- Dynamic labels showing trend direction
- Price difference percentage display
- Customizable timeframe settings
- **Default Settings**: 21-period timeframe with lengths 55, 144, and 233
- **Benefits**: Align trades with higher timeframe trends
#### 3. **DFMA (Daily Frame Moving Averages)**
- **Purpose**: Daily timeframe perspective on any chart
- **Features**: Similar to TFMA but specifically for daily analysis
- **Default Timeframe**: 1D (Daily)
- **Use Case**: Long-term trend confirmation and positioning
#### 4. **PMA (Price Moving Averages)**
- **Purpose**: Price channel analysis with filled areas
- **Configuration**: 7 customizable moving averages with fill zones
- **Default Lengths**: 12, 144, 169, 288, 338, 576, 676
- **Visual**: Color-filled zones between selected MAs for channel trading
#### 5. **VWAP (Volume Weighted Average Price)**
- **Purpose**: Institutional trading levels and fair value
- **Features**:
- Multiple anchor periods (Session, Week, Month, Quarter, Year, etc.)
- Standard deviation bands
- Corporate event anchoring (Earnings, Dividends, Splits)
- **Use Case**: Identify institutional support/resistance and mean reversion opportunities
#### 6. **Divergence Detector**
- **Purpose**: Identify potential trend reversals
- **Supported Indicators**: MACD, MACD Histogram, RSI, Stochastic, CCI, Williams %R, Bias, Momentum, OBV, SOBV, VWmacd, CMF, MFI, and external indicators
- **Divergence Types**:
- Regular Bullish/Bearish
- Hidden Bullish/Bearish
- **Features**:
- Automatic divergence line drawing
- Customizable detection parameters
- Color-coded alerts
#### 7. **Volume Profile & Node Detection**
- **Purpose**: Identify key price levels based on volume distribution
- **Features**:
- Volume Profile with POC (Point of Control)
- Value Area High (VAH) and Value Area Low (VAL)
- Peak and trough volume node detection
- Highest/lowest volume node highlighting
- **Lookback**: Configurable (default 377 bars)
- **Use Case**: Identify support/resistance zones and liquidity areas
#### 8. **Smart Money Concepts**
- **Purpose**: Track institutional trading patterns
- **Features**:
- Market Structure (BOS - Break of Structure, CHoCH - Change of Character)
- Internal and Swing structures
- Strong/Weak Highs and Lows
- Equal Highs/Lows detection
- Fair Value Gaps (FVG)
- **Modes**: Historical or Present (latest only)
- **Use Case**: Trade with institutional flow
#### 9. **Trading Sessions**
- **Purpose**: Analyze market behavior during different global sessions
- **Available Sessions**:
- Asian Session
- Sydney, Tokyo, Shanghai, Hong Kong
- European Session
- London, New York, NYSE
- **Features**:
- Session boxes with high/low visualization
- Real-time countdown timers
- Volume and price change tracking
- Information table with session statistics
- **Customization**: Choose which sessions to display, colors, and box styles
### How to Use
#### For Trend Following:
1. Enable EMAs 3, 5, 7, and 8
2. Use TFMA for higher timeframe confirmation
3. Look for price above/below key EMAs for trend direction
4. Use VWAP as additional confirmation
#### For Reversal Trading:
1. Enable Divergence Detector with MACD Histogram and Bias
2. Look for divergences at key support/resistance levels
3. Confirm with Smart Money CHoCH signals
4. Use Volume Profile nodes as entry/exit targets
#### For Intraday Trading:
1. Enable Trading Sessions
2. Focus on high-volume sessions (London, New York overlap)
3. Use session highs/lows as support/resistance
4. Trade Fair Value Gaps during active sessions
#### For Swing Trading:
1. Use DFMA for daily trend
2. Enable PMA for channel identification
3. Look for price reactions at volume profile value areas
4. Confirm with swing structure breaks
### Best Practices
1. **Don't Overcrowd**: Enable only the components you need for your strategy
2. **Multi-Timeframe Analysis**: Always check higher timeframe TFMA/DFMA
3. **Confluence**: Look for multiple signals confirming the same direction
4. **Volume Confirmation**: Use Volume Profile to validate price action
5. **Session Awareness**: Be aware of which session is active for volatility expectations
### Performance Optimization
- Disable unused features to improve chart loading speed
- Use "Present Mode" for Smart Money Concepts if historical data isn't needed
- Reduce Volume Profile lookback period on slower devices
### Alerts
The indicator includes alert conditions for:
- All divergence types (8 conditions)
- Smart Money structure breaks (8 conditions)
- Equal highs/lows detection
- Fair Value Gaps formation
---
## 中文说明文档
### 概述
Scout Regiment - D17 是一款综合性TradingView指标,将多个技术分析工具整合到一个强大的叠加指标中。它为交易者提供市场结构分析、背离检测、成交量分析、聪明钱概念和时区分析。
### 核心功能
#### 1. **EMA(指数移动平均线)**
- **用途**:趋势识别和动态支撑阻力位
- **配置**:13条可自定义周期的EMA
- **默认启用**:EMA 3(21)、EMA 5(55)、EMA 7(144)、EMA 8(233)
- **应用**:识别趋势方向、进出场点位和趋势强度
- **颜色编码**:不同颜色便于视觉区分
#### 2. **TFMA(时间框架移动平均线)**
- **用途**:多时间框架趋势分析
- **特点**:
- 3条更高时间框架的EMA
- 显示趋势方向的动态标签
- 价格差异百分比显示
- 可自定义时间框架设置
- **默认设置**:21周期时间框架,长度为55、144和233
- **优势**:使交易与更高时间框架趋势保持一致
#### 3. **DFMA(日线框架移动平均线)**
- **用途**:在任何图表上提供日线时间框架视角
- **特点**:与TFMA类似,但专门用于日线分析
- **默认时间框架**:1D(日线)
- **使用场景**:长期趋势确认和定位
#### 4. **PMA(价格移动平均线)**
- **用途**:价格通道分析与填充区域
- **配置**:7条可自定义的移动平均线,带填充区域
- **默认长度**:12、144、169、288、338、576、676
- **视觉效果**:选定MA之间的彩色填充区域,用于通道交易
#### 5. **VWAP(成交量加权平均价格)**
- **用途**:机构交易水平和公允价值
- **特点**:
- 多个锚定周期(交易日、周、月、季度、年等)
- 标准差波段
- 企业事件锚定(财报、分红、拆股)
- **使用场景**:识别机构支撑阻力和均值回归机会
#### 6. **背离检测器**
- **用途**:识别潜在趋势反转
- **支持指标**:MACD、MACD柱状图、RSI、随机指标、CCI、威廉指标、乖离率、动量、OBV、SOBV、VWmacd、CMF、MFI及外部指标
- **背离类型**:
- 常规看涨/看跌背离
- 隐藏看涨/看跌背离
- **特点**:
- 自动绘制背离连线
- 可自定义检测参数
- 颜色编码警报
#### 7. **成交量分布与节点检测**
- **用途**:基于成交量分布识别关键价格水平
- **特点**:
- 成交量分布图与POC(控制点)
- 价值区域高点(VAH)和低点(VAL)
- 峰值和低谷成交量节点检测
- 最高/最低成交量节点突出显示
- **回溯期**:可配置(默认377根K线)
- **使用场景**:识别支撑阻力区域和流动性区域
#### 8. **聪明钱概念**
- **用途**:追踪机构交易模式
- **特点**:
- 市场结构(BOS-突破结构、CHoCH-结构转变)
- 内部和摆动结构
- 强/弱高低点
- 等高/等低检测
- 公允价值缺口(FVG)
- **模式**:历史模式或当前模式(仅最新)
- **使用场景**:跟随机构资金流动交易
#### 9. **交易时区**
- **用途**:分析不同全球时段的市场行为
- **可用时段**:
- 亚洲时段
- 悉尼、东京、上海、香港
- 欧洲时段
- 伦敦、纽约、纽交所
- **特点**:
- 时段方框显示高低点
- 实时倒计时
- 成交量和价格变化追踪
- 时段统计信息表格
- **自定义**:选择显示哪些时段、颜色和方框样式
### 使用方法
#### 趋势跟随策略:
1. 启用EMA 3、5、7和8
2. 使用TFMA进行更高时间框架确认
3. 观察价格在关键EMA上方/下方确定趋势方向
4. 使用VWAP作为额外确认
#### 反转交易策略:
1. 启用背离检测器(MACD柱状图和乖离率)
2. 在关键支撑阻力位寻找背离
3. 用聪明钱CHoCH信号确认
4. 使用成交量分布节点作为进出场目标
#### 日内交易策略:
1. 启用交易时区
2. 关注高成交量时段(伦敦、纽约重叠时段)
3. 使用时段高低点作为支撑阻力
4. 在活跃时段交易公允价值缺口
#### 波段交易策略:
1. 使用DFMA确定日线趋势
2. 启用PMA识别通道
3. 观察价格在成交量分布价值区域的反应
4. 用摆动结构突破确认
### 最佳实践
1. **避免过度拥挤**:仅启用策略所需的组件
2. **多时间框架分析**:始终检查更高时间框架的TFMA/DFMA
3. **汇合点**:寻找多个信号确认同一方向
4. **成交量确认**:使用成交量分布验证价格行为
5. **时段意识**:了解当前活跃时段以预期波动性
### 性能优化
- 禁用未使用的功能以提高图表加载速度
- 如果不需要历史数据,对聪明钱概念使用"当前模式"
- 在较慢设备上减少成交量分布回溯期
### 警报
指标包含以下警报条件:
- 所有背离类型(8个条件)
- 聪明钱结构突破(8个条件)
- 等高/等低检测
- 公允价值缺口形成
---
## Technical Support
For questions or issues, please refer to the TradingView community or contact the indicator creator.
## 技术支持
如有问题,请参考TradingView社区或联系指标创建者。
