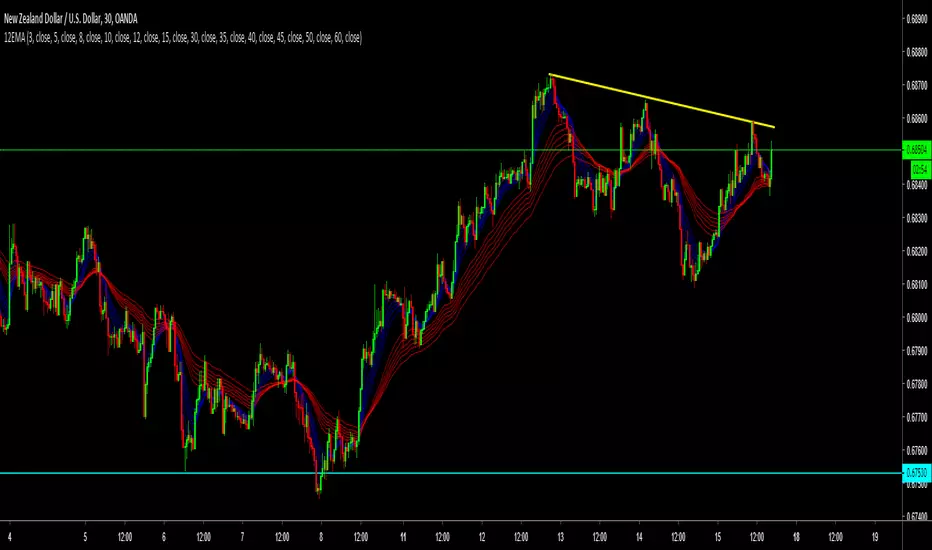
12 Exponential Moving Averages Guppy The Guppy Multiple Moving Average (GMMA). The short-term MAs are typically set at 3, 5, 8, 10, 12, and 15 periods. The longer-term MAs are typically set at 30, 35, 40, 45, 50, and 60.
ค้นหาในสคริปต์สำหรับ "12月4号是什么星座"
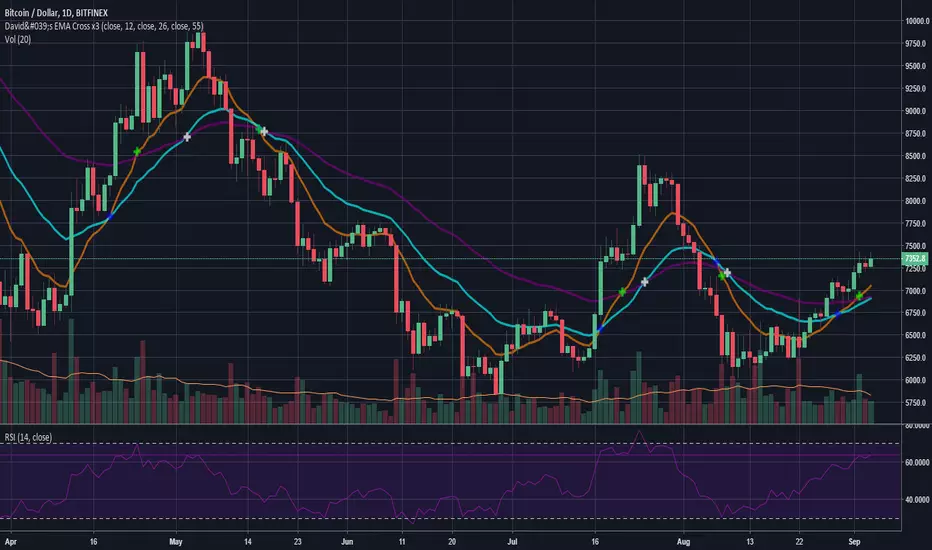
SMA/EMA 12|26|50SMA/EMA 12|26|50
Exactly as title says
SMA is bold
EMA is light
Orange 12
Green 26
Blue 50

12 Band Volume matched Candles📌 12 Band Volume matched Candles (Official Description)
12 Band Volume matched Candles is a next-generation volume-strength visualisation tool designed for traders who rely on precision, speed, and clarity.
Instead of colouring candles by price action or relative indicators, this script maps every candle to one of 12 absolute-volume strength bands, using real contract/share volume thresholds that you define.
No guessing.
No subjective smoothing.
No repainting.
Just pure, clean, calibrated volume pressure — visualised instantly.
🔥 Why This Indicator Exists
Traditional volume colouring is vague, delayed, or tied to assumptions (like moving averages).
Scalpers, orderflow watchers, and tape-readers all know the truth:
👉 The raw size of volume matters more than relative volume.
This tool removes all ambiguity and lets you define exact thresholds that match the behaviour of your market:
5k volume
10k volume
20k
35k
50k
70k
… all the way to
200k+ (or whatever instrument volume you want)
Those thresholds map to a 12-band spectrum, ranging from the coldest low-volume purples to the hottest high-volume reds.
The result?
A visual system that lets you read volume pressure instantly, the same way our RSI 12-band spectrum lets you read momentum immediately.
🎨 Premium 12-Band Colour Spectrum
This indicator uses the same refined colour spectrum as the In The Zone RSI – 12 Band script:
Weak Volume (Bands 1–6) – Cold Side
Ultra-dark violet
Deep purples
Cool blues
Light icy blue
Strong Volume (Bands 7–12) – Hot Side
Warm yellows
Oranges
Orange-reds
Deep maroons
Ultra-dark red for max volume
You instantly know:
When volume is dying
When volume is building
When a trend is being pushed
When a breakout has REAL participation
When a reversal is weak or strong
Your brain doesn’t need to “interpret” numbers — just read the colours.
⚙️ Key Features
✔ 12 Custom Volume Thresholds
Set exact volume values that match your instrument.
A perfect companion for multi-indicator visual alignment.
✔ Borders-Only Mode
Keep your chart clean and still read volume strength.
✔ Adjustable Brightness & Opacity
Fine-tune the aesthetic for dark or light chart themes.
✔ Legend Placement Options
Display the volume band legend in any corner of the chart.
✔ Zero Lag – Zero Repaint
Everything is based on historical volume — no tricks.
🚀 Who It’s For
This tool is extremely powerful for:
Scalpers
Momentum traders
Orderflow readers
Breakout traders
Reversal hunters
Algo / quant-style chart readers
Anyone who trades with candle-flow awareness
If you rely on the “feel” of a chart, volume rhythm, or momentum pressure — this indicator becomes a cheat-code.
🎯 Practical Uses
Spot when large players enter a move
Filter weak vs strong pullbacks
Confirm breakout candles
See exhaustion before reversals
Separate noise from real interest
Pair with IZ RSI + price structure for elite scalp precision
⭐ Why Traders Love It
Because it's clear.
Instant.
And it treats volume as the truth, not something to smooth or average.
This is how scalpers and tape-readers naturally think — now in a visual form.
🔥 Final Line
12 Band Volume matched Candles turns raw volume into a crystal-clear language.
Once you see volume this way, you will never go back to traditional colouring again.

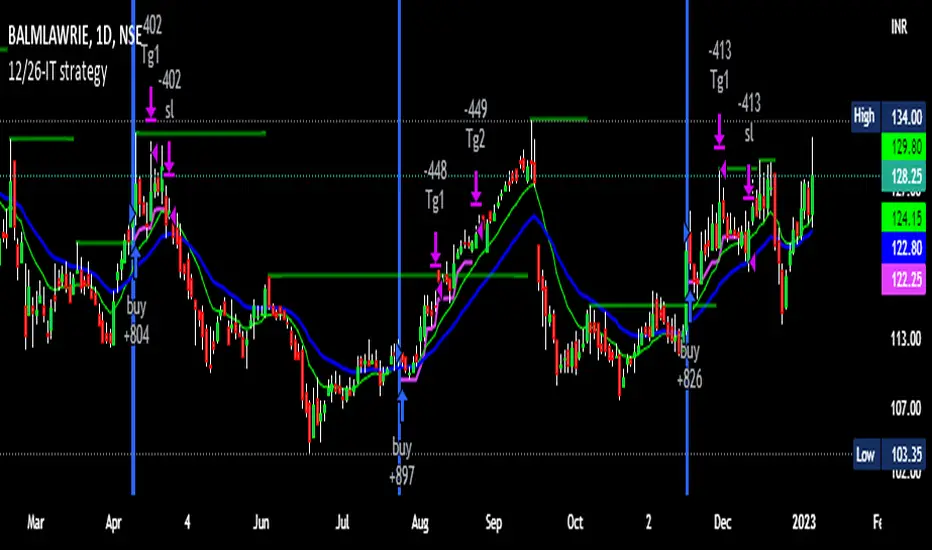
12/26-IT strategyBase of this Strategy is crossover of 12EMA on 26EMA.
Also multiple other criteria has to meet for buy signal, Criterias mentioned below
//////////////////////////////////
There two entry option to select. Either one or both can be selected:
1. Only 12/26 Cross over
a. 12/26 crossover.
b. RSI (14) value to be between a range (RSI is inbuilt, but lower and upper range can be defined in settings)
c. MACD (12, 26) to be positive and above signal line (this is inbuilt)
2. Recent 12/26 Cross over and closing above pivot point(resistance)
a. 12/26 crossover has to be recent, CrossOverLookbackCandles value will look for crossover in # previous candles..
b. RSI (14) value to be between a range (RSI is inbuilt, but lower and upper range can be defined in settings)
c. MACD (12, 26) to be positive and above signal line (this is inbuilt)
d. closing above resistance line
//////////////////////////////////
For Exit we have three options. you can select any SL as per your need, multiple SLs can also be selected
1. Trailing Stop Loss.
Source for TSL is adjustable(open, close, high or low), also you have to mention % below your source TSL has to be placed.
Once closing is below TSL, exit will be triggered.
2. Closing below 7SMA
After 7SMA SL is enabled, 7SMA will be plotted on chart and exit signal will be triggered when closing is below 7SMA.
Choose this option for LESS risk and rewards
3. 12/26 Crossdown
Once 12EMA crossdown below 26EMA, exit will be triggered.
Choose this option for HIGH risk and rewards
//////////////////////////////////
Resistance line is plotted based on left and right candles, if 10(can be changed) is used for both left and right, indicator will look for 10 candles in left and 10 candles in right and if both left and right candle are lower then a line is plotted.
Source has to be selected (close or high)
//////////////////////////////////
Qty mentioned in Buy trigger will be based on BUYVALUE entered
//////////////////////////////////
Multiple Target option is available, if first target is matched how much percentage of qty to be sold can be defined.
If you wish to have only one Target, then exit qty in first target must be 100
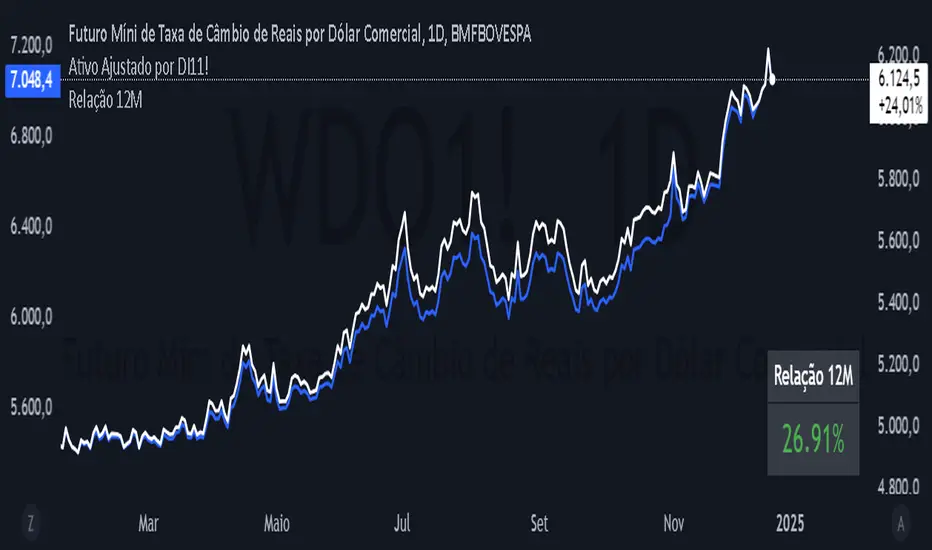
12 Month Difference - YoY ComparisonEste script foi desenvolvido para calcular e exibir a variação percentual do preço de um ativo nos últimos 12 meses, de forma simples e visual. Ele utiliza dados históricos de preços e apresenta o resultado diretamente no gráfico, permitindo ao usuário acompanhar a relação entre o valor atual e o valor de 12 meses atrás.
O cálculo é baseado em um período de 12 meses, que equivale a 252 dias úteis no mercado financeiro. O script primeiro identifica o preço atual do ativo e o compara com o preço registrado há exatamente 252 dias úteis. A diferença entre esses dois valores é transformada em uma variação percentual, o que facilita a análise de desempenho do ativo ao longo do período.
Além disso, o script define uma cor para destacar o resultado:
Verde, se a variação percentual for positiva (indicando crescimento).
Vermelho, se a variação for negativa (indicando queda).
O valor calculado é exibido de forma prática no canto inferior direito do gráfico, como uma tabela flutuante. Essa tabela contém o texto "Relação 12M" e o valor percentual correspondente, permitindo uma leitura rápida.
Embora o resultado seja calculado para todos os momentos no gráfico, ele é mostrado apenas como uma tabela no último ponto confirmado da série histórica, ou seja, no momento mais recente com dados disponíveis. Além disso, o script inclui o valor da relação na legenda do gráfico, mas ele está oculto visualmente para evitar sobrecarregar o layout.
Esse indicador é útil para analisar rapidamente o desempenho de um ativo ao longo de um ano, ajudando investidores e analistas a entenderem tendências e mudanças no mercado.
This script was developed to calculate and display the percentage change in the price of an asset over the last 12 months, in a simple and visual way. It uses historical price data and displays the result directly on the chart, allowing the user to monitor the relationship between the current value and the value from 12 months ago.
The calculation is based on a 12-month period, which is equivalent to 252 business days in the financial market. The script first identifies the current price of the asset and compares it with the price recorded exactly 252 business days ago. The difference between these two values is transformed into a percentage change, which makes it easier to analyze the asset's performance over the period.
In addition, the script defines a color to highlight the result:
Green, if the percentage change is positive (indicating growth).
Red, if the change is negative (indicating a decline).
The calculated value is displayed conveniently in the bottom right corner of the chart, as a floating table. This table contains the text "12M Ratio" and the corresponding percentage value, allowing for quick reading.
Although the result is calculated for all points in time on the chart, it is only displayed as a table at the last confirmed point in the historical series, i.e. the most recent point in time with available data. In addition, the script includes the ratio value in the chart legend, but it is visually hidden to avoid cluttering the layout.
This indicator is useful for quickly analyzing the performance of an asset over a year, helping investors and analysts understand trends and changes in the market.
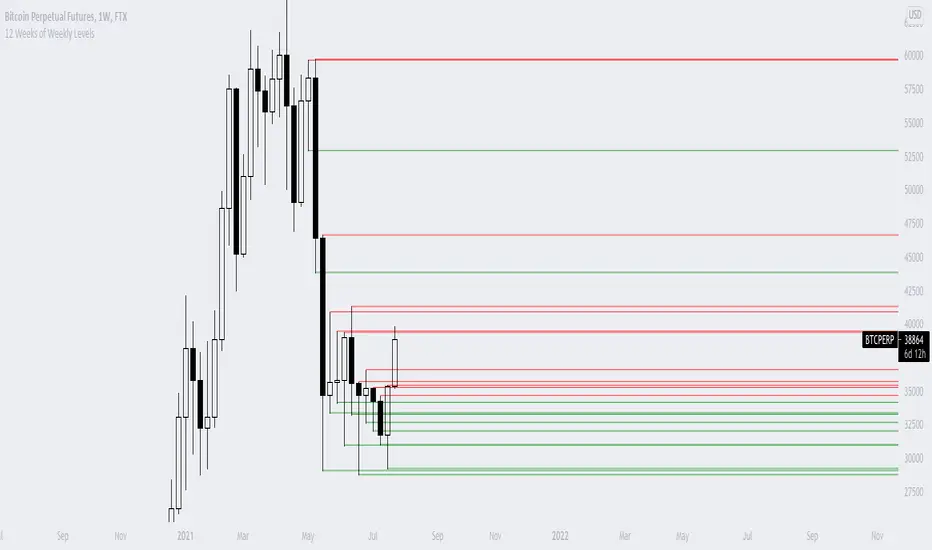
12 Weeks of Weekly LevelsA very simple indicator, which basically looks back on the past 12 weeks at 8PM EST and finds the highs and the lows. Once it finds those levels, it draws them as horizontal rays on the chart. The lows are drawn in green (to indicate previous buy zones) and the highs in red (to indicate previous sell zones). No user inputs are required
Nothing fancy, just weekly levels for the past quarter. You can easily draw these on a chart yourself, but it becomes very time consuming if you are watching a bunch of instruments and then Sundays come around.
Special shoutout to rumpypumpydumpy on StackOverflow for helping me work out the kinks, this is the first indicator I ever created. Hope it helps you find confluence in your decision making

12 Exponential Moving AveragesThe Guppy Multiple Moving Average (GMMA). The short-term MAs are typically set at 3, 5, 8, 10, 12, and 15 periods. The longer-term MAs are typically set at 30, 35, 40, 45, 50, and 60.

Yearly and 12-Week Percentage Difference with EMAThe indicator "Yearly and 12-Week Percentage Difference with EMA" is designed to display the annual and 12-week difference in the percentage variability of asset prices, as well as their exponential moving averages (EMA) on the TradingView chart.
EMA Period (EMA Period): This is a configurable parameter that allows you to select a period for calculating the EMA.
Yearly % Difference (Annual percentage difference): This indicator shows the percentage difference between the current price and the asset price a year ago on weekly bars. The graph is displayed in blue.
12-Week % Difference (12 weeks difference as a percentage): This indicator shows the percentage difference between the current price and the asset price 12 weeks ago on weekly bars. The graph is displayed in green.
Zero Line (Zero Line): This black line on the chart shows the zero level.
EMA of Yearly % Difference (EMA of annual percentage difference): This line represents the exponential moving average (EMA) of the annual percentage difference. The graph is displayed in red.
EMA of 12-Week % Difference (EMA of the difference over 12 weeks as a percentage): This line represents the exponential moving average (EMA) of the difference over 12 weeks as a percentage. The graph is displayed in orange.
Use this indicator to analyze the percentage variability of asset prices on an annual and 12-week basis, as well as to track their EMA, which can help in making trading decisions.
Русская версия \\\\\
Индикатор "Разница в процентах за год и за 12 недель с EMA" предназначен для отображения цены от год к году, и за 12 недель процентной изменчивости цен актива, а также их экспоненциальных скользящих средних (EMA) на графике TradingView.
- EMA Period (Период EMA): Это настраиваемый параметр, который позволяет выбрать период для расчета EMA.
- Yearly % Difference (Годовая разница в процентах): Этот индикатор показывает процентную разницу между текущей ценой и ценой актива год назад на недельных барах. График отображается синим цветом.
- 12-Week % Difference (Разница за 12 недель в процентах): Этот индикатор показывает процентную разницу между текущей ценой и ценой актива 12 недель назад на недельных барах. График отображается зеленым цветом.
- Zero Line (Линия нуля): Эта черная линия на графике показывает нулевой уровень.
- EMA of Yearly % Difference (EMA годовой разницы в процентах): Эта линия представляет собой экспоненциальное скользящее среднее (EMA) годовой разницы в процентах. График отображается красным цветом.
- EMA of 12-Week % Difference (EMA разницы за 12 недель в процентах): Эта линия представляет собой экспоненциальное скользящее среднее (EMA) разницы за 12 недель в процентах. График отображается оранжевым цветом.
Используйте этот индикатор для анализа процентной изменчивости цен актива на годовой и 12-недельной основе, а также для отслеживания их EMA, что может помочь в принятии торговых решений.

VWAP Diario + VWAP 08:00-12:00 ventanas NYWhat it plots
Daily VWAP (main line)
Anchored to the current trading day and only visible between 19:00 and 16:50 New York (UTC-5) to prevent any “ghost” segments.
Dynamic color: turns green when price closes above (bullish bias) and red when price closes below (bearish bias).
Optional standard-deviation/percentage bands (off by default).
08:00–12:00 VWAP (morning line)
Resets at 08:00 NY and shows until 12:00 NY only.
Acts as a morning value guide for early direction and pullbacks.
Clean rendering: Both lines use strict time masks and line breaks, so nothing is drawn outside their windows. You can toggle either line on/off.
How to Read It
Daily VWAP ≈ “fair value” of the whole session; use it for directional bias and confluence.
08:00–12:00 VWAP ≈ “fair value” of the morning; helps refine entries during the open.
Alignment:
Bullish environment: price and 08–12 VWAP sit above the Daily VWAP.
Rotation/mixed: price oscillates between the two lines.
Bearish: price and 08–12 VWAP sit below the Daily VWAP.
Two Mechanical Playbooks
Recommended charts: 1-minute for entries, 5-minute for context on NQ/Nasdaq100.
Primary execution window: 09:30–12:00 NY.
A) Trend Play (Break → Pullback to VWAP)
Goal: Join the day’s impulse with value confirmation.
Rules
Bias filter before 09:30
Bullish: 08–12 VWAP ≥ Daily VWAP; Bearish: 08–12 ≤ Daily.
First push 09:30–09:45 breaks the initial range high (bull) or low (bear).
Entry (pullback into confluence)
Wait for a pullback that tags/wicks the 08–12 VWAP or the Daily VWAP in the direction of bias.
Go long on bullish rejection (close back above); short on bearish rejection.
Stop-loss
Beyond the rejection wick or the touched VWAP (e.g., 1–1.5× ATR(1m/5m)).
Take-profit
TP1 = 1R (scale 50%); TP2 = 2–3R or day extremes (HOD/LOD).
If bands are on, consider exiting on a clean tag of the opposite band.
Management
Move to breakeven at 1R; exit early if price reclaims the opposite side of Daily VWAP.
Avoid when the morning is choppy and price sits glued between the two VWAPs.
B) Mean-Reversion Play (Controlled Reversal at Daily VWAP)
Goal: Capture a return to value after an overstretch and a clean rejection.
Rules
Stretch condition
Fast move away from Daily VWAP (3–5 bars) or beyond Band #1/#2 if enabled.
Rejection signal at Daily VWAP
A bar that touches Daily VWAP and closes back on the opposite side (pin/engulfing/strong close).
Entry
Long if a selloff rejects above Daily VWAP.
Short if a rally rejects below Daily VWAP.
Stop-loss
Just beyond the rejection wick or ~1× ATR(1m).
Take-profit
TP1 = 1R or the 08–12 VWAP; TP2 = 2–3R or a prior consolidation.
Management
If price crosses and holds on the other side of Daily VWAP (2 closes), cut the idea.
Avoid during high-impact news or when the session is strongly trending (prefer Play A).
Quality Filters
Volatility: Ensure ATR(14, 1m) or the 09:30–09:45 range exceeds your minimum.
Spread/liquidity: Skip abnormal spreads at the open.
News: If a red-level release is imminent, wait 2–3 bars after the print.
Coherence: Prefer trades when 08–12 and Daily VWAP don’t conflict.
Risk & Trade Management
Risk per trade: 0.25%–0.5% account risk.
Daily cap: 2–3 trades; stop for the day at –1R to –1.5R.
No over-reentry: Don’t chase if price is sitting exactly on a VWAP; wait for separation.
Log your metrics: setup type (A/B), confluences, distance to VWAP at trigger, time, R multiple.
Quick Pre-Trade Checklist
Bias aligned? (price vs Daily and 08–12 VWAP)
Choose Trend or Mean-Reversion play
Clear confluence at the VWAP line?
Realistic stop (≤ ~1.5× ATR 1m)?
Any imminent news?
TP plan: TP1 = 1R → BE, TP2 = 2–3R.

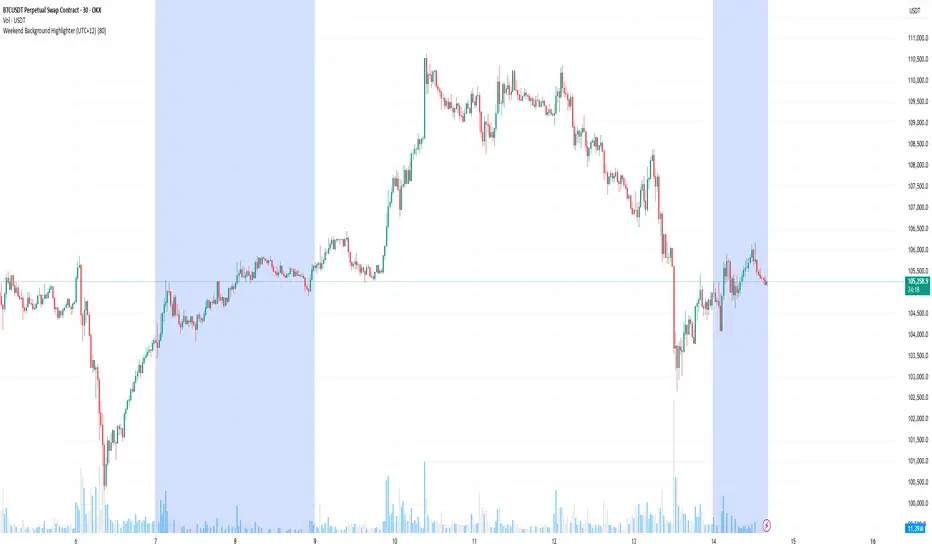
Weekend Background Highlighter (UTC+12)## Weekend Background Highlighter (UTC+12)
### Description
This indicator automatically highlights weekend periods on your TradingView charts specifically for the UTC+12 timezone (New Zealand Standard Time). Perfect for traders who need to visualize market closures and weekend gaps in the New Zealand/Pacific time zone, regardless of their exchange's native timezone or chart settings.
### Key Features
- **Fixed UTC+12 Timezone**: Hardcoded to always show weekends according to UTC+12, independent of exchange or chart timezone settings
- **Customizable Appearance**: Adjust background color and opacity to match your chart theme
- **Optional Weekend Labels**: Mark the beginning of each weekend period with customizable labels
- **Debug Mode**: View real-time timezone calculations to verify correct weekend detection
- **Lightweight**: Minimal performance impact with efficient calculations
### Use Cases
- **Forex Traders**: Identify weekend gaps and Monday openings in NZD pairs
- **Cryptocurrency Traders**: Visualize weekend trading patterns in the Pacific timezone
- **Multi-Market Traders**: Maintain consistent weekend awareness across different exchanges
- **Risk Management**: Clearly see when markets are closed for position management
### Settings
- **Weekend Background Color**: Choose any color for the weekend highlight
- **Opacity**: Control transparency (0-100%) to maintain chart visibility
- **Show Weekend Labels**: Toggle labels marking weekend start
- **Debug Info**: Display timezone calculations for verification
### How It Works
The indicator calculates the current UTC time and adds 12 hours to determine the UTC+12 time. It then checks if the resulting day falls on Saturday or Sunday, highlighting these periods on your chart. This ensures weekends are always displayed according to New Zealand time, regardless of your broker's timezone or your local settings.
### Notes
- Weekends begin at 00:00 Saturday UTC+12 (12:00 Friday UTC)
- Weekends end at 00:00 Monday UTC+12 (12:00 Sunday UTC)
- Works on all timeframes and markets
- Compatible with Pine Script v6
### Tags
weekend, background, timezone, UTC+12, New Zealand, highlight, trading sessions, forex, crypto, time zones, market hours, pacific time
Gyspy Bot Trade Engine - V1.2B - Strategy 12-7-25 - SignalLynxGypsy Bot Trade Engine (MK6 V1.2B) - Ultimate Strategy & Backtest
Brought to you by Signal Lynx | Automation for the Night-Shift Nation 🌙
1. Executive Summary & Architecture
Gypsy Bot (MK6 V1.2B) is not merely a strategy; it is a massive, modular Trade Engine built specifically for the TradingView Pine Script environment. While most strategies rely on a single dominant indicator (like an RSI cross or a MACD flip) to generate signals, Gypsy Bot functions as a sophisticated Consensus Algorithm.
The engine calculates data from up to 12 distinct Technical Analysis Modules simultaneously on every bar closing. It aggregates these signals into a "Vote Count" and only executes a trade entry when a user-defined threshold of concurring signals is met. This "Voting System" acts as a noise filter, requiring multiple independent mathematical models—ranging from volume flow and momentum to cyclical harmonics and trend strength—to agree on market direction before capital is committed.
Beyond entries, Gypsy Bot features a proprietary Risk Management suite called the Dump Protection Team (DPT). This logic layer operates independently of the entry modules, specifically scanning for "Moon" (Parabolic) or "Nuke" (Crash) volatility events to force-exit positions, overriding standard stops to preserve capital during Black Swan events.
2. ⚠️ The Philosophy of "Curve Fitting" (Must Read)
One must be careful when applying Gypsy Bot to new pairs or charts.
To be fully transparent: Gypsy Bot is, by definition, a very advanced curve-fitting engine. Because it grants the user granular control over 12 modules, dozens of thresholds, and specific voting requirements, it is extremely easy to "over-fit" the data. You can easily toggle switches until the backtest shows a 100% win rate, only to have the strategy fail immediately in live markets because it was tuned to historical noise rather than market structure.
To use this engine successfully, you must adopt a specific optimization mindset:
Ignore Raw Net Profit: Do not tune for the highest dollar amount. A strategy that makes $1M in the backtest but has a 40% drawdown is useless.
Prioritize Stability: Look for a high Profit Factor (1.5+), a high Percent Profitable, and a smooth equity curve.
Regular Maintenance is Mandatory: Markets shift regimes (e.g., from Bull Trend to Crab Range). Parameters that worked perfectly in 2021 may fail in 2024. Gypsy Bot settings should be reviewed and adjusted at regular intervals (e.g., quarterly) to ensure the voting logic remains aligned with current market volatility.
Timeframe Recommendations:
Gypsy Bot is optimized for High Time Frame (HTF) trend following. It generally produces the most reliable results on charts ranging from 1-Hour to 12-Hours, with the 4-Hour timeframe historically serving as the "sweet spot" for most major cryptocurrency assets.
3. The Voting Mechanism: How Entries Are Generated
The heart of the Gypsy Bot engine is the ActivateOrders input (found in the "Order Signal Modifier" settings).
The engine constantly monitors the output of all enabled Modules.
Long Votes: GoLongCount
Short Votes: GoShortCount
If you have 10 Modules enabled, and you set ActivateOrders to 7:
The engine will ONLY trigger a Buy Entry if 7 or more modules return a valid "Buy" signal on the same closed candle.
If only 6 modules agree, the trade is rejected.
This allows you to mix "Leading" indicators (Oscillators) with "Lagging" indicators (Moving Averages) to create a high-probability entry signal that requires momentum, volume, and trend to all be in alignment.
4. Technical Deep Dive: The 12 Modules
Gypsy Bot allows you to toggle the following modules On/Off individually to suit the asset you are trading.
Module 1: Modified Slope Angle (MSA)
Logic: Calculates the geometric angle of a moving average relative to the timeline.
Function: It filters out "lazy" trends. A trend is only considered valid if the slope exceeds a specific steepness threshold. This helps avoid entering trades during weak drifts that often precede a reversal.
Module 2: Correlation Trend Indicator (CTI)
Logic: Based on John Ehlers' work, this measures how closely the current price action correlates to a straight line (a perfect trend).
Function: It outputs a confidence score (-1 to 1). Gypsy Bot uses this to ensure that we are not just moving up, but moving up with high statistical correlation, reducing fake-outs.
Module 3: Ehlers Roofing Filter
Logic: A sophisticated spectral filter that combines a High-Pass filter (to remove long-term drift) with a Super Smoother (to remove high-frequency noise).
Function: It attempts to isolate the "Roof" of the price action. It is excellent at catching cyclical turning points before standard moving averages react.
Module 4: Forecast Oscillator
Logic: Uses Linear Regression forecasting to predict where price "should" be relative to where it is.
Function: When the Forecast Oscillator crosses its zero line, it indicates that the regression trend has flipped. We offer both "Aggressive" and "Conservative" calculation modes for this module.
Module 5: Chandelier ATR Stop
Logic: A volatility-based trend follower that hangs a "leash" (ATR multiple) from the highest high (for longs) or lowest low (for shorts).
Function: Used here as an entry filter. If price is above the Chandelier line, the trend is Bullish. It also includes a "Bull/Bear Qualifier" check to ensure structural support.
Module 6: Crypto Market Breadth (CMB)
Logic: This is a macro-filter. It pulls data from multiple major tickers (BTC, ETH, and Perpetual Contracts) across different exchanges.
Function: It calculates a "Market Health" percentage. If Bitcoin is rising but the rest of the market is dumping, this module can veto a trade, ensuring you don't buy into a "fake" rally driven by a single asset.
Module 7: Directional Index Convergence (DIC)
Logic: Analyzes the convergence/divergence between Fast and Slow Directional Movement indices.
Function: Identifies when trend strength is expanding. A buy signal is generated only when the positive directional movement overpowers the negative movement with expanding momentum.
Module 8: Market Thrust Indicator (MTI)
Logic: A volume-weighted breadth indicator. It uses Advance/Decline data and Up/Down Volume data.
Function: This is one of the most powerful modules. It confirms that price movement is supported by actual volume flow. We recommend using the "SSMA" (Super Smoother) MA Type for the cleanest signals on the 4H chart.
Module 9: Simple Ichimoku Cloud
Logic: Traditional Japanese trend analysis using the Tenkan-sen and Kijun-sen.
Function: Checks for a "Kumo Breakout." Price must be fully above the Cloud (for longs) or below it (for shorts). This is a classic "trend confirmation" module.
Module 10: Simple Harmonic Oscillator
Logic: Analyzes the harmonic wave properties of price action to detect cyclical tops and bottoms.
Function: Serves as a counter-trend or early-reversal detector. It tries to identify when a cycle has bottomed out (for buys) or topped out (for sells) before the main trend indicators catch up.
Module 11: HSRS Compression / Super AO
Logic: Two options in one.
HSRS: Hirashima Sugita Resistance Support. Detects volatility compression (squeezes) relative to dynamic support/resistance bands.
Super AO: A combination of the Awesome Oscillator and SuperTrend logic.
Function: Great for catching explosive moves that result from periods of low volatility (consolidation).
Module 12: Fisher Transform (MTF)
Logic: Converts price data into a Gaussian normal distribution.
Function: Identifies extreme price deviations. This module uses Multi-Timeframe (MTF) logic to look at higher-timeframe trends (e.g., looking at the Daily Fisher while trading the 4H chart) to ensure you aren't trading against the major trend.
5. Global Inhibitors (The Veto Power)
Even if 12 out of 12 modules vote "Buy," Gypsy Bot performs a final safety check using Global Inhibitors. If any of these are triggered, the trade is blocked.
Bitcoin Halving Logic:
Hardcoded dates for past and projected future Bitcoin halvings (up to 2040).
Trading is inhibited or restricted during the chaotic weeks immediately surrounding a Halving event to avoid volatility crushes.
Miner Capitulation:
Uses Hash Rate Ribbons (Moving averages of Hash Rate).
If miners are capitulating (Shutting down rigs due to unprofitability), the engine flags a "Bearish" regime and can flip logic to Short-only or flat.
ADX Filter (Flat Market Protocol):
If the Average Directional Index (ADX) is below a specific threshold (e.g., 20), the market is deemed "Flat/Choppy." The bot will refuse to open trend-following trades in a flat market.
CryptoCap Trend:
Checks the total Crypto Market Cap chart. If the broad market is in a downtrend, it can inhibit Long entries on individual altcoins.
6. Risk Management & The Dump Protection Team (DPT)
Gypsy Bot separates "Entry Logic" from "Risk Management Logic."
Dump Protection Team (DPT)
This is a specialized logic branch designed to save the account during Black Swan events.
Nuke Protection: If the DPT detects a volatility signature consistent with a flash crash, it overrides all other logic and forces an immediate exit.
Moon Protection: If a parabolic pump is detected that violates statistical probability (Bollinger deviations), DPT can force a profit take before the inevitable correction.
Advanced Adaptive Trailing Stop (AATS)
Unlike a static trailing stop (e.g., "trail by 5%"), AATS is dynamic.
Penthouse Level: If price is at the top of the HSRS channel (High Volatility), the stop loosens to allow for wicks.
Dungeon Level: If price is compressed at the bottom, the stop tightens to protect capital.
Staged Take Profits
TP1: Scalp a portion (e.g., 10%) to cover fees and secure a win.
TP2: Take the bulk of profit.
TP3: Leave a "Runner" position with a loose trailing stop to catch "Moon" moves.
7. Recommended Setup Guide
When applying Gypsy Bot to a new chart, follow this sequence:
Set Timeframe: 4 Hours (4H).
Reset: Turn OFF Trailing Stop, Stop Loss, and Take Profits. (We want to see raw entry performance first).
Tune DPT: Adjust "Dump/Moon Protection" inputs first. These have the highest impact on net performance.
Tune Module 8 (MTI): This module is a heavy filter. Experiment with the MA Type (SSMA is recommended).
Select Modules: Enable/Disable modules 1-12 based on the asset's personality (Trending vs. Ranging).
Voting Threshold: Adjust ActivateOrders. A lower number = More Trades (Aggressive). A higher number = Fewer, higher conviction trades (Conservative).
Final Polish: Re-enable Stop Losses, Trailing Stops, and Staged Take Profits to smooth the equity curve and define your max risk per trade.
8. Technical Specs
Engine Version: Pine Script V6
Repainting: This strategy uses Closed Candle data for all Risk Management and Entry decisions. This ensures that Backtest results align closely with real-time behavior (no repainting of historical signals).
Alerts: This script generates Strategy alerts. If you require visual-only alerts, see the source code header for instructions on switching to "Study" (Indicator) mode.
Disclaimer:
This script is a complex algorithmic tool for market analysis. Past performance is not indicative of future results. Use this tool to assist your own decision-making, not to replace it.
9. About Signal Lynx
Automation for the Night-Shift Nation 🌙
Signal Lynx focuses on helping traders and developers bridge the gap between indicator logic and real-world automation. The same RM engine you see here powers multiple internal systems and templates, including other public scripts like the Super-AO Strategy with Advanced Risk Management.
We provide this code open source under the Mozilla Public License 2.0 (MPL-2.0) to:
Demonstrate how Adaptive Logic and structured Risk Management can outperform static, one-layer indicators
Give Pine Script users a battle-tested RM backbone they can reuse, remix, and extend
If you are looking to automate your TradingView strategies, route signals to exchanges, or simply want safer, smarter strategy structures, please keep Signal Lynx in your search.
License: Mozilla Public License 2.0 (Open Source).
If you make beneficial modifications, please consider releasing them back to the community so everyone can benefit.

Gyspy Bot Trade Engine - V1.2B - Alerts - 12-7-25 - SignalLynxGypsy Bot Trade Engine (MK6 V1.2B) - Alerts & Visualization
Brought to you by Signal Lynx | Automation for the Night-Shift Nation 🌙
1. Executive Summary & Architecture
Gypsy Bot (MK6 V1.2B) is not merely a strategy; it is a massive, modular Trade Engine built specifically for the TradingView Pine Script V6 environment. While most tools rely on a single dominant indicator to generate signals, Gypsy Bot functions as a sophisticated Consensus Algorithm.
Note: This is the Indicator / Alerts version of the engine. It is designed for visual analysis and generating live alert signals for automation. If you wish to see Backtest data (Equity Curves, Drawdown, Profit Factors), please use the Strategy version of this script.
The engine calculates data from up to 12 distinct Technical Analysis Modules simultaneously on every bar closing. It aggregates these signals into a "Vote Count" and only fires a signal plot when a user-defined threshold of concurring signals is met. This "Voting System" acts as a noise filter, requiring multiple independent mathematical models—ranging from volume flow and momentum to cyclical harmonics and trend strength—to agree on market direction.
Beyond entries, Gypsy Bot features a proprietary Risk Management suite called the Dump Protection Team (DPT). This logic layer operates independently of the entry modules, specifically scanning for "Moon" (Parabolic) or "Nuke" (Crash) volatility events to signal forced exits, preserving capital during Black Swan events.
2. ⚠️ The Philosophy of "Curve Fitting" (Must Read)
One must be careful when applying Gypsy Bot to new pairs or charts.
To be fully transparent: Gypsy Bot is, by definition, a very advanced curve-fitting engine. Because it grants the user granular control over 12 modules, dozens of thresholds, and specific voting requirements, it is extremely easy to "over-fit" the data. You can easily toggle switches until the charts look perfect in hindsight, only to have the signals fail in live markets because they were tuned to historical noise rather than market structure.
To use this engine successfully:
Visual Verification: Do not just look for "green arrows." Look for signals that occur at logical market structure points.
Stability: Ensure signals are not flickering. This script uses closed-candle logic for key decisions to ensure that once a signal plots, it remains painted.
Regular Maintenance is Mandatory: Markets shift regimes (e.g., from Bull Trend to Crab Range). Gypsy Bot settings should be reviewed and adjusted at regular intervals to ensure the voting logic remains aligned with current market volatility.
Timeframe Recommendations:
Gypsy Bot is optimized for High Time Frame (HTF) trend following. It generally produces the most reliable results on charts ranging from 1-Hour to 12-Hours, with the 4-Hour timeframe historically serving as the "sweet spot" for most major cryptocurrency assets.
3. The Voting Mechanism: How Entries Are Generated
The heart of the Gypsy Bot engine is the ActivateOrders input (found in the "Order Signal Modifier" settings).
The engine constantly monitors the output of all enabled Modules.
Long Votes: GoLongCount
Short Votes: GoShortCount
If you have 10 Modules enabled, and you set ActivateOrders to 7:
The engine will ONLY plot a Buy Signal if 7 or more modules return a valid "Buy" signal on the same closed candle.
If only 6 modules agree, the signal is rejected.
4. Technical Deep Dive: The 12 Modules
Gypsy Bot allows you to toggle the following modules On/Off individually to suit the asset you are trading.
Module 1: Modified Slope Angle (MSA)
Logic: Calculates the geometric angle of a moving average relative to the timeline.
Function: Filters out "lazy" trends. A trend is only considered valid if the slope exceeds a specific steepness threshold.
Module 2: Correlation Trend Indicator (CTI)
Logic: Measures how closely the current price action correlates to a straight line (a perfect trend).
Function: Ensures that we are moving up with high statistical correlation, reducing fake-outs.
Module 3: Ehlers Roofing Filter
Logic: A spectral filter combining High-Pass (trend removal) and Super Smoother (noise removal).
Function: Isolates the "Roof" of price action to catch cyclical turning points before standard moving averages.
Module 4: Forecast Oscillator
Logic: Uses Linear Regression forecasting to predict where price "should" be relative to where it is.
Function: Signals when the regression trend flips. Offers "Aggressive" and "Conservative" calculation modes.
Module 5: Chandelier ATR Stop
Logic: A volatility-based trend follower that hangs a "leash" (ATR multiple) from extremes.
Function: Used as an entry filter. If price is above the Chandelier line, the trend is Bullish.
Module 6: Crypto Market Breadth (CMB)
Logic: Pulls data from multiple major tickers (BTC, ETH, and Perpetual Contracts).
Function: Calculates "Market Health." If Bitcoin is rising but the rest of the market is dumping, this module can veto a trade.
Module 7: Directional Index Convergence (DIC)
Logic: Analyzes the convergence/divergence between Fast and Slow Directional Movement indices.
Function: Identifies when trend strength is expanding.
Module 8: Market Thrust Indicator (MTI)
Logic: A volume-weighted breadth indicator using Advance/Decline and Volume data.
Function: One of the most powerful modules. Confirms that price movement is supported by actual volume flow. Recommended setting: "SSMA" (Super Smoother).
Module 9: Simple Ichimoku Cloud
Logic: Traditional Japanese trend analysis.
Function: Checks for a "Kumo Breakout." Price must be fully above/below the Cloud to confirm entry.
Module 10: Simple Harmonic Oscillator
Logic: Analyzes harmonic wave properties to detect cyclical tops and bottoms.
Function: Serves as a counter-trend or early-reversal detector.
Module 11: HSRS Compression / Super AO
Logic: Detects volatility compression (HSRS) or Momentum/Trend confluence (Super AO).
Function: Great for catching explosive moves resulting from consolidation.
Module 12: Fisher Transform (MTF)
Logic: Converts price data into a Gaussian normal distribution.
Function: Identifies extreme price deviations. Uses Multi-Timeframe (MTF) logic to ensure you aren't trading against the major trend.
5. Global Inhibitors (The Veto Power)
Even if 12 out of 12 modules vote "Buy," Gypsy Bot performs a final safety check using Global Inhibitors.
Bitcoin Halving Logic: Prevents trading during chaotic weeks surrounding Halving events (dates projected through 2040).
Miner Capitulation: Uses Hash Rate Ribbons to identify bearish regimes when miners are shutting down.
ADX Filter: Prevents trading in "Flat/Choppy" markets (Low ADX).
CryptoCap Trend: Checks the total Crypto Market Cap chart for broad market alignment.
6. Risk Management & The Dump Protection Team (DPT)
Even in this Indicator version, the RM logic runs to generate Exit Signals.
Dump Protection Team (DPT): Detects "Nuke" (Crash) or "Moon" (Pump) volatility signatures. If triggered, it plots an immediate Exit Signal (Yellow Plot).
Advanced Adaptive Trailing Stop (AATS): Dynamically tightens stops in low volatility ("Dungeon") and loosens them in high volatility ("Penthouse").
Staged Take Profits: Plots TP1, TP2, and TP3 events on the chart for visual confirmation or partial exit alerts.
7. Recommended Setup Guide
When applying Gypsy Bot to a new chart, follow this sequence:
Set Timeframe: 4 Hours (4H).
Tune DPT: Adjust "Dump/Moon Protection" inputs first. These filter out bad signals during high volatility.
Tune Module 8 (MTI): Experiment with the MA Type (SSMA is recommended).
Select Modules: Enable/Disable modules based on the asset's personality (Trending vs. Ranging).
Voting Threshold: Adjust ActivateOrders to filter out noise.
Alert Setup: Once visually satisfied, use the "Any Alert Function Call" option when creating an alert in TradingView to capture all Buy/Sell/Close events generated by the engine.
8. Technical Specs
Engine Version: Pine Script V6
Repainting: This indicator uses Closed Candle data for all Risk Management and Entry decisions. This ensures that signals do not vanish after the candle closes.
Visuals:
Blue Plot: Buy/Sell Signal.
Yellow Plot: Risk Management (RM) / DPT Close Signal.
Green/Lime/Olive Plots: Take Profit hits.
Disclaimer:
This script is a complex algorithmic tool for market analysis. Past performance is not indicative of future results. Cryptocurrency trading involves substantial risk of loss. Use this tool to assist your own decision-making, not to replace it.
9. About Signal Lynx
Automation for the Night-Shift Nation 🌙
Signal Lynx focuses on helping traders and developers bridge the gap between indicator logic and real-world automation. The same RM engine you see here powers multiple internal systems and templates, including other public scripts like the Super-AO Strategy with Advanced Risk Management.
We provide this code open source under the Mozilla Public License 2.0 (MPL-2.0) to:
Demonstrate how Adaptive Logic and structured Risk Management can outperform static, one-layer indicators
Give Pine Script users a battle-tested RM backbone they can reuse, remix, and extend
If you are looking to automate your TradingView strategies, route signals to exchanges, or simply want safer, smarter strategy structures, please keep Signal Lynx in your search.
License: Mozilla Public License 2.0 (Open Source).
If you make beneficial modifications, please consider releasing them back to the community so everyone can benefit.

Daily 12/21 EMA OverlayDaily 12/21 EMA Overlay
This indicator projects the daily 12 and 21 EMAs onto any timeframe as a soft, semi-transparent band. It is designed to give a constant higher-timeframe bias and dynamic support/resistance reference while you execute your systems on lower timeframes (4H, 1H, 15m, etc.).
The script uses request.security() to calculate the 12/21 EMAs on the daily chart only, then overlays those values on your current timeframe without recalculating them locally. This means the band always represents the true daily 12/21 EMAs, regardless of the chart you are viewing.
Key Features:
Fixed daily 12/21 EMA band, visible on all timeframes
Faded lines and fill to keep focus on your active intraday tools
Simple, minimal inputs (fast length, slow length, colors, band visibility)
Ideal as a higher-timeframe “backdrop” for systems built around EMA trend, rejections, or liquidity sweeps
How to Use
Add the indicator on any symbol and timeframe
Keep your normal intraday EMAs (e.g., EMA 12/21) for execution
Note: You can change the bands to not just be 12 or 21, you can change them if needed for your own systems or emas that you use.
This tool is intentionally lightweight: it does one job—showing the true daily EMA structure across all timeframes—and leaves trade execution logic to your primary system.

Classic Dual Momentum – 12-Month Absolute Momentum - AntonacciThis indicator calculates the 12-month absolute momentum exactly as described in Gary Antonacci’s Dual Momentum framework.
It automatically adjusts the lookback period based on the chart’s timeframe:
Daily chart: 252 bars
Weekly chart: 52 bars
Monthly chart: 12 bars
Other timeframes: Estimated automatically using bar time difference
The script computes the 12-month rate of return and displays it as a color-coded column plot:
Green: Positive 12-month momentum
Red: Negative 12-month momentum
A customizable moving average is included to help visualize longer-term trends in the momentum signal.
How It’s Used (from Dual Momentum theory)
This indicator provides the absolute momentum filter used in classic Dual Momentum strategies:
If the 12-month return of an asset is above the risk-free return → trend is positive
If it is below the risk-free return → trend is negative
This absolute momentum check is a key component of the Global Equities Momentum (GEM) model presented in Gary Antonacci’s book Dual Momentum Investing.
Why This Indicator Exists
It gives traders a clean, accurate way to visualize the 12-month trend strength across any timeframe, without the distortions caused by bar length differences.

Adaptive 12/48 EMAThe Adaptive 12/48 EMA is a trend-following indicator that dynamically changes color based on price positioning relative to key exponential moving averages (EMAs).
EMA Calculation:
The script calculates three EMAs—9 EMA (white), 12 EMA (adaptive color), and 48 EMA (adaptive color).
Trend Confirmation:
The 12 EMA turns green when the price (open, close, and low) is fully above it, indicating bullish momentum. The 12 EMA turns red when the price is fully below it, signaling bearish conditions.
Long-Term Trend (48 EMA):
The 48 EMA turns purple when the 12 EMA is above it, confirming an uptrend. The 48 EMA turns pink when the 12 EMA is below it, confirming a downtrend. Both EMAs turn gray when there's no clear trend.
How to Benefit from It:
Trend Trading: Use green/red shifts in the 12 EMA to time entries in the direction of momentum.
Trend Strength Confirmation: The 48 EMA color change helps determine the longer-term trend direction.
Confluence with Other Indicators: Works well with volume indicators or RSI for confirmation before entering trades.
This indicator provides a clear visual representation of trend strength and direction, helping traders make informed decisions based on price structure.

Mikula's Master 360° Square of 12Mikula’s Master 360° Square of 12
An educational W. D. Gann study indicator for price and time. Anchor a compact Square of 12 table to a start point you choose. Begin from a bar’s High or Low (or set a manual start price). From that anchor you can progress or regress the table to study how price steps through cycles in either direction.
What you’re looking at :
Zodiac rail (far left): the twelve signs.
Degree rail: 24 rows in 15° steps from 15° up to 360°/0°.
Transit rail and Natal rail: track one planet per rail. Each planet is placed at its current row (℞ shown when retrograde). As longitude advances, the planet climbs bottom → top, then wraps to the bottom at the next sign; during retrograde it steps downward.
Hover a planet’s cell to see a tooltip with its exact longitude and sign (e.g., 152.4° ♌︎). The linked price cell in the grid moves with the planet’s row so you can follow a planet’s path through the zodiac as a path through price.
Price grid (right): the 12×24 Square of 12. Each column is a cycle; cells are stepped price levels from your start price using your increment.
Bottom rail: shows the current square number and labels the twelve columns in that square.
How the square is read
The square always begins at the bottom left. Read each column bottom → top. At the top, return to the bottom of the next column and read up again. One square contains twelve cycles. Because the anchor can be a High or a Low, you can progress the table upward from the anchor or regress it downward while keeping the same bottom-to-top reading order.
Iterate Square (shifting)
Iterate Square shifts the entire 12×24 grid to the next set of twelve cycles.
Square 1 shows cycles 1–12; Square 2 shows 13–24; Square 3 shows 25–36, etc.
Visibility rules
Pivot cells are table-bound. If you shift the square beyond those prices, their highlights won’t appear in the table.
A/B levels and Transit/Natal planetary lines are chart overlays and can remain visible on the table as you shift the square.
Quick use
Choose an anchor (date/time + High/Low) or enable a manual start price .
Set the increment. If you anchored with a Low and want the table to step downward from there, use a negative value.
Optional: pick Transit and Natal planets (one per rail), toggle their plots, and hover their cells for longitude/sign.
Optional: turn on A/B levels to display repeating bands from the start price.
Optional: enable swing pivots to tint matching cells after the anchor.
Use Iterate Square to shift to later squares of twelve cycles.
Examples
These are exploratory examples to spark ideas:
Overview layout (zodiac & degree rails, Transit/Natal rails, price grid)
A-levels plotted, pivots tinted on the table, real-time price highlighted
Drawing angles from the anchor using price & time read from the table
Using a TradingView Gann box along the A-levels to study reactions
Attribution & originality
This script is an original implementation (no external code copied). Conceptual credit to Patrick Mikula, whose discussion of the Master 360° Square of 12 inspired this study’s presentation.
Further reading (neutral pointers)
Patrick Mikula, Gann’s Scientific Methods Unveiled, Vol. 2, “W. D. Gann’s Use of the Circle Chart.”
W. D. Gann’s Original Commodity Course (as provided by WDGAN.com).
No affiliation implied.
License CC BY-NC-SA 4.0 (non-commercial; please attribute @Javonnii and link the original).
Dependency AstroLib by @BarefootJoey
Disclaimer Educational use only; not financial advice.

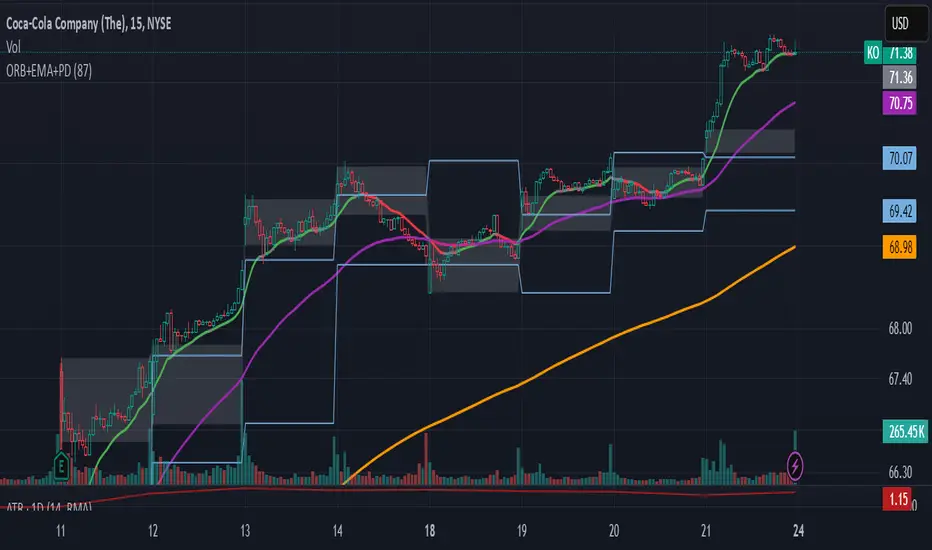
ORB-5Min + Adaptive 12/48 EMA + PDH/PDL
Overview:
This indicator combines the 5-Minute Opening Range Breakout (ORB), Adaptive 12/48 Exponential Moving Averages (EMAs), and Previous Day High/Low (PDH/PDL) levels to help traders identify key intraday levels and market trends.
Key Components and Logic:
5-Minute Opening Range Breakout (ORB):
Displays the high and low from the first 5-minute candle of the trading session.
Includes customizable opacity for the range fill.
Helps traders spot breakout opportunities and key support/resistance zones.
Adaptive 12/48 EMA System:
Displays EMAs for 9, 12, 48, and 200 periods.
The 12 EMA changes color based on whether the price is entirely above or below it.
The 48 EMA changes color depending on its relationship with the 12 EMA.
Provides dynamic trend identification and potential entry/exit signals.
Previous Day High/Low (PDH/PDL):
Displays the previous day’s high and low levels.
Useful for tracking key intraday support/resistance levels and potential reversal points.
Summary:
This script stands out by blending three popular intraday tools into a single comprehensive indicator. The combined visualization provides a layered market context that assists traders in making informed decisions quickly. The color-adaptive EMAs add clarity to trend direction, while the ORB and PDH/PDL levels highlight significant price zones for breakout or reversal trades.
How to Use:
Breakout Trades: Watch for price breaks above the ORB high or below the ORB low, especially when supported by EMA trends.
Trend Confirmation: Use the color-adaptive 12/48 EMA system to gauge momentum and market direction.
Reversal or Continuation: Observe how price reacts around PDH/PDL levels, especially if confluence with EMAs occurs.
This indicator is suitable for day traders seeking a clear and efficient way to track market structure, identify trends, and spot potential trade opportunities during regular market hours.
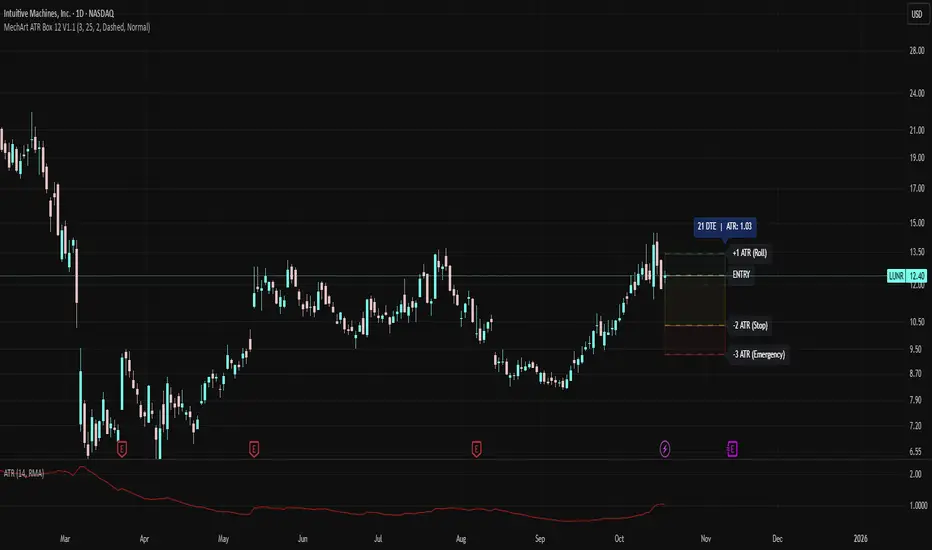
MechArt ATR Box 12 V1.1MechArt ATR Box 12 V1.1 — Auto ATR Edition
Overview:
The MechArt ATR Box 12 is a precision visualization tool for tracking ATR-based trade levels across multiple tickers. It automatically plots your +1 ATR roll zone, -2 ATR stop, and -3 ATR emergency exit, providing a clear visual map of your trade’s range and time horizon.
Key Features:
Auto ATR on Entry Date: For each configured ticker, the indicator automatically pulls the historical ATR(14) value that matches your entry date — no manual ATR entry needed. This refreshes each time the ticker is revisited.
Smart Defaults for Other Tickers:
If a ticker isn’t listed in the code, the indicator defaults to your current price as the entry, calculates ATR live, and sets expiration 21 days out, aligned to the next Friday.
Multi-Ticker Setup (12 Slots):
You can predefine up to 12 tickers inside the code, each with its own entry price, entry date and expiration date. Once saved, the indicator recognizes and loads them automatically when you open that chart.
Customizable Appearance:
Adjustable opacity and colors for each ATR box
Line width, style, and transparency controls
DTE/ATR label with adjustable font size
Dynamic Labels:
Displays the remaining days to expiration (DTE) and the ATR value used for calculations.
Use Case:
Designed for swing traders and options traders managing multiple active tickers. Each ATR box visually represents your trade window — from entry through expiration — with clear risk and roll boundaries.
How It Works:
Simply open the code once and enter your 12 tickers, each with its entry date and price. The script handles ATR lookups and expiration alignment automatically. Any ticker not included will generate its own default 21-day box.
Multiple (12) Strong Buy/Sell Signals + Momentum
Indicator Manual: "Multiple (12) Strong Buy/Sell Signals + Momentum"
This indicator is designed to identify strong buy and sell signals based on 12 configurable conditions, which include a variety of technical analysis methods such as trend-following indicators, pattern recognition, volume analysis, and momentum oscillators. It allows for customizable alerts and visual cues on the chart. The indicator helps traders spot potential entry and exit points by displaying buy and sell signals based on the selected conditions.
Key Observations:
• The script integrates multiple indicators and pattern recognition methods to provide comprehensive buy/sell signals.
• Trend-based indicators like EMAs and MACD are combined with pattern recognition (flags, triangles) and momentum-based signals (RSI, ADX, and volume analysis).
• User customization is a core feature, allowing adjustments to the conditions and thresholds for more tailored signals.
• The script is designed to be responsive to market conditions, with multiple conditions filtering out noise to generate reliable signals.
________________________________________
Key Features:
1. 12 Combined Buy/Sell Signal Conditions: This indicator incorporates a diverse set of conditions based on trend analysis, momentum, and price patterns.
2. Minimum Conditions Input: You can adjust the threshold of conditions that need to be met for the buy/sell signals to appear.
3. Alert Customization: Set alert thresholds for both buy and sell signals.
4. Dynamic Visualization: Buy and sell signals are shown as triangles on the chart, with momentum signals highlighted as circles.
________________________________________
Detailed Description of the 12 Conditions:
1. Exponential Moving Averages (EMA):
o Conditions: The indicator uses EMAs with periods 3, 8, and 13 for quick trend-following signals.
o Bullish Signal: EMA3 > EMA8 > EMA13 (Bullish stack).
o Bearish Signal: EMA3 < EMA8 < EMA13 (Bearish stack).
o Reversal Signal: The crossing over or under of these EMAs can signify trend reversals.
2. MACD (Moving Average Convergence Divergence):
o Fast MACD (2, 7, 3) is used to confirm trends quickly.
o Bullish Signal: When the MACD line crosses above the signal line.
o Bearish Signal: When the MACD line crosses below the signal line.
3. Donchian Channel:
o Tracks the highest high and lowest low over a given period (default 20).
o Breakout Signal: Price breaking above the upper band is bullish; breaking below the lower band is bearish.
4. VWAP (Volume-Weighted Average Price):
o Above VWAP: Bullish condition (price above VWAP).
o Below VWAP: Bearish condition (price below VWAP).
5. EMA Stacking & Reversal:
o Tracks the order of EMAs (3, 8, 13) to confirm strong trends and reversals.
o Bullish Reversal: EMA3 < EMA8 < EMA13 followed by a crossing to bullish.
o Bearish Reversal: EMA3 > EMA8 > EMA13 followed by a crossing to bearish.
6. Bull/Bear Flags:
o Bull Flag: Characterized by a strong price movement (flagpole) followed by a pullback and breakout.
o Bear Flag: Similar to Bull Flag but in the opposite direction.
7. Triangle Patterns (Ascending and Descending):
o Detects ascending and descending triangles using pivot highs and lows.
o Ascending Triangle: Higher lows and flat resistance.
o Descending Triangle: Lower highs and flat support.
8. Volume Sensitivity:
o Identifies price moves with significant volume increases.
o High Volume: When current volume is significantly above the moving average volume (set to 1.2x of the average).
9. Momentum Indicators:
o RSI (Relative Strength Index): Confirms overbought and oversold levels with thresholds set at 65 (overbought) and 35 (oversold).
o ADX (Average Directional Index): Confirms strong trends when ADX > 28.
o Momentum Up: Momentum is upward with strong volume and bullish RSI/ADX conditions.
o Momentum Down: Momentum is downward with strong volume and bearish RSI/ADX conditions.
10. Bollinger & Keltner Squeeze:
o Squeeze Condition: A contraction in both Bollinger Bands and Keltner Channels indicates low volatility, signaling a potential breakout.
o Squeeze Breakout: Price breaking above or below the squeeze bands.
11. 3 Consecutive Candles Condition:
o Bullish: Price rises for three consecutive candles with higher highs and lows.
o Bearish: Price falls for three consecutive candles with lower highs and lows.
12. Williams %R and Stochastic RSI:
o Williams %R: A momentum oscillator with signals when the line crosses certain levels.
o Stochastic RSI: Provides overbought/oversold levels with smoother signals.
o Combined Signals: You can choose whether to require both WPR and StochRSI to signal a buy/sell.
________________________________________
User Inputs (Inputs Tab):
1. Minimum Conditions for Buy/Sell:
o min_conditions: Number of conditions required to trigger a buy/sell signal on the chart (1 to 12).
o Alert_min_conditions: User-defined alert threshold (how many conditions must be met before an alert is triggered).
2. Donchian Channel Settings:
o Show Donchian: Toggle visibility of the Donchian channel.
o Donchian Length: The length of the Donchian Channel (default 20).
3. Bull/Bear Flag Settings:
o Bull Flag Flagpole Strength: ATR multiplier to define the strength of the flagpole.
o Bull Flag Pullback Length: Length of pullback for the bull flag pattern.
o Bull Flag EMA Length: EMA length used to confirm trend during bull flag pattern.
Similar settings exist for Bear Flag patterns.
4. Momentum Indicators:
o RSI Length: Period for calculating the RSI (default 9).
o RSI Overbought: Overbought threshold for the RSI (default 65).
o RSI Oversold: Oversold threshold for the RSI (default 35).
5. Bollinger/Keltner Squeeze Settings:
o Squeeze Width Threshold: The maximum width of the Bollinger and Keltner Bands for squeeze conditions.
6. Stochastic RSI Settings:
o Stochastic RSI Length: The period for calculating the Stochastic RSI.
7. WPR Settings:
o WPR Length: Period for calculating Williams %R (default 14).
________________________________________
User Inputs (Style Tab):
1. Signal Plotting:
o Control the display and colors of the buy/sell signals, momentum indicators, and pattern signals on the chart.
o Buy/Sell Signals: Can be customized with different colors and shapes (triangle up for buys, triangle down for sells).
o Momentum Signals: Custom circle placement for momentum-up or momentum-down signals.
2. Donchian Channel:
o Show Donchian: Toggle visibility of the Donchian upper, lower, and middle bands.
o Band Colors: Choose the color for each band (upper, lower, middle).
________________________________________
How to Use the Indicator:
1. Adjust Minimum Conditions: Set the minimum number of conditions that must be met for a signal to appear. For example, set it to 5 if you want only stronger signals.
2. Set Alert Threshold: Define the number of conditions needed to trigger an alert. This can be different from the minimum conditions for visual signals.
3. Customize Appearance: Modify the colors and styles of the signals to match your preferences.
________________________________________
Conclusion:
This comprehensive trading indicator uses a combination of trend-following, pattern recognition, and momentum-based conditions to help you spot potential buy and sell opportunities. By adjusting the input settings, you can fine-tune it to match your specific trading strategy, making it a versatile tool for different market conditions.
Signal Reliability Based on Condition Count
The reliability of the buy/sell signals increases as more conditions are met. Here's a breakdown of the probabilities:
1. 1-3 Conditions Met: Lower Probability
o Signals that meet only 1-3 conditions tend to have lower reliability and are considered less probable. These signals may represent false positives or weaker market movements, and traders should approach them with caution.
2. 4 Conditions Met: More Reliable Signal
o When 4 conditions are met, the signal becomes more reliable. This indicates that multiple indicators or market patterns are aligning, increasing the likelihood of a valid buy/sell opportunity. While not foolproof, it's a stronger indication that the market may be moving in a particular direction.
3. 5-6 Conditions Met: Strong Signal
o A signal meeting 5-6 conditions is considered a strong signal. This indicates a well-confirmed move, with several technical indicators and market factors aligning to suggest a higher probability of success. These are the signals that traders often prioritize.
4. 7+ Conditions Met: Rare and High-Confidence Signal
o Signals that meet 7 or more conditions are rare and should be considered high-confidence signals. These represent a significant alignment of multiple factors, and while they are less frequent, they are highly reliable when they do occur. Traders can be more confident in acting on these signals, but they should still monitor market conditions for confirmation.
________________________________________
You can adjust the number of conditions as needed, but this breakdown should give a clear structure on how the signal strength correlates with the number of conditions met!

EMA 12-26-100 Momentum Strategy# Triple EMA Multi-Signal Momentum Strategy
## 📊 Overview
**Triple EMA Multi-Signal** is a comprehensive trend-following momentum strategy designed specifically for cryptocurrency markets. It combines multiple technical indicators and signal types to identify high-probability trading opportunities while maintaining strict risk management protocols.
The strategy excels in trending markets and uses adaptive position sizing with trailing stops to maximize profits during strong trends while protecting capital during choppy conditions.
## 🎯 Core Algorithm
### Triple EMA System
The strategy employs a three-layer EMA system to identify trend direction and strength:
- **Fast EMA (12)**: Quick response to price changes
- **Slow EMA (26)**: Confirmation of trend direction
- **Trend EMA (100)**: Overall market bias filter
Trades are only taken when all three EMAs align in the same direction, ensuring we trade with the dominant trend.
### Multi-Signal Confirmation (8 Signal Types)
The strategy requires at least 1-2 confirmed signals from multiple independent sources before entering a position:
1. **EMA Crossover** - Fast EMA crossing Slow EMA (primary signal)
2. **MACD Cross** - MACD line crossing signal line (momentum confirmation)
3. **RSI Reversal** - RSI bouncing from oversold/overbought zones
4. **Price Action** - Strong bullish/bearish candles (>60% of range)
5. **Volume Spike** - Above-average volume confirmation
6. **Breakout** - Price breaking 20-period high/low with volume
7. **Pullback to EMA** - Trend continuation after healthy retracement
8. **Bollinger Bounce** - Price bouncing from BB bands
This multi-signal approach significantly reduces false signals and improves win rate.
## 💰 Risk Management
### Position Sizing
- Default: 20-25% of equity per trade
- Adjustable based on risk tolerance
- Smaller positions recommended for leveraged trading
### Stop Loss & Take Profit
- **Stop Loss**: 2.0% (tight control of risk)
- **Take Profit**: 5.5% (2.75:1 reward-to-risk ratio)
- Both levels are fixed at entry to avoid emotional decisions
### Trailing Stop System
- Activates after 1.8% profit
- Trails at 1.3% below current price
- Locks in profits during extended trends
- Automatically adjusts as price moves in your favor
### Maximum Hold Time
- 36-48 hours maximum (configurable)
- Designed to minimize funding rate costs on futures
- Forces position closure to avoid excessive exposure
- Helps maintain capital velocity
## 📈 Key Features
### Trend Filters
- **ADX Filter**: Ensures sufficient trend strength (threshold: 20)
- **EMA Alignment**: All three EMAs must confirm trend direction
- **RSI Boundaries**: Avoids extreme overbought/oversold entries
### Volume Analysis
- Volume must exceed 20-period moving average
- Configurable multiplier (default: 1.0x)
- Helps identify institutional participation
### Automatic Exit Conditions
1. Take Profit target reached
2. Stop Loss triggered
3. Trailing stop activated
4. Trend reversal (EMA cross in opposite direction)
5. Maximum hold time exceeded
## 🎮 Recommended Settings
### For Spot Trading (Conservative)
```
Position Size: 15-20%
Stop Loss: 2.5%
Take Profit: 6.0%
Max Hold: 72 hours
Leverage: 1x
```
### For Futures 3-5x Leverage (Balanced)
```
Position Size: 12-15%
Stop Loss: 2.0%
Take Profit: 5.5%
Max Hold: 36 hours
Trailing: Active
```
### For Aggressive Trading 5-10x (High Risk)
```
Position Size: 8-12%
Stop Loss: 1.5%
Take Profit: 4.5%
Max Hold: 24 hours
ADX Filter: Disabled
```
## 📊 Performance Metrics
### Backtested Results (BTC/USDT 1H, 2 years)
- **Total Return**: ~19% (spot) / ~75% (5x leverage)*
- **Total Trades**: 240-300
- **Win Rate**: 49-52%
- **Profit Factor**: 1.25-1.50
- **Max Drawdown**: ~18-22%
- **Average Trade**: 0.5-3 days
*Leverage results exclude funding rates and real-world slippage
### Optimal Timeframes
- **1 Hour**: Best for active trading (recommended)
- **4 Hour**: More stable, fewer signals
- **15 Min**: High frequency (requires monitoring)
### Best Performing Assets
- BTC/USDT (most tested)
- ETH/USDT
- Major altcoins with good liquidity
- Not recommended for low-cap or illiquid pairs
## ⚙️ How to Use
1. **Add to Chart**: Apply strategy to 1H BTC/USDT chart
2. **Adjust Settings**: Configure risk parameters based on your preference
3. **Review Signals**: Green = Long, Red = Short, labels show signal count
4. **Monitor Performance**: Check strategy tester for detailed statistics
5. **Optimize**: Use strategy optimization to find best parameters for your market
## 🎨 Visual Indicators
The strategy provides clear visual feedback:
- **EMA Lines**: Blue (Fast), Red (Slow), Orange (Trend)
- **BUY/SELL Labels**: Show entry points with signal count
- **Stop/Target Lines**: Red (SL), Green (TP) displayed during active trades
- **Background Color**: Light green (long), light red (short) when in position
- **Info Panel**: Shows current trend, RSI, ADX, and volume status
## ⚠️ Important Notes
### Risk Disclaimer
- This strategy is for educational purposes only
- Past performance does not guarantee future results
- Cryptocurrency trading involves substantial risk
- Only trade with capital you can afford to lose
- Always use proper position sizing and risk management
### Limitations
- Performs poorly in sideways/choppy markets
- Requires sufficient liquidity for best execution
- Backtests do not include:
- Real-world slippage (especially during volatility)
- Funding rates (for perpetual futures)
- Exchange downtime or connection issues
- Emotional trading decisions
### For Futures Trading
If using this strategy on futures with leverage:
- Reduce position size proportionally to leverage
- Account for funding rates (~0.01% per 8h)
- Set max hold time to minimize funding costs
- Use lower leverage (3-5x max recommended)
- Monitor liquidation price carefully
## 🔧 Customization
All parameters are fully customizable:
- EMA periods (fast/slow/trend)
- MACD settings (12/26/9)
- RSI levels (30/70)
- Stop Loss / Take Profit percentages
- Trailing stop activation and offset
- Volume multiplier
- ADX threshold
- Maximum hold time
## 📚 Strategy Logic
The strategy follows this decision tree:
```
1. Check Trend Direction (EMA alignment)
↓
2. Scan for Entry Signals (8 types)
↓
3. Confirm with Filters (ADX, Volume, RSI)
↓
4. Enter Position with Fixed SL/TP
↓
5. Monitor for Exit Conditions:
- TP Hit → Close with profit
- SL Hit → Close with loss
- Trailing Active → Follow price
- Trend Reversal → Close position
- Max Time → Force close
```
## 🎓 Best Practices
1. **Start Conservative**: Use smaller position sizes initially
2. **Track Performance**: Monitor actual vs backtested results
3. **Optimize Regularly**: Market conditions change, adapt parameters
4. **Combine with Analysis**: Don't rely solely on automated signals
5. **Manage Emotions**: Stick to the system, avoid manual overrides
6. **Paper Trade First**: Test on demo before risking real capital
## 📞 Support & Updates
This strategy is actively maintained and updated based on:
- Market condition changes
- User feedback and suggestions
- Performance optimization
- Bug fixes and improvements
## 🏆 Conclusion
Triple EMA Multi-Signal Strategy offers a robust, systematic approach to cryptocurrency trading by combining trend following, momentum indicators, and strict risk management. Its multi-signal confirmation system helps filter false signals while the trailing stop mechanism captures extended trends.
The strategy is suitable for both manual traders looking for high-probability setups and algorithmic traders seeking a proven systematic approach.
**Remember**: No strategy wins 100% of the time. Success comes from consistent application, proper risk management, and continuous adaptation to changing market conditions.
---
*Version: 1.0*
*Last Updated: November 2025*
*Tested on: BTC/USDT, ETH/USDT (1H, 4H timeframes)*
*Recommended Capital: $5,000+ for optimal position sizing*
