Enhanced KLSE Banker Flow Oscillator# Enhanced KLSE Banker Flow Oscillator
## Description
The Enhanced KLSE Banker Flow Oscillator is a sophisticated technical analysis tool designed specifically for the Malaysian stock market (KLSE). This indicator analyzes price and volume relationships to identify potential smart money movements, providing early signals for market reversals and continuation patterns.
The oscillator measures the buying and selling pressure in the market with a focus on detecting institutional activity. By combining money flow calculations with volume filters and price action analysis, it helps traders identify high-probability trading opportunities with reduced noise.
## Key Features
- Dual-Timeframe Analysis: Combines long-term money flow trends with short-term momentum shifts for more accurate signals
- Adaptive Volume Filtering: Automatically adjusts volume thresholds based on recent market conditions
- Advanced Divergence Detection: Identifies potential trend reversals through price-flow divergences
- Early Signal Detection: Provides anticipatory signals before major price movements occur
- Multiple Signal Types: Offers both early alerts and strong confirmation signals with clear visual markers
- Volatility Adjustment: Adapts sensitivity based on current market volatility for more reliable signals
- Comprehensive Visual Feedback: Color-coded oscillator, signal markers, and optional text labels
- Customizable Display Options: Toggle momentum histogram, early signals, and zone fills
- Organized Settings Interface: Logically grouped parameters for easier configuration
## Indicator Components
1. Main Oscillator Line: The primary banker flow line that fluctuates above and below zero
2. Early Signal Line: Secondary indicator showing potential emerging signals
3. Momentum Histogram: Visual representation of flow momentum changes
4. Zone Fills: Color-coded background highlighting positive and negative zones
5. Signal Markers: Visual indicators for entry and exit points
6. Reference Lines: Key levels for strong and early signals
7. Signal Labels: Optional text annotations for significant signals
## Signal Types
1. Strong Buy Signal (Green Arrow): Major bullish signal with high probability of success
2. Strong Sell Signal (Red Arrow): Major bearish signal with high probability of success
3. Early Buy Signal (Blue Circle): First indication of potential bullish trend
4. Early Sell Signal (Red Circle): First indication of potential bearish trend
5. Bullish Divergence (Yellow Triangle Up): Price making lower lows while flow makes higher lows
6. Bearish Divergence (Yellow Triangle Down): Price making higher highs while flow makes lower highs
## Parameters Explained
### Core Settings
- MFI Base Length (14): Primary calculation period for money flow index
- Short-term Flow Length (5): Calculation period for early signals
- KLSE Sensitivity (1.8): Multiplier for flow calculations, higher = more sensitive
- Smoothing Length (5): Smoothing period for the main oscillator line
### Volume Filter Settings
- Volume Filter % (65): Minimum volume threshold as percentage of average
- Use Adaptive Volume Filter (true): Dynamically adjusts volume thresholds
### Signal Levels
- Strong Signal Level (15): Threshold for strong buy/sell signals
- Early Signal Level (10): Threshold for early buy/sell signals
- Early Signal Threshold (0.75): Sensitivity factor for early signals
### Advanced Settings
- Divergence Lookback (34): Period for checking price-flow divergences
- Show Signal Labels (true): Toggle text labels for signals
### Visual Settings
- Show Momentum Histogram (true): Toggle the momentum histogram display
- Show Early Signal (true): Toggle the early signal line display
- Show Zone Fills (true): Toggle background color fills
## How to Use This Indicator
### Installation
1. Add the indicator to your TradingView chart
2. Default settings are optimized for KLSE stocks
3. Customize parameters if needed for specific stocks
### Basic Interpretation
- Oscillator Above Zero: Bullish bias, buying pressure dominates
- Oscillator Below Zero: Bearish bias, selling pressure dominates
- Crossing Zero Line: Potential shift in market sentiment
- Extreme Readings: Possible overbought/oversold conditions
### Advanced Interpretation
- Divergences: Early warning of trend exhaustion
- Signal Confluences: Multiple signal types appearing together increase reliability
- Volume Confirmation: Signals with higher volume are more significant
- Momentum Alignment: Histogram should confirm direction of main oscillator
### Trading Strategies
#### Trend Following Strategy
1. Identify market trend direction
2. Wait for pullbacks shown by oscillator moving against trend
3. Enter when oscillator reverses back in trend direction with a Strong signal
4. Place stop loss below/above recent swing low/high
5. Take profit at previous resistance/support levels
#### Counter-Trend Strategy
1. Look for oscillator reaching extreme levels
2. Identify divergence between price and oscillator
3. Wait for oscillator to cross Early signal threshold
4. Enter position against prevailing trend
5. Use tight stop loss (1 ATR from entry)
6. Take profit at first resistance/support level
#### Breakout Confirmation Strategy
1. Identify stock consolidating in a range
2. Wait for price to break out of range
3. Confirm breakout with oscillator crossing zero line in breakout direction
4. Enter position in breakout direction
5. Place stop loss below/above the breakout level
6. Trail stop as price advances
### Signal Hierarchy and Reliability
From highest to lowest reliability:
1. Strong Buy/Sell signals with divergence and high volume
2. Strong Buy/Sell signals with high volume
3. Divergence signals followed by Early signals
4. Strong Buy/Sell signals with normal volume
5. Early Buy/Sell signals with high volume
6. Early Buy/Sell signals with normal volume
## Complete Trading Plan Example
### KLSE Market Trading System
#### Pre-Trading Preparation
1. Review overall market sentiment (bullish, bearish, or neutral)
2. Scan for stocks showing significant banker flow signals
3. Note key support/resistance levels for watchlist stocks
4. Prioritize trade candidates based on signal strength and volume
#### Entry Rules for Long Positions
1. Banker Flow Oscillator above zero line (positive flow environment)
2. One or more of the following signals present:
- Strong Buy signal (green arrow)
- Bullish Divergence signal (yellow triangle up)
- Early Buy signal (blue circle) with confirming price action
3. Entry confirmation requirements:
- Volume above 65% of 20-day average
- Price above short-term moving average (e.g., 20 EMA)
- No immediate resistance within 3% of entry price
4. Entry on the next candle open after signal confirmation
#### Entry Rules for Short Positions
1. Banker Flow Oscillator below zero line (negative flow environment)
2. One or more of the following signals present:
- Strong Sell signal (red arrow)
- Bearish Divergence signal (yellow triangle down)
- Early Sell signal (red circle) with confirming price action
3. Entry confirmation requirements:
- Volume above 65% of 20-day average
- Price below short-term moving average (e.g., 20 EMA)
- No immediate support within 3% of entry price
4. Entry on the next candle open after signal confirmation
#### Position Sizing Rules
1. Base risk per trade: 1% of trading capital
2. Position size calculation: Capital × Risk% ÷ Stop Loss Distance
3. Position size adjustments:
- Increase by 20% for Strong signals with above-average volume
- Decrease by 20% for Early signals without confirming price action
- Standard size for all other valid signals
#### Stop Loss Placement
1. For Long Positions:
- Place stop below the most recent swing low
- Minimum distance: 1.5 × ATR(14)
- Maximum risk: 1% of trading capital
2. For Short Positions:
- Place stop above the most recent swing high
- Minimum distance: 1.5 × ATR(14)
- Maximum risk: 1% of trading capital
#### Take Profit Strategy
1. First Target (33% of position):
- 1.5:1 reward-to-risk ratio
- Move stop to breakeven after reaching first target
2. Second Target (33% of position):
- 2.5:1 reward-to-risk ratio
- Trail stop at previous day's low/high
3. Final Target (34% of position):
- 4:1 reward-to-risk ratio or
- Exit when opposing signal appears (e.g., Strong Sell for long positions)
#### Trade Management Rules
1. After reaching first target:
- Move stop to breakeven
- Consider adding to position if new confirming signal appears
2. After reaching second target:
- Trail stop using banker flow signals
- Exit remaining position when:
- Oscillator crosses zero line in opposite direction
- Opposing signal appears
- Price closes below/above trailing stop level
3. Maximum holding period:
- 20 trading days for trend-following trades
- 10 trading days for counter-trend trades
- Re-evaluate if targets not reached within timeframe
#### Risk Management Safeguards
1. Maximum open positions: 5 trades
2. Maximum sector exposure: 40% of trading capital
3. Maximum daily drawdown limit: 3% of trading capital
4. Mandatory stop trading rules:
- After three consecutive losing trades
- After reaching 5% account drawdown
- Resume after two-day cooling period and strategy review
#### Performance Tracking
1. Track for each trade:
- Signal type that triggered entry
- Oscillator reading at entry and exit
- Volume relative to average
- Price action confirmation patterns
- Holding period
- Reward-to-risk achieved
2. Review performance metrics weekly:
- Win rate by signal type
- Average reward-to-risk ratio
- Profit factor
- Maximum drawdown
3. Adjust strategy parameters based on performance:
- Increase position size for highest performing signals
- Decrease or eliminate trades based on underperforming signals
## Advanced Usage Tips
1. Combine with Support/Resistance:
- Signals are more reliable when they occur at key support/resistance levels
- Look for banker flow divergence at major price levels
2. Multiple Timeframe Analysis:
- Use the oscillator on both daily and weekly timeframes
- Stronger signals when both timeframes align
- Enter on shorter timeframe when confirmed by longer timeframe
3. Sector Rotation Strategy:
- Compare banker flow across different sectors
- Rotate capital to sectors showing strongest positive flow
- Avoid sectors with persistent negative flow
4. Volatility Adjustments:
- During high volatility periods, wait for Strong signals only
- During low volatility periods, Early signals can be more actionable
5. Optimizing Parameters:
- For more volatile stocks: Increase Smoothing Length (6-8)
- For less volatile stocks: Decrease KLSE Sensitivity (1.2-1.5)
- For intraday trading: Reduce all length parameters by 30-50%
## Fine-Tuning for Different Markets
While optimized for KLSE, the indicator can be adapted for other markets:
1. For US Stocks:
- Reduce KLSE Sensitivity to 1.5
- Increase Volume Filter to 75%
- Adjust Strong Signal Level to 18
2. For Forex:
- Increase Smoothing Length to 8
- Reduce Early Signal Threshold to 0.6
- Focus more on divergence signals than crossovers
3. For Cryptocurrencies:
- Increase KLSE Sensitivity to 2.2
- Reduce Signal Levels (Strong: 12, Early: 8)
- Use higher Volume Filter (80%)
By thoroughly understanding and properly implementing the Enhanced KLSE Banker Flow Oscillator, traders can gain a significant edge in identifying institutional money flow and making more informed trading decisions, particularly in the Malaysian stock market.
ค้นหาในสคริปต์สำหรับ "黄金近20年走势"

WIG20 Total Value-Weighted VolumeThis Pine Script creates a custom indicator for TradingView that calculates and visualizes the total "value-weighted volume" of the 20 stocks in the WIG20 index (a major Polish stock market index). Here's a breakdown of what it does:
Functionality:
Stock Selection:
The script allows you to input the ticker symbols for the 20 stocks that make up the WIG20 index (e.g., "PKO" for PKO Bank Polski, "PKN" for PKN Orlen, etc.). These are customizable via input fields, so you can adjust them to match the current WIG20 constituents.
Data Retrieval:
For each of the 20 stocks, it fetches two pieces of data from the current chart timeframe (e.g., daily, hourly):
Volume: The number of shares traded (e.g., v01 for the first stock).
Average Price: The midpoint price of the candle, calculated as (open + close) / 2 (e.g., p01 for the first stock). This represents a typical price for that period.
Value-Weighted Volume Calculation:
For each stock, it multiplies the volume by its average price (e.g., vw01 = v01 * p01). This converts the raw volume (in shares) into a monetary value (e.g., in Polish złoty, PLN, assuming the prices are in PLN).
The result, called "value-weighted volume," reflects the total monetary amount traded for each stock rather than just the number of shares.
Total Value-Weighted Volume:
It sums the value-weighted volumes of all 20 stocks into a single value, totalValueVolume. This represents the combined monetary trading activity across the WIG20 index for each time period (e.g., each candle on the chart).
Statistical Analysis:
The script calculates a rolling mean and standard deviation of the totalValueVolume over a user-defined lookback period (default is 20 bars, adjustable via input).
It then computes a "3-sigma" threshold, which is the mean plus three times the standard deviation. This threshold identifies unusually high trading activity (statistically significant outliers).
Candle Direction:
It checks whether the current candle on the chart (e.g., the WIG20 index itself) is bullish or bearish:
Bullish: If the close price is higher than the open price (close > open).
Bearish: If the close price is lower than the open price (close < open).
Color-Coded Visualization:
The totalValueVolume is plotted as a histogram on the chart with dynamic colors:
Blue: If the value-weighted volume is below the 3-sigma threshold (normal trading activity).
Green: If the value-weighted volume exceeds the 3-sigma threshold and the candle is bullish (indicating unusually high buying activity).
Red: If the value-weighted volume exceeds the 3-sigma threshold and the candle is bearish (indicating unusually high selling activity).
Purpose:
What It Shows: The indicator highlights the total monetary trading volume across the WIG20 stocks, adjusted for each stock’s price, and flags periods of exceptional activity (above 3 sigma) with colors that indicate market direction (bullish or bearish).
Use Case: Traders or analysts might use this to:
Identify significant market events where trading volume spikes (e.g., news-driven moves).
Assess whether those spikes align with bullish (green) or bearish (red) sentiment, based on the WIG20 index’s price movement.
Compare monetary trading activity across different periods, rather than just share volume, which gives more weight to higher-priced stocks.
Key Features:
Customizable: You can tweak the stock symbols and lookback period to fit your needs.
Statistical Insight: The 3-sigma rule helps spot outliers in trading activity.
Visual Clarity: The histogram’s color changes make it easy to see when volume spikes occur and whether they’re tied to upward or downward price moves.
Example Output:
On a daily WIG20 chart, if one day’s total value-weighted volume is exceptionally high (above 3 sigma) and the WIG20 closes higher than it opened, the histogram bar for that day turns green. If it closes lower, it turns red. Otherwise, it stays blue.
In essence, this script transforms raw volume data into a price-adjusted, statistically informed indicator that visually emphasizes significant trading events with directional context!

Sector/Industry Relative StrengthOverview
The Sector/Industry Relative Strength (RS) Indicator is a powerful tool designed to help traders and investors analyze the performance of sectors and industries relative to the broader market (SPY). It provides real-time insights into sector and industry strength, helping you identify leading and lagging areas of the market.
Key Features
Sector and Industry Analysis:
Automatically detects the sector and industry of the current symbol.
Displays the corresponding sector and industry ETF.
Relative Strength (STS) Calculation:
Calculates the Sector/Industry Trend Strength (STS) by comparing the sector or industry ETF to SPY over the past 20 days.
STS is expressed as a percentile (0-100), indicating how strong the sector/industry ETF has been relative to SPY over the past 20 days.
Example: An STS of 70 means that during the past 20 days, the ETF’s relative strength against SPY was stronger than 70% of those days.
Sector Rank:
Ranks the current sector ETF against a predefined list of major sector ETFs.
Highlights whether the sector is outperforming or underperforming SPY (green if outperforming, red if underperforming).
Customizable Display:
Choose which elements to display (e.g., sector, industry, ETFs, STS, sector rank).
Customize table position, size, text alignment, and colors.
Real-Time Performance:
Tracks daily price changes for sector and industry ETFs.
Displays percentage change from open to close.
How to Use
Add the Indicator:
Apply the indicator to any stock or ETF chart.
The script will automatically detect the sector and industry of the selected symbol.
Interpret the Data:
Sector/Industry: Displays the current sector and industry.
ETF: Shows the corresponding sector and industry ETF.
STS (Sector/Industry Trend Strength): A percentile score (0-100) indicating the relative strength of the sector/industry ETF compared to SPY over the past 20 days.
Sector Rank: Ranks the sector ETF against other major sectors (e.g., "3/12" means the sector is ranked 3rd out of 12).
Customize the Display:
Use the input settings to:
Show/hide specific elements (e.g., sector, industry, ETFs, STS, sector rank).
Adjust the table position, size, and text alignment.
Change colors for positive/negative changes.
Make Informed Decisions:
Use the STS score and sector rank to identify potential trading opportunities.
Focus on sectors and industries with high STS scores and strong rankings (green).
Input Parameters
Table Settings:
Table Position: Choose where to display the table (Top Left, Top Right, Bottom Left, Bottom Right).
Table Size: Adjust the size of the table (Tiny, Small, Normal, Large).
Text Color: Customize the text color.
Background Color: Set the table background color.
Display Options:
Show ETFs: Toggle the display of sector and industry ETFs.
Show STS: Toggle the display of the Sector/Industry Trend Strength (STS) score.
Show Sector/Industry: Toggle the display of sector and industry information.
Show Sector Rank: Toggle the display of the sector rank.
Parameters:
Sector Rank Time Length: Set the number of days used for calculating the sector rank (default: 20).
Example Use Cases
Sector Rotation:
Identify sectors with high STS scores and strong rankings (green) to allocate capital.
Avoid sectors with low STS scores and weak rankings (red).
Industry Analysis:
Compare the STS scores of different industries within the same sector.
Use the STS score to gauge relative strength and identify potential opportunities.
Market Timing:
Use the STS score and sector rank to time entries and exits in sector-specific ETFs.
Combine with other technical indicators for confirmation.
Trend & ADX by Gideon for Indian MarketsThis indicator is designed to help traders **identify strong trends** using the **Kalman Filter** and **ADX** (Average Directional Index). It provides **Buy/Sell signals** based on trend direction and ADX strength. I wanted to create something for Indian markets since there are not much available.
In a nut-shell:
✅ **Buy when the Kalman Filter turns green, and ADX is strong.
❌ **Sell when the Kalman Filter turns red, and ADX is strong.
📌 **Ignore signals if ADX is weak (below threshold).
📊 Use on 5-minute timeframes for intraday trading.
------------------------------------------------------------------------
1. Understanding the Indicator Components**
- **Green Line:** Indicates an **uptrend**.
- **Red Line:** Indicates a **downtrend**.
- The **line color change** signals a potential **trend reversal**.
**ADX Strength Filter**
- The **ADX (orange line)** measures trend strength.
- The **blue horizontal line** marks the **ADX threshold** (default: 20).
- A **Buy/Sell signal is only valid if ADX is above the threshold**, ensuring a strong trend.
**Buy & Sell Signals**
- **Buy Signal (Green Up Arrow)**
- Appears **one candle before** the Kalman line turns green.
- ADX must be **above the threshold** (default: 20).
- Suggests entering a **long position**.
- **Sell Signal (Red Down Arrow)**
- Appears **one candle before** the Kalman line turns red.
- ADX must be **above the threshold** (default: 20).
- Suggests entering a **short position**.
2. Best Settings for 5-Minute Timeframe**
For day trading on the **5-minute chart**, the following settings work best:
- **Kalman Filter Length:** `50`
- **Process Noise (Q):** `0.1`
- **Measurement Noise (R):** `0.01`
- **ADX Length:** `14`
- **ADX Threshold:** `20`
- **(Increase to 25-30 for more reliable signals in volatile markets)**
3. How to Trade with This Indicator**
**Entry Rules**
✅ **Buy Entry**
- Wait for a **green arrow (Buy Signal).
- Kalman Line must **turn green**.
- ADX must be **above the threshold** (strong trend confirmed).
- Enter a **long position** on the next candle.
❌ **Sell Entry**
- Wait for a **red arrow (Sell Signal).
- Kalman Line must **turn red**.
- ADX must be **above the threshold** (strong trend confirmed).
- Enter a **short position** on the next candle.
**Exit & Risk Management**
📌 **Stop Loss**:
- Place stop-loss **below the previous swing low** (for buys) or **above the previous swing high** (for sells).
📌 **Take Profit:
- Use a **Risk:Reward Ratio of 1:2 or 1:3.
- Exit when the **Kalman Filter color changes** (opposite trend signal).
📌 **Avoid Weak Trends**:
- **No trades when ADX is below the threshold** (low trend strength).
4. Additional Tips
- Works best on **liquid assets** like **Bank Nifty, Nifty 50, and large-cap stocks**.
- **Avoid ranging markets** with low ADX values (<20).
- Use alongside **volume analysis and support/resistance levels** for confirmation.
- Experiment with **ADX Threshold (increase for stronger signals, decrease for more trades).**
Best of Luck traders ! 🚀

Mean Reversion Pro Strategy [tradeviZion]Mean Reversion Pro Strategy : User Guide
A mean reversion trading strategy for daily timeframe trading.
Introduction
Mean Reversion Pro Strategy is a technical trading system that operates on the daily timeframe. The strategy uses a dual Simple Moving Average (SMA) system combined with price range analysis to identify potential trading opportunities. It can be used on major indices and other markets with sufficient liquidity.
The strategy includes:
Trading System
Fast SMA for entry/exit points (5, 10, 15, 20 periods)
Slow SMA for trend reference (100, 200 periods)
Price range analysis (20% threshold)
Position management rules
Visual Elements
Gradient color indicators
Three themes (Dark/Light/Custom)
ATR-based visuals
Signal zones
Status Table
Current position information
Basic performance metrics
Strategy parameters
Optional messages
📊 Strategy Settings
Main Settings
Trading Mode
Options: Long Only, Short Only, Both
Default: Long Only
Position Size: 10% of equity
Starting Capital: $20,000
Moving Averages
Fast SMA: 5, 10, 15, or 20 periods
Slow SMA: 100 or 200 periods
Default: Fast=5, Slow=100
🎯 Entry and Exit Rules
Long Entry Conditions
All conditions must be met:
Price below Fast SMA
Price below 20% of current bar's range
Price above Slow SMA
No existing position
Short Entry Conditions
All conditions must be met:
Price above Fast SMA
Price above 80% of current bar's range
Price below Slow SMA
No existing position
Exit Rules
Long Positions
Exit when price crosses above Fast SMA
No fixed take-profit levels
No stop-loss (mean reversion approach)
Short Positions
Exit when price crosses below Fast SMA
No fixed take-profit levels
No stop-loss (mean reversion approach)
💼 Risk Management
Position Sizing
Default: 10% of equity per trade
Initial capital: $20,000
Commission: 0.01%
Slippage: 2 points
Maximum one position at a time
Risk Control
Use daily timeframe only
Avoid trading during major news events
Consider market conditions
Monitor overall exposure
📊 Performance Dashboard
The strategy includes a comprehensive status table displaying:
Strategy Parameters
Current SMA settings
Trading direction
Fast/Slow SMA ratio
Current Status
Active position (Flat/Long/Short)
Current price with color coding
Position status indicators
Performance Metrics
Net Profit (USD and %)
Win Rate with color grading
Profit Factor with thresholds
Maximum Drawdown percentage
Average Trade value
📱 Alert Settings
Entry Alerts
Long Entry (Buy Signal)
Short Entry (Sell Signal)
Exit Alerts
Long Exit (Take Profit)
Short Exit (Take Profit)
Alert Message Format
Strategy name
Signal type and direction
Current price
Fast SMA value
Slow SMA value
💡 Usage Tips
Consider starting with Long Only mode
Begin with default settings
Keep track of your trades
Review results regularly
Adjust settings as needed
Follow your trading plan
⚠️ Disclaimer
This strategy is for educational and informational purposes only. It is not financial advice. Always:
Conduct your own research
Test thoroughly before live trading
Use proper risk management
Consider your trading goals
Monitor market conditions
Never risk more than you can afford to lose
📋 Release Notes
14 January 2025
Added New Fast & Slow SMA Options:
Fibonacci-based periods: 8, 13, 21, 144, 233, 377
Additional period: 50
Complete Fast SMA options now: 5, 8, 10, 13, 15, 20, 21, 34, 50
Complete Slow SMA options now: 100, 144, 200, 233, 377
Bug Fixes:
Fixed Maximum Drawdown calculation in the performance table
Now using strategy.max_drawdown_percent for accurate DD reporting
Previous version showed incorrect DD values
Performance metrics now accurately reflect trading results
Performance Note:
Strategy tested with Fast/Slow SMA 13/377
Test conducted with 10% equity risk allocation
Daily Timeframe
For Beginners - How to Modify SMA Levels:
Find this line in the code:
fastLength = input.int(title="Fast SMA Length", defval=5, options= )
To add a new Fast SMA period: Add the number to the options list, e.g.,
To remove a Fast SMA period: Remove the number from the options list
For Slow SMA, find:
slowLength = input.int(title="Slow SMA Length", defval=100, options= )
Modify the options list the same way
⚠️ Note: Keep the periods that make sense for your trading timeframe
💡 Tip: Test any new combinations thoroughly before live trading
"Trade with Discipline, Manage Risk, Stay Consistent" - tradeviZion

Enhanced SMA Signal Box With TargetsEnhanced SMA Signal Box With Targets
The Enhanced SMA Signal Box With Targets indicator is a versatile tool designed to help traders identify buy and sell signals based on various technical analysis methods, including Simple Moving Averages (SMA), Exponential Moving Averages (EMA), and Average True Range (ATR). This indicator provides clear visual signals and target levels to assist traders in making informed decisions.
Key Features
Simple Moving Averages (SMA):
20 SMA: Represents short-term price trends.
50 SMA: Represents long-term price trends.
Exponential Moving Average (EMA):
50 EMA: Adds additional trend confirmation to the SMA.
Signal Visualization:
Buy Signals: Displayed with a green "🚀" emoji below the candle when the closing price crosses above the 20 SMA.
Sell Signals: Displayed with a red "💣" emoji above the candle when the closing price crosses below the 20 SMA.
Yellow Box: Highlights the signal candle, making it easy to identify the most recent and historical signals.
Target Prices:
First Target: Based on the size of the signal candle.
Second and Third Targets: Calculated using the ATR multiplied by a user-defined factor to help set profit-taking levels.
Customizable Filters:
MACD Filter: Users can enable this filter to use MACD line crossings for signal confirmation.
Higher Timeframe SMA Filter: Users can set a higher timeframe SMA to filter signals based on the long-term trend.
Volume Filter: Users can set a minimum volume threshold for signals.
Alerts:
Users can enable alerts for buy and sell signals, ensuring they never miss a trading opportunity.
Customizable Settings:
Line Colors and Thickness: Users can adjust the colors and thickness of the SMAs, EMA, and signal boxes.
Signal Emojis: Users can choose custom emojis for buy and sell signals.
How It Works
Trend Calculation: The indicator calculates short-term and long-term trends using the 20 SMA, 50 SMA, and 50 EMA.
Signal Generation: Buy and sell signals are generated when the price crosses the 20 SMA, with optional confirmation from MACD and volume filters.
Target Calculation: Profit targets are based on the size of the signal candle and ATR, helping traders set realistic profit-taking levels.
Important Notice
This indicator is designed for educational purposes and should not be considered as financial advice. Past performance does not guarantee future results. Users should conduct their own research and analysis before making any trading decisions. Trading involves substantial risk and is not suitable for every investor. Always consider your financial situation, investment objectives, and risk tolerance before trading. Please ensure you comply with all the relevant regulations and TradingView's house rules while using this indicator.

Logarithmic Regression AlternativeLogarithmic regression is typically used to model situations where growth or decay accelerates rapidly at first and then slows over time. Bitcoin is a good example.
𝑦 = 𝑎 + 𝑏 * ln(𝑥)
With this logarithmic regression (log reg) formula 𝑦 (price) is calculated with constants 𝑎 and 𝑏, where 𝑥 is the bar_index .
Instead of using the sum of log x/y values, together with the dot product of log x/y and the sum of the square of log x-values, to calculate a and b, I wanted to see if it was possible to calculate a and b differently.
In this script, the log reg is calculated with several different assumed a & b values, after which the log reg level is compared to each Swing. The log reg, where all swings on average are closest to the level, produces the final 𝑎 & 𝑏 values used to display the levels.
🔶 USAGE
The script shows the calculated logarithmic regression value from historical swings, provided there are enough swings, the price pattern fits the log reg model, and previous swings are close to the calculated Top/Bottom levels.
When the price approaches one of the calculated Top or Bottom levels, these levels could act as potential cycle Top or Bottom.
Since the logarithmic regression depends on swing values, each new value will change the calculation. A well-fitted model could not fit anymore in the future.
Swings are based on Weekly bars. A Top Swing, for example, with Swing setting 30, is the highest value in 60 weeks. Thirty bars at the left and right of the Swing will be lower than the Top Swing. This means that a confirmation is triggered 30 weeks after the Swing. The period will be automatically multiplied by 7 on the daily chart, where 30 becomes 210 bars.
Please note that the goal of this script is not to show swings rapidly; it is meant to show the potential next cycle's Top/Bottom levels.
🔹 Multiple Levels
The script includes the option to display 3 Top/Bottom levels, which uses different values for the swing calculations.
Top: 'high', 'maximum open/close' or 'close'
Bottom: 'low', 'minimum open/close' or 'close'
These levels can be adjusted up/down with a percentage.
Lastly, an "Average" is included for each set, which will only be visible when "AVG" is enabled, together with both Top and Bottom levels.
🔹 Notes
Users have to check the validity of swings; the above example only uses 1 Top Swing for its calculations, making the Top level unreliable.
Here, 1 of the Bottom Swings is pretty far from the bottom level, changing the swing settings can give a more reliable bottom level where all swings are close to that level.
Note the display was set at "Logarithmic", it can just as well be shown as "Regular"
In the example below, the price evolution does not fit the logarithmic regression model, where growth should accelerate rapidly at first and then slows over time.
Please note that this script can only be used on a daily timeframe or higher; using it at a lower timeframe will show a warning. Also, it doesn't work with bar-replay.
🔶 DETAILS
The code gathers data from historical swings. At the last bar, all swings are calculated with different a and b values. The a and b values which results in the smallest difference between all swings and Top/Bottom levels become the final a and b values.
The ranges of a and b are between -20.000 to +20.000, which means a and b will have the values -20.000, -19.999, -19.998, -19.997, -19.996, ... -> +20.000.
As you can imagine, the number of calculations is enormous. Therefore, the calculation is split into parts, first very roughly and then very fine.
The first calculations are done between -20 and +20 (-20, -19, -18, ...), resulting in, for example, 4.
The next set of calculations is performed only around the previous result, in this case between 3 (4-1) and 5 (4+1), resulting in, for example, 3.9. The next set goes even more in detail, for example, between 3.8 (3.9-0.1) and 4.0 (3.9 + 0.1), and so on.
1) -20 -> +20 , then loop with step 1 (result (example): 4 )
2) 4 - 1 -> 4 +1 , then loop with step 0.1 (result (example): 3.9 )
3) 3.9 - 0.1 -> 3.9 +0.1 , then loop with step 0.01 (result (example): 3.93 )
4) 3.93 - 0.01 -> 3.93 +0.01, then loop with step 0.001 (result (example): 3.928)
This ensures complicated calculations with less effort.
These calculations are done at the last bar, where the levels are displayed, which means you can see different results when a new swing is found.
Also, note that this indicator has been developed for a daily (or higher) timeframe chart.
🔶 SETTINGS
Three sets
High/Low
• color setting
• Swing Length settings for 'High' & 'Low'
• % adjustment for 'High' & 'Low'
• AVG: shows average (when both 'High' and 'Low' are enabled)
Max/Min (maximum open/close, minimum open/close)
• color setting
• Swing Length settings for 'Max' & 'Min'
• % adjustment for 'Max' & 'Min'
• AVG: shows average (when both 'Max' and 'Min' are enabled)
Close H/Close L (close Top/Bottom level)
• color setting
• Swing Length settings for 'Close H' & 'Close L'
• % adjustment for 'Close H' & 'Close L'
• AVG: shows average (when both 'Close H' and 'Close L' are enabled)
Show Dashboard, including Top/Bottom levels of the desired source and calculated a and b values.
Show Swings + Dot size

ADX and DI Trend meter and status table IndicatorThis ADX (Average Directional Index) and DI (Directional Indicator) indicator helps identify:
Trend Direction & Strength:
LONG: +DI above -DI with ADX > 20
SHORT: -DI above +DI with ADX > 20
RANGE: ADX < 20 indicates choppy/sideways market
Trading Signals:
Bullish: +DI crosses above -DI (green triangle)
Bearish: -DI crosses below +DI (red triangle)
ADX Strength Levels:
Strong: ADX ≥ 50
Moderate: ADX 30-49
Weak: ADX 20-29
No Trend: ADX < 20
Best Uses:
Trend confirmation before entering trades
Identifying ranging vs trending markets
Exit signal when trend weakens
Works well on multiple timeframes
Most effective in combination with other indicators
The table displays current trend direction and ADX strength in real-time
Arshtiq - Multi-Timeframe Trend StrategyMulti-Timeframe Setup:
The script uses two distinct timeframes: a higher (daily) timeframe for identifying the trend and a lower (hourly) timeframe for making trades. This combination allows the script to follow the larger trend while timing entries and exits with more precision on a shorter timeframe.
Moving Averages Calculation:
higher_ma: The 20-period Simple Moving Average (SMA) calculated based on the daily timeframe. This average gives a sense of the larger trend direction.
lower_ma: The 20-period SMA calculated on the hourly (current) timeframe, providing a dynamic level for detecting entry and exit points within the broader trend.
Trend Identification:
Bullish Trend: The script determines that a bullish trend is present if the current price is above the daily moving average (higher_ma).
Bearish Trend: Similarly, a bearish trend is identified when the current price is below this daily moving average.
Trade Signals:
Buy Signal: A buy signal is generated when the price on the hourly chart crosses above the hourly 20-period MA, but only if the higher (daily) timeframe trend is bullish. This ensures that buy trades align with the larger upward trend.
Sell Signal: A sell signal is generated when the price on the hourly chart crosses below the hourly 20-period MA, but only if the daily trend is bearish. This ensures that sell trades are consistent with the broader downtrend.
Plotting and Visual Cues:
Higher Timeframe MA: The daily 20-period moving average is plotted in red to help visualize the long-term trend.
Buy and Sell Signals: Buy signals appear as green labels below the price bars with the text "BUY," while sell signals appear as red labels above the bars with the text "SELL."
Background Coloring: The background changes color based on the identified trend for easier trend recognition:
Green (with transparency) when the daily trend is bullish.
Red (with transparency) when the daily trend is bearish.

Price Action All In OneThis indicator represents the most advanced level of price action indicators, incorporating six useful features: traditional gaps, shadow gaps, bar counting, moving averages, previous values, and IO pattern matching .
When I refer to price action, I mean the teachings of Dr. Al Brooks.
While you can find these features in other indicators, mine is more advanced. The default settings are designed to work on a 5-minute timeframe, but you can also use this indicator on other time periods if you prefer.
Gaps
Traditional Gaps: Occurs when the lowest price of a bar is higher than the highest price of the previous bar, or the highest price of a bar is lower than the lowest price of the previous bar.
Shadow/Tail Gaps: Occurs when the lowest price of a bar is higher than the highest price of the second last bar, or the highest price of a bar is lower than the lowest price of the second last bar.
Gaps indicate strength, and consecutive gaps in one direction are characteristic of a strong trend. They offer a perspective on the strength of a trend, signifying that limit orders on one side are at a loss with no opportunity to exit at breakeven. Can bulls or bears create gaps? Are the gaps they create filled, or do they remain open?
Traditional Gaps & Shadow/Tail Gaps
Bar Counting
The ability to use different timeframes (e.g., to determine the minute within an hour or the hour within a week).
Consistent display of 1; in other indicators, if you set intervals to 2, you see 2, 4, 6, etc., or 1, 2, 4, 6. In my indicator, you will see 1, 3, 5, etc.
In intraday trading, certain specific times are more important than others. For example, a form of reversal is more likely to occur at the midpoint of the trading day (if there are 80 candles in a day, the midpoint is at the 40th candle).
This doesn't mean you should make reversal trades at the 40th candle. The bar count feature simply reminds you of the current time, helping you gauge how long until the trading day ends. For instance, if there are 80 candles in a day and you're an intraday trader, you probably shouldn't make a swing trade at the 70th candle because there are only 10 candles left until the close—likely not enough time for a swing to develop.
Additionally, if you trade on a 5-minute timeframe, seeing candles numbered 3, 6, 9, etc. indicates the close of a 15-minute candle. This means that in addition to 5-minute timeframe traders, 15-minute timeframe traders will also pay attention to these candles, making them more significant. For the same reason, the 12th candle is crucial, as its close also marks the close of an hourly candle.
Day Time Frame & Week Time Frame
Moving Averages
Provides three EMAs. You can set different timeframes and choose between continuous or discrete modes.
Moving averages are excellent tools for determining trends. The 20 EMA is particularly popular, which increases its significance. Traders using different timeframes, such as 5-minute, 15-minute, and 1-hour, all utilize the 20 EMA. This indicator allows you to see what traders on 15-minute and 1-hour timeframes are observing, even when you're on a 5-minute timeframe.
Once again, the default settings of this indicator assume that the user is trading intraday on a 5-minute timeframe. However, if that's not the case, you can easily adjust the moving average periods. For instance, if you trade on a 1-hour timeframe and want to display the 4-hour and daily moving averages on your chart, this can be done effortlessly.
5m 20, 15m 20 & 1h 20
Previous Values
Features three previous value displays. You can set their sources and timeframes independently and define the range for all previous values.
For intraday trading, marking the previous day's high, low, and close prices can be crucial. While some other indicators provide this feature, mine does it better. You can set different timeframes and choose various sources. For example, you might want to display the average of (O+H+L+C)/4 for the last week.
In addition to setting the timeframe and source, you can also configure the display range:
All: This will show the data in all positions. For example, you can see the high price from two days ago on yesterday's chart.
Today: This will only display the previous day's high price on the current day's chart.
Timeframe: This will display the data based on the specified timeframe you set.
Last Week High, Last Day Close & Low(Timeframe Display)
IO Pattern Matching
More advanced than other IO pattern matching indicators. For adjacent IIs, it merges to display as III, IIII, and so on. The same applies to OO patterns. Additionally, it automatically merges adjacent IOI and II into IOII, and adjacent OO and IOI into IIOI.
II Pattern: This refers to two consecutive inside bar candles. On a lower timeframe, the II pattern forms a converging triangle, which is a breakout pattern. The II pattern could also potentially become a final flag, which is the last flag in a trend.
OO Pattern: This refers to two consecutive outside bar candles. On a lower timeframe, the OO pattern forms an expanding triangle. You can use the OO pattern similarly to how you would use an expanding triangle.
IOI Pattern: This pattern occurs when the first candle is contained within the second candle, and the third candle is also contained within the second candle. This is a breakout pattern and could similarly represent a terminal flag in a trend.
The appearance of II, OO, or IOI patterns does not necessarily mean you should make a reversal trade. These patterns are meant to mark potential moves in a lower timeframe within the current cycle, providing a new perspective on the market and reminding you to stay vigilant.
You shouldn't look for IO patterns in a tight trading range. There are many IO patterns in a tight trading range, but they don't hold much significance.
II, OO & IOI

Overnight Positioning w EMA - Strategy [presentTrading]I've recently started researching Market Timing strategies, and it’s proving to be quite an interesting area of study. The idea of predicting optimal times to enter and exit the market, based on historical data and various indicators, brings a dynamic edge to trading. Additionally, it is integrated with the 3commas bot for automated trade execution.
I'm still working on it. Welcome to share your point of view.
█ Introduction and How it is Different
The "Overnight Positioning with EMA " is designed to capitalize on market inefficiencies during the overnight trading period. This strategy takes a position shortly before the market closes and exits shortly after it opens the following day. What sets this strategy apart is the integration of an optional Exponential Moving Average (EMA) filter, which ensures that trades are aligned with the underlying trend. The strategy provides flexibility by allowing users to select between different global market sessions, such as the US, Asia, and Europe.
It is integrated with the 3commas bot for automated trade execution and has a built-in mechanism to avoid holding positions over the weekend by force-closing positions on Fridays before the market closes.
BTCUSD 20 mins Performance
█ Strategy, How it Works: Detailed Explanation
The core logic of this strategy is simple: enter trades before market close and exit them after market open, taking advantage of potential price movements during the overnight period. Here’s how it works in more detail:
🔶 Market Timing
The strategy determines the local market open and close times based on the selected market (US, Asia, Europe) and adjusts entry and exit points accordingly. The entry is triggered a specific number of minutes before market close, and the exit is triggered a specific number of minutes after market open.
🔶 EMA Filter
The strategy includes an optional EMA filter to help ensure that trades are taken in the direction of the prevailing trend. The EMA is calculated over a user-defined timeframe and length. The entry is only allowed if the closing price is above the EMA (for long positions), which helps to filter out trades that might go against the trend.
The EMA formula:
```
EMA(t) = +
```
Where:
- EMA(t) is the current EMA value
- Close(t) is the current closing price
- n is the length of the EMA
- EMA(t-1) is the previous period's EMA value
🔶 Entry Logic
The strategy monitors the market time in the selected timezone. Once the current time reaches the defined entry period (e.g., 20 minutes before market close), and the EMA condition is satisfied, a long position is entered.
- Entry time calculation:
```
entryTime = marketCloseTime - entryMinutesBeforeClose * 60 * 1000
```
🔶 Exit Logic
Exits are triggered based on a specified time after the market opens. The strategy checks if the current time is within the defined exit period (e.g., 20 minutes after market open) and closes any open long positions.
- Exit time calculation:
exitTime = marketOpenTime + exitMinutesAfterOpen * 60 * 1000
🔶 Force Close on Fridays
To avoid the risk of holding positions over the weekend, the strategy force-closes any open positions 5 minutes before the market close on Fridays.
- Force close logic:
isFriday = (dayofweek(currentTime, marketTimezone) == dayofweek.friday)
█ Trade Direction
This strategy is designed exclusively for long trades. It enters a long position before market close and exits the position after market open. There is no shorting involved in this strategy, and it focuses on capturing upward momentum during the overnight session.
█ Usage
This strategy is suitable for traders who want to take advantage of price movements that occur during the overnight period without holding positions for extended periods. It automates entry and exit times, ensuring that trades are placed at the appropriate times based on the market session selected by the user. The 3commas bot integration also allows for automated execution, making it ideal for traders who wish to set it and forget it. The strategy is flexible enough to work across various global markets, depending on the trader's preference.
█ Default Settings
1. entryMinutesBeforeClose (Default = 20 minutes):
This setting determines how many minutes before the market close the strategy will enter a long position. A shorter duration could mean missing out on potential movements, while a longer duration could expose the position to greater price fluctuations before the market closes.
2. exitMinutesAfterOpen (Default = 20 minutes):
This setting controls how many minutes after the market opens the position will be exited. A shorter exit time minimizes exposure to market volatility at the open, while a longer exit time could capture more of the overnight price movement.
3. emaLength (Default = 100):
The length of the EMA affects how the strategy filters trades. A shorter EMA (e.g., 50) reacts more quickly to price changes, allowing more frequent entries, while a longer EMA (e.g., 200) smooths out price action and only allows entries when there is a stronger underlying trend.
The effect of using a longer EMA (e.g., 200) would be:
```
EMA(t) = +
```
4. emaTimeframe (Default = 240):
This is the timeframe used for calculating the EMA. A higher timeframe (e.g., 360) would base entries on longer-term trends, while a shorter timeframe (e.g., 60) would respond more quickly to price movements, potentially allowing more frequent trades.
5. useEMA (Default = true):
This toggle enables or disables the EMA filter. When enabled, trades are only taken when the price is above the EMA. Disabling the EMA allows the strategy to enter trades without any trend validation, which could increase the number of trades but also increase risk.
6. Market Selection (Default = US):
This setting determines which global market's open and close times the strategy will use. The selection of the market affects the timing of entries and exits and should be chosen based on the user's preference or geographic focus.

MENTFX AVERAGES MULTI TIMEFRAMEThe MENTFX AVERAGES MULTIME TIMEFRAME indicator is designed to provide traders with the ability to visualize multiple moving averages (MAs) from higher timeframes on their current chart, regardless of the chart's timeframe. It combines the power of exponential moving averages (EMAs) to help traders identify trends, spot potential reversal points, and make more informed trading decisions.
Key Features:
Multi-Timeframe Moving Averages: This indicator plots moving averages from daily timeframes directly on your chart, helping you keep track of higher timeframe trends while trading in any timeframe.
Customizable Moving Averages: You can adjust the length and visibility of up to three EMAs (default settings are 5, 10, and 20-period EMAs) to suit your trading style.
Overlay on Price: The indicator is designed to be overlaid on your price chart, seamlessly integrating with your existing analysis.
Simple but Effective: By offering a clear visual guide to where price is trading relative to important higher timeframe levels, this indicator helps traders avoid trading against major trends.
Why It’s Unique:
Validation Timeframe Flexibility: Unlike traditional moving average indicators that only work within the same chart's timeframe, the MENTFX AVERAGES M indicator allows you to pull moving averages from higher timeframes (default: Daily) and overlay them on any chart you're currently viewing, whether it's intraday (minutes) or even weekly. This cross-timeframe visibility is critical in determining the true market trend, adding context to your trades.
Customizability: Although the default settings focus on daily EMAs (5, 10, and 20 periods), traders can modify the parameters, including the type of moving average (Simple, Weighted, etc.), making it adaptable for any strategy. Whether you want shorter-term or longer-term averages, this indicator covers your needs.
Trend Confirmation Tool: The use of multiple EMAs helps traders confirm trend direction and potential price breakouts or reversals. For example, when the shorter-term 5 EMA crosses above the 20 EMA, it can signal a potential bullish trend, while the opposite could indicate bearish pressure.
How This Indicator Helps:
Identify Key Support and Resistance Levels: Higher timeframe moving averages often act as dynamic support and resistance. This indicator helps you stay aware of those critical levels, even when trading lower timeframes.
Trend Identification: Knowing where the market is relative to the 5, 10, and 20 EMAs from a higher timeframe gives you a clearer picture of whether you're trading with or against the prevailing trend.
Improved Decision Making: By aligning your trades with the direction of higher timeframe trends, you can increase your confidence in trade entries and exits, avoiding low-probability setups.
Multi-Market Use: This indicator works well across various asset classes—stocks, forex, crypto, and commodities—making it versatile for any trader.
How to Use:
Intraday Trading: Use the daily EMAs as a guide to see if intraday price movements align with longer-term trends.
Swing Trading: Plot daily EMAs to track the strength of a larger trend, using pullbacks to the moving averages as potential entry points.
Trend Trading: Monitor crossovers between the moving averages to signal potential changes in trend direction.
Default Settings:
5 EMA (Daily) – Blue Line
10 EMA (Daily) – Black Line
20 EMA (Daily) – Red Line
These lines will plot on your chart with a subtle opacity (33%) to ensure they don’t obstruct price action, while still providing crucial visual guidance on market trends.
This indicator is perfect for traders who want to blend technical analysis with multi-timeframe insights, helping you stay in sync with broader market movements while executing trades on any timeframe.

Double BBW OverlayDouble BBW Overlay Indicator
Overview
The Double BBW (Bollinger Band Width) Overlay indicator is a custom script for TradingView that combines two BBW indicators with adjustable settings. It allows traders to compare the volatility of two different periods of Bollinger Bands on the same chart. By default, the first BBW is calculated with a 10-period center line, and the second BBW with a 20-period center line, but these values can be customized.
How It Works
Bollinger Bands consist of an upper band, a lower band, and a middle band (typically a moving average). The Bollinger Band Width (BBW) measures the distance between the upper and lower bands relative to the center line. The width of these bands indicates market volatility:
Narrow Bands: Low volatility, usually preceding a breakout.
Wide Bands: High volatility, often following a strong price movement.
This indicator plots two BBW values on a non-overlay chart, making it easy to visualize and compare different market conditions over different periods.
Indicator Components
BBW 1 (default period: 10)
Calculates the BBW using a center line based on a 10-period moving average.
The width is plotted in blue by default.
BBW 2 (default period: 20)
Calculates the BBW using a center line based on a 20-period moving average.
The width is plotted in red by default.
Zero Line
A gray horizontal line at the value of 0 for reference, helping to understand the scale of BBW values.
Input Parameters
Center Line Period for BBW 1 (length1)
Default: 10
This controls the length of the moving average for the first BBW calculation. It defines how many periods are used to calculate the middle Bollinger Band for BBW 1.
Center Line Period for BBW 2 (length2)
Default: 20
This controls the length of the moving average for the second BBW calculation. It defines how many periods are used to calculate the middle Bollinger Band for BBW 2.
Standard Deviation Multiplier (mult)
Default: 2.0
This controls how far the upper and lower Bollinger Bands are from the center line. The multiplier affects how sensitive the Bollinger Bands are to price changes, with higher values producing wider bands.
How to Use
Adding the Indicator: Once the script is added to your TradingView account, simply apply the indicator to any chart. It will be displayed as a separate pane below the price chart, showing two BBW lines corresponding to the two different periods.
Customizing Periods: Use the settings panel to adjust the center line periods for BBW 1 and BBW 2 to match your desired trading strategy. For instance, you can analyze short-term versus long-term volatility by adjusting the periods.
Volatility Analysis:
When both BBW lines are narrow, it indicates low volatility across both short-term and long-term periods, which could suggest that a breakout is imminent.
If both BBW lines widen simultaneously, it shows that volatility is increasing in both timeframes, possibly indicating a strong trend.
Use Cases
Breakout Strategy: When the BBW lines contract significantly, it may signal that a low-volatility period is about to end, which is often followed by a price breakout in either direction.
Trend Strength: Comparing short-term and long-term BBW values can help determine if recent price movements are supported by broader market volatility or if they are isolated to the short term.
Chart Display
BBW 1: Blue line, representing the Bollinger Band Width calculated with a center line period of 10 (or your customized value).
BBW 2: Red line, representing the Bollinger Band Width calculated with a center line period of 20 (or your customized value).
Zero Line: A gray line at 0 is provided for reference, although BBW values are always positive.
Advantages of Using Double BBW
Comprehensive View of Volatility: By overlaying two BBW indicators with different timeframes, you can gain insights into both short-term and long-term market volatility trends.
Customizable: You can easily adjust the moving average periods and the standard deviation multiplier to match your preferred trading strategy or the characteristics of the asset you are trading.
Easy Visualization: The separate plots of BBW values make it easier to see shifts in market volatility, allowing you to spot potential trading opportunities.
Dysmen signalsDysmen Signals Indicator
The "Dysmen Signals" indicator is designed to provide clear buy and sell signals based on the crossover of various Exponential Moving Averages (EMAs). This indicator employs a combination of short-term and long-term EMA crossovers to identify potential trading opportunities, while also highlighting significant market movements through specific signals such as the Golden Cross and Death Cross.
Indicator Components
1. Exponential Moving Averages (EMAs)
- EMA 14: A short-term EMA calculated over 14 periods.
- EMA 20: Another short-term EMA calculated over 20 periods.
- EMA 50: A mid-term EMA used as a trend filter.
- EMA 200: A long-term EMA representing the overall trend.
2. Buy and Sell Signals
- Buy Signal: This is triggered when the EMA 14 crosses above the EMA 20 and the closing price is above the EMA 50. This suggests a bullish trend in the market.
- Sell Signal: This is triggered when the EMA 14 crosses below the EMA 20 and the closing price is below the EMA 50. This indicates a bearish trend in the market.
3. Golden Cross and Death Cross
- Golden Cross (GC): Occurs when the EMA 50 crosses above the EMA 200. This is a strong bullish signal indicating a potential long-term upward trend.
- Death Cross (DC): Occurs when the EMA 50 crosses below the EMA 200. This is a strong bearish signal suggesting a potential long-term downward trend.
4. Signal Visualization
- Buy and Sell signals are marked on the chart with green and red triangles respectively. These signals help traders identify potential entry and exit points.
- Golden Cross and Death Cross signals are indicated with yellow and purple diamonds respectively, providing insight into major market trend shifts.
5. Candle Coloring
- Candles are colored green if a buy signal is active and red if a sell signal is active. This visual aid helps in quickly identifying the prevailing market sentiment.
6. EMA 200 Plotting
- The EMA 200 is plotted as a white, semi-thick line on the chart. This line serves as a reference for the overall long-term trend.
Detailed Code Explanation
- EMA Calculations: The script calculates the EMA for 14, 20, 50, and 200 periods using the ta.ema function.
- Crossover Conditions: It uses the ta.crossover and ta.crossunder functions to detect when the EMAs cross each other, triggering buy and sell signals.
- Plotting Signals: The plotshape function is utilized to display BUY and SELL signals as well as Golden Cross and Death Cross signals on the chart.
- Candle Coloring Logic: A variable direction is used to store the current market direction based on the latest signal, which then determines the candle colors using the barcolor function.
- EMA 200 Display: The plot function is used to draw the EMA 200 line on the chart with the specified color and thickness.
By employing this indicator, traders can gain valuable insights into potential market trends and make more informed trading decisions based on the crossover of key EMAs.

Ripster MTF CloudsDescription:
MTF EMA Cloud By Ripster
EMA Cloud System is a Trading System Invented by Ripster where areas are shaded between two desired EMAs. The concept implies the EMA cloud area serves as support or resistance for Intraday & Swing Trading. This can be utilized effectively on 10 Min for day trading and 1Hr/Daily for Swings. Ripster himself utilizes various combinations of the 5-12, 34-50, 8-9, 20-21 EMA clouds but the possibilities are endless to find what works best for you.
“Ideally, 5-12 or 5-13 EMA cloud acts as a fluid trendline for day trades. 8-9 EMA Clouds can be used as pullback Levels –(optional). Additionally, a high level price over or under 34-50 EMA clouds confirms either bullish or bearish bias on the price action for any timeframe” – Ripster
This indicator is an extension of the Ripster EMA Clouds. It allows you to visualize Exponential Moving Average (EMA) clouds from any time frame on your current chart, regardless of the chart's own time frame. This functionality is especially useful for traders who want to monitor higher time frame trends and support/resistance levels while trading on lower time frames.
What does this code do?
The Ripster MTF Clouds indicator displays two sets of EMA clouds. Each set consists of a short EMA and a long EMA. By default, the indicator uses Daily 20/21 and 50/55 EMAs, but you can customize these settings to fit your trading strategy. The EMAs are plotted on your chart along with their corresponding clouds, colored for easy differentiation:
EMA 1 (default 50/55): Plotted in blue.
EMA 2 (default 20/21): Plotted in teal.
The indicator uses the security function to fetch EMA values from higher time frames and plots them on your current chart, allowing you to see how these higher time frame EMAs interact with your current time frame's price action.
How to use this indicator:
Adjust Resolution:
Set the "Resolution" input to the time frame from which you want to fetch EMA values. For example, set it to "1H" if you want to see 1-hour EMAs on your current chart.
Customize EMAs:
Modify the "EMA 1 Short Length" and "EMA 1 Long Length" inputs to change the default 50/55 EMAs.
Adjust the "EMA 2 Short Length" and "EMA 2 Long Length" inputs to change the default 20/21 EMAs.
Monitor Clouds:
The indicator fills the area between the short and long EMAs, creating a cloud that helps visualize the trend. A blue cloud indicates the area between the EMA 1 pair, while a teal cloud indicates the area between the EMA 2 pair.
Use Multiple Instances:
You can add multiple instances of this indicator to your chart to monitor multiple higher time frames simultaneously. For instance, one instance can show daily clouds while another shows hourly clouds.
Integration with Trading Strategy:
Use this indicator to identify higher time frame trends and support/resistance levels, which can help improve your trading decisions on lower time frames.
For example, you can go long when the stock is above the 50-55 EMA clouds and 20-21 EMA clouds with daily resolution on a 10-minute chart and short when it is below it.
Similarly, you can short a stock under the 1-hour 34/50 EMA clouds while still trading on a 10-minute chart.
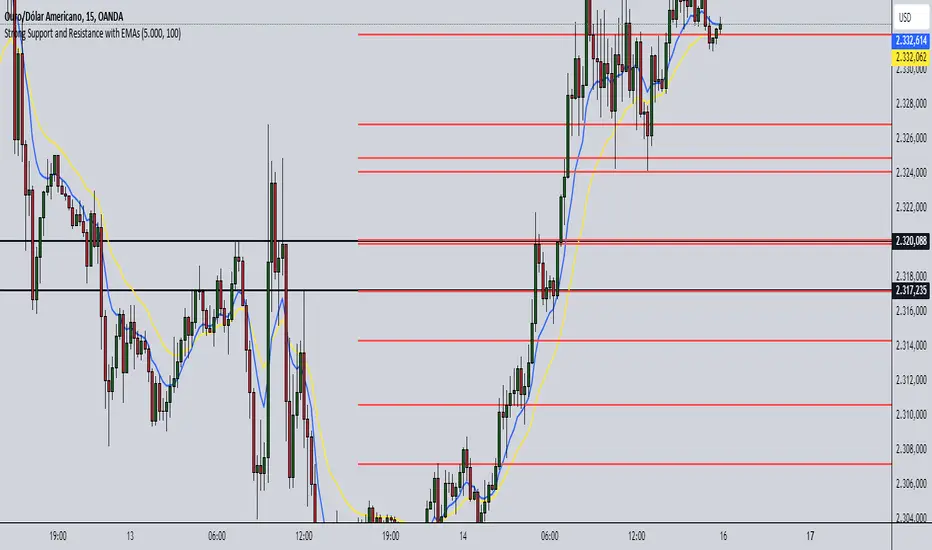
Strong Support and Resistance with EMAs @viniciushadek
### Strategy for Using Continuity Points with 20 and 9 Period Exponential Moving Averages, and Support and Resistance
This strategy involves using two exponential moving averages (EMA) - one with a 20-period and another with a 9-period - along with identifying support and resistance levels on the chart. Combining these tools can help determine trend continuation points and potential entry and exit points in market operations.
### 1. Setting Up the Exponential Moving Averages
- **20-Period EMA**: This moving average provides a medium-term trend view. It helps smooth out price fluctuations and identify the overall market direction.
- **9-Period EMA**: This moving average is more sensitive and reacts more quickly to price changes, providing short-term signals.
### 2. Identifying Support and Resistance
- **Support**: Price levels where demand is strong enough to prevent the price from falling further. These levels are identified based on previous lows.
- **Resistance**: Price levels where supply is strong enough to prevent the price from rising further. These levels are identified based on previous highs.
### 3. Continuity Points
The strategy focuses on identifying trend continuation points using the interaction between the EMAs and the support and resistance levels.
### 4. Buy Signals
- When the 9-period EMA crosses above the 20-period EMA.
- Confirm the entry if the price is near a support level or breaking through a resistance level.
### 5. Sell Signals
- When the 9-period EMA crosses below the 20-period EMA.
- Confirm the exit if the price is near a resistance level or breaking through a support level.
### 6. Risk Management
- Use appropriate stops below identified supports for buy operations.
- Use appropriate stops above identified resistances for sell operations.
### 7. Validating the Trend
- Check if the trend is validated by other technical indicators, such as the Relative Strength Index (RSI) or Volume.
### Conclusion
This strategy uses the combination of exponential moving averages and support and resistance levels to identify continuity points in the market trend. It is crucial to confirm the signals with other technical analysis tools and maintain proper risk management to maximize results and minimize losses.
Implementing this approach can provide a clearer view of market movements and help make more informed trading decisions.
BBTrend w SuperTrend decision - Strategy [presentTrading]This strategy aims to improve upon the performance of Traidngview's newly published "BB Trend" indicator by incorporating the SuperTrend for better trade execution and risk management. Enjoy :)
█Introduction and How it is Different
The "BBTrend w SuperTrend decision - Strategy " is a trading strategy designed to identify market trends using Bollinger Bands and SuperTrend indicators. What sets this strategy apart is its use of two Bollinger Bands with different lengths to capture both short-term and long-term market trends, providing a more comprehensive view of market dynamics. Additionally, the strategy includes customizable take profit (TP) and stop loss (SL) settings, allowing traders to tailor their risk management according to their preferences.
BTCUSD 4h Long Performance
█ Strategy, How It Works: Detailed Explanation
The BBTrend strategy employs two key indicators: Bollinger Bands and SuperTrend.
🔶 Bollinger Bands Calculation:
- Short Bollinger Bands**: Calculated using a shorter period (default 20).
- Long Bollinger Bands**: Calculated using a longer period (default 50).
- Bollinger Bands use the standard deviation of price data to create upper and lower bands around a moving average.
Upper Band = Middle Band + (k * Standard Deviation)
Lower Band = Middle Band - (k * Standard Deviation)
🔶 BBTrend Indicator:
- The BBTrend indicator is derived from the absolute differences between the short and long Bollinger Bands' lower and upper values.
BBTrend = (|Short Lower - Long Lower| - |Short Upper - Long Upper|) / Short Middle * 100
🔶 SuperTrend Indicator:
- The SuperTrend indicator is calculated using the average true range (ATR) and a multiplier. It helps identify the market trend direction by plotting levels above and below the price, which act as dynamic support and resistance levels. * @EliCobra makes the SuperTrend Toolkit. He is GOAT.
SuperTrend Upper = HL2 + (Factor * ATR)
SuperTrend Lower = HL2 - (Factor * ATR)
The strategy determines market trends by checking if the close price is above or below the SuperTrend values:
- Uptrend: Close price is above the SuperTrend lower band.
- Downtrend: Close price is below the SuperTrend upper band.
Short: 10 Long: 20 std 2
Short: 20 Long: 40 std 2
Short: 20 Long: 40 std 4
█ Trade Direction
The strategy allows traders to choose their trading direction:
- Long: Enter long positions only.
- Short: Enter short positions only.
- Both: Enter both long and short positions based on market conditions.
█ Usage
To use the "BBTrend - Strategy " effectively:
1. Configure Inputs: Adjust the Bollinger Bands lengths, standard deviation multiplier, and SuperTrend settings.
2. Set TPSL Conditions: Choose the take profit and stop loss percentages to manage risk.
3. Choose Trade Direction: Decide whether to trade long, short, or both directions.
4. Apply Strategy: Apply the strategy to your chart and monitor the signals for potential trades.
█ Default Settings
The default settings are designed to provide a balance between sensitivity and stability:
- Short BB Length (20): Captures short-term market trends.
- Long BB Length (50): Captures long-term market trends.
- StdDev (2.0): Determines the width of the Bollinger Bands.
- SuperTrend Length (10): Period for calculating the ATR.
- SuperTrend Factor (12): Multiplier for the ATR to adjust the SuperTrend sensitivity.
- Take Profit (30%): Sets the level at which profits are taken.
- Stop Loss (20%): Sets the level at which losses are cut to manage risk.
Effect on Performance
- Short BB Length: A shorter length makes the strategy more responsive to recent price changes but can generate more false signals.
- Long BB Length: A longer length provides smoother trend signals but may be slower to react to price changes.
- StdDev: Higher values create wider bands, reducing the frequency of signals but increasing their reliability.
- SuperTrend Length and Factor: Shorter lengths and higher factors make the SuperTrend more sensitive, providing quicker signals but potentially more noise.
- Take Profit and Stop Loss: Adjusting these levels affects the risk-reward ratio. Higher take profit percentages can increase gains but may result in fewer closed trades, while higher stop loss percentages can decrease the likelihood of being stopped out but increase potential losses.

Moving Average Dispersion Index w/ Z-Score (Adjusted MADI-Z)Overview
The Adjusted MADI-Z indicator is a custom indicator that looks to decipher trends and consolidations based on the clustering and dispersion of Moving Averages. It calculates a z-score based on the dispersion of various exponentially weighted moving averages to identify trends and consolidation. The z-score is then adjusted using a logistic function to map it between 0-100.
How can it be used?
- Identify trends and consolidation - Values above 80 indicate a strong trend while values below 20 show consolidation
- Gauge trend strength - Higher positive values suggest a stronger uptrend while lower negative values indicate a stronger downtrend
- Generate trading signals - Crossovers of key levels can act as entry/exit triggers
- Smooth noise in price action - The adjusted z-score filters out market noise
Default Values
- ma5_len = 5
- ma10_len = 10
- ma50_len = 50
- ma200_len = 200
- lookback_period = 100
Strategies
The Adjusted MADI-Z can be used for trend-following strategies across various timeframes. Specific strategies include:
- Trend trading - Enter long on crossover above 80, exit on crossover below 80. Reverse for short trades.
- Range trading - Enter short on crossover below 20, exit on crossover above 20. Reverse for long trades.
- Identifying pullbacks - Temporary moves below 80 during uptrends and above 20 during downtrends can act as retracement entry points.
Rationale
By adjusting the z-score output of the standard MADI using a logistic function, the indicator becomes bounded and easier to interpret for trading purposes. The customized moving average lengths also allow tuning the indicator to particular assets and timeframes.
Interpretation
- Above 80 - Strong uptrend
- 70 to 80 - Moderate uptrend
- 50 to 70 - Weak uptrend
- 30 to 50 - Range-bound consolidation
- 20 to 30 - Weak downtrend
- Below 20 - Strong downtrend
Values below 15 or above 85 represent extremes outside two standard deviations.

Bubble Risk IndicatorThe Bubble Risk Indicator is a sophisticated tool designed to assess the potential risk level of a trading instrument by measuring its deviation from a 20-week Simple Moving Average (SMA). This dynamic indicator visually represents the deviation with a color-changing line, indicating the degree of risk based on the distance from the SMA.
🔷 Calculation
The indicator calculates the deviation from the 20-week SMA and expresses it as a percentage extension:
20-Week SMA : Averages the closing prices over the past 20 periods, providing a consistent measure of the long-term trend.
Deviation Percentage : Measures the percentage difference between the current closing price and the 20-week SMA.
🔷 Color Coding
The line changes color based on the deviation level to represent different risk levels. Users can customize these colors as per their preferences. However, the following are the default recommended settings:
Extreme Low Risk (Below 0) : Blue
Low Risk (Below 0) : Light Blue
Low Risk (Above 0) : Light Purple
Medium Risk : Orange
High Risk : Red
Colors transition smoothly to reflect the increasing or decreasing risk based on the deviation from the SMA.
🔷 Customization
Users have the flexibility to change the colors representing each risk level through the indicator settings. While the default colors are recommended for a standard view, users comfortable with custom color schemes can adjust according to their preference.
🔷 Usage
This indicator is beneficial for gauging the relative risk associated with current price movements compared to a historical average. It's most effective when used in conjunction with other technical analysis tools and market knowledge.
🔷 Limitations
While the Bubble Risk Indicator provides valuable insights, it should form part of a broader trading strategy. It assesses risk levels based on historical data and does not predict future market directions.
🔷 Conclusion
The Bubble Risk Indicator offers a nuanced and visually intuitive way to understand market risk levels, providing traders with an additional tool for informed decision-making.
🔷 Risk Disclaimer
Trading involves significant risk and is not suitable for every investor. The value of investments can fluctuate. Past performance is not indicative of future results. Always consider your circumstances and seek independent advice before making financial decisions. This indicator is provided for informational purposes only and is not intended as financial advice.
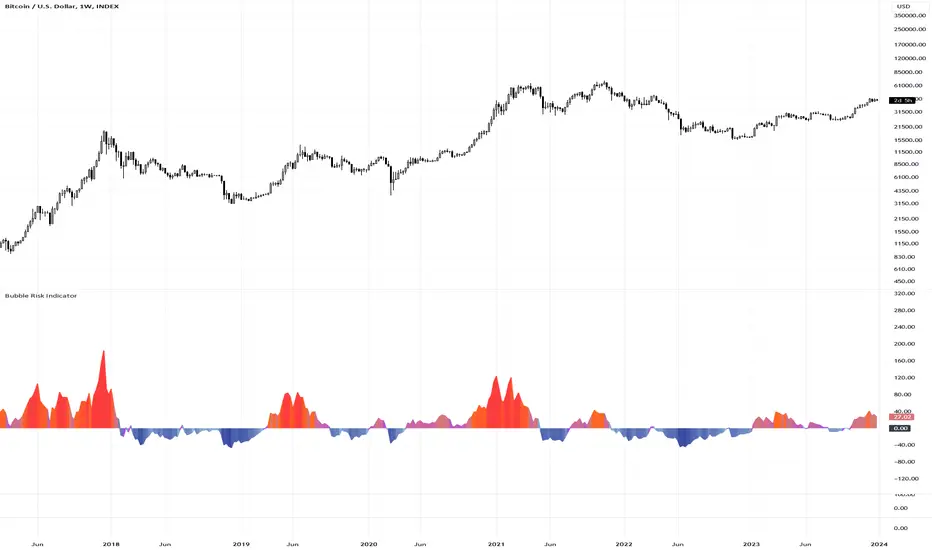
RSI & Backed-Weighted MA StrategyRSI & MA Strategy :
INTRODUCTION :
This strategy is based on two well-known indicators that work best together: the Relative Strength Index (RSI) and the Moving Average (MA). We're going to use the RSI as a trend-follower indicator, rather than a reversal indicator as most are used to. To the signals sent by the RSI, we'll add a condition on the chart's MA, filtering out irrelevant signals and considerably increasing our winning rate. This is a medium/long-term strategy. There's also a money management method enabling us to reinvest part of the profits or reduce the size of orders in the event of substantial losses.
RSI :
The RSI is one of the best-known and most widely used indicators in trading. Its purpose is to warn traders when an asset is overbought or oversold. It was designed to send reversal signals, but we're going to use it as a trend indicator by increasing its length to 20. The RSI formula is as follows :
RSI (n) = 100 - (100 / (1 + (H (n)/L (n))))
With n the length of the RSI, H(n) the average of days closing above the open and L(n) the average of days closing below the open.
MA :
The Moving Average is also widely used in technical analysis, to smooth out variations in an asset. The SMA formula is as follows :
SMA (n) = (P1 + P2 + ... + Pn) / n
where n is the length of the MA.
However, an SMA does not weight any of its terms, which means that the price 10 days ago has the same importance as the price 2 days ago or today's price... That's why in this strategy we use a RWMA, i.e. a back-weighted moving average. It weights old prices more heavily than new ones. This will enable us to limit the impact of short-term variations and focus on the trend that was dominating. The RWMA used weights :
The 4 most recent terms by : 100 / (4+(n-4)*1.30)
The other oldest terms by : weight_4_first_term*1.30
So the older terms are weighted 1.30 more than the more recent ones. The moving average thus traces a trend that accentuates past values and limits the noise of short-term variations.
PARAMETERS :
RSI Length : Lenght of RSI. Default is 20.
MA Type : Choice between a SMA or a RWMA which permits to minimize the impact of short term reversal. Default is RWMA.
MA Length : Length of the selected MA. Default is 19.
RSI Long Signal : Minimum value of RSI to send a LONG signal. Default is 60.
RSI Short signal : Maximum value of RSI to send a SHORT signal. Default is 40.
ROC MA Long Signal : Maximum value of Rate of Change MA to send a LONG signal. Default is 0.
ROC MA Short signal : Minimum value of Rate of Change MA to send a SHORT signal. Default is 0.
TP activation in multiple of ATR : Threshold value to trigger trailing stop Take Profit. This threshold is calculated as multiple of the ATR (Average True Range). Default value is 5 meaning that to trigger the trailing TP the price need to move 5*ATR in the right direction.
Trailing TP in percentage : Percentage value of trailing Take Profit. This Trailing TP follows the profit if it increases, remaining selected percentage below it, but stops if the profit decreases. Default is 3%.
Fixed Ratio : This is the amount of gain or loss at which the order quantity is changed. Default is 400, which means that for each $400 gain or loss, the order size is increased or decreased by a user-selected amount.
Increasing Order Amount : This is the amount to be added to or subtracted from orders when the fixed ratio is reached. The default is $200, which means that for every $400 gain, $200 is reinvested in the strategy. On the other hand, for every $400 loss, the order size is reduced by $200.
Initial capital : $1000
Fees : Interactive Broker fees apply to this strategy. They are set at 0.18% of the trade value.
Slippage : 3 ticks or $0.03 per trade. Corresponds to the latency time between the moment the signal is received and the moment the order is executed by the broker.
Important : A bot has been used to test the different parameters and determine which ones maximize return while limiting drawdown. This strategy is the most optimal on BITSTAMP:ETHUSD with a timeframe set to 6h. Parameters are set as follows :
MA type: RWMA
MA Length: 19
RSI Long Signal: >60
RSI Short Signal : <40
ROC MA Long Signal : <0
ROC MA Short Signal : >0
TP Activation in multiple ATR : 5
Trailing TP in percentage : 3
ENTER RULES :
The principle is very simple:
If the asset is overbought after a bear market, we are LONG.
If the asset is oversold after a bull market, we are SHORT.
We have defined a bear market as follows : Rate of Change (20) RWMA < 0
We have defined a bull market as follows : Rate of Change (20) RWMA > 0
The Rate of Change is calculated using this formula : (RWMA/RWMA(20) - 1)*100
Overbought is defined as follows : RSI > 60
Oversold is defined as follows : RSI < 40
LONG CONDITION :
RSI > 60 and (RWMA/RWMA(20) - 1)*100 < -1
SHORT CONDITION :
RSI < 40 and (RWMA/RWMA(20) - 1)*100 > 1
EXIT RULES FOR WINNING TRADE :
We have a trailing TP allowing us to exit once the price has reached the "TP Activation in multiple ATR" parameter, i.e. 5*ATR by default in the profit direction. TP trailing is triggered at this point, not limiting our gains, and securing our profits at 3% below this trigger threshold.
Remember that the True Range is : maximum(H-L, H-C(1), C-L(1))
with C : Close, H : High, L : Low
The Average True Range is therefore the average of these TRs over a length defined by default in the strategy, i.e. 20.
RISK MANAGEMENT :
This strategy may incur losses. The method for limiting losses is to set a Stop Loss equal to 3*ATR. This means that if the price moves against our position and reaches three times the ATR, we exit with a loss.
Sometimes the ATR can result in a SL set below 10% of the trade value, which is not acceptable. In this case, we set the SL at 10%, limiting losses to a maximum of 10%.
MONEY MANAGEMENT :
The fixed ratio method was used to manage our gains and losses. For each gain of an amount equal to the value of the fixed ratio, we increase the order size by a value defined by the user in the "Increasing order amount" parameter. Similarly, each time we lose an amount equal to the value of the fixed ratio, we decrease the order size by the same user-defined value. This strategy increases both performance and drawdown.
Enjoy the strategy and don't forget to take the trade :)

5EMA BollingerBand Nifty Stock Scanner
What ?
We all heard about (well: over-heard) 5-EMA strategy. Which falls into the broader category of mean reversal type of trading setup.
What is mean reversal?
Price (or any time series, in fact) tries to follow a mean . Whenever price diverges from the mean it tries to meet it back.
It is empirically observed by some traders (I honestly don't know who first time observed it) that in Indian context specially, 5 Exponential Moving Average (5-EMA) works pretty good as that mean.
So whenever price moves away from that 5-EMA, it ultimately comes back and attain total nirvana :) Means: if price moved way higher than the 5EMA without touching it, then price will correct to meet it's 5-EMA and if price moved way lower, it will be uplifted to meet it's 5-EMA. Funny - but it works !
Now there are already enough social media coverage on this 5-EMA strategy/setup. Even TradingView has some excellent work done on these setups. Kudos to all those great souls.
So when we came to know about this, we were thinking what we should do for the community. Because it is well cover topic (specially in Indian context). Also, there are public indicators.
Then we thought why not come up with a scanner which will scan all the Nifty-50 constituent stocks and find out on the fly, real-time which all stocks are matching this 5-EMA setup and causing a Buy/Sell trade recommendation.
Hence here we are with the first version of our first scanner on the 5EMA setup (well it has some more masala than merely a 5-EMA setup).
Why?
Parts of why is already covered up.
Now instead of blindly following 5-EMA setup, we added the Bollinger band as well. Again: it's also not new. There are enough coverage in social media about the 5-EMA+BB strategy/setup. We mercilessly borrowed from all of these.
Suppose you have an indicator.
Now you apply the indicator in your chart. And then you need to (rock) and roll through your watchlist of Nifty-50 stocks (note: TradingView has no default watchlist of Nifty-50 stock by default - you have to create one custom watchlist to list all manually) to find out which all are matching the setup, need to take a note about the trade recomendations (entry, SL, target) and other stuffs like VWAP, Volume, volatility (Bollinger Band Width).
Not any more.
This scanner will track all the Nifty-50 stocks (technically: 40 stocks other than Banking stocks) and provide which one to Buy or Sell (if any), what's the entry, SL, target, where is the VWAP of the day, what's the picture in volume (high, low, rising, falling) and the implied volatility (using Bolling band width). Also it has a naive alerting mechanism as well.
In fact the code is there to monitor the (Future) OI also and all the OI drama (OI vs price and all the 4 stuffs like long build up, long unwinding, short covering, short buildup). But unfortunately, due to some limitations of the TradingView (that one can not monitor more than 40 `ta.security` call) we have to comment out the code. If you wish you can monitor only 20 stocks and enable the OI monitoring also (20 for stocks + 20 for their OI monitoring .. total 40 `ta.security` call).
How?
To know the divergence from 5-EMA we just check if the high of the candle (on closing) is below the 5-EMA. Then we check if the closing is inside the Bollinger Band (BB). That's a Buy signal. SL: low of the candle, T: middle and higher BB.
Just opposite for selling. 5-EMA low should be above 5-EMA and closing should be inside BB (lesser than BB higher level). That's a Sell signal. SL: high of the candle, T: middle and lower BB.
Along with we compare the current bar's volume with the last-20 bar VWMA (volume weighted moving average) to determine if the volume is high or low.
Present bar's volume is compared with the previous bar's volume to know if it's rising or falling.
VWAP is also determined using `ta.vwap` built-in support of TradingView.
The Bolling Band width is also notified, along with whether it is rising or falling (comparing with previous candle).
Simple, but effective.
Customization
As usual the EMA setup (5 default), the BB setup (20 SMA with 1.5 standard deviation), we provided option wherther to include or exclude BB role in the 5-EMA setup (as we found out there are two schools of thought .. some people use BB some don't. Lets make all happy :))
We also provide options to choose other symbols using Settings if they wish so. We have the default 40 non banking Nifty stocks (why non-banking? - Bank Nifty is in ATH :) .. enough :)). But if user wishes can monitor others too (provided the symbol is there in TradingView).
Although we strongly recommend the timeframe as 30 minutes , you can choose what's fit you most.
The output of the scanner is a table. By default the table is placed in the right-bottom (as we are most comfortable with that). However you can change per your wish. We have the option to choose that.
What is unique in it ?
This is more of an indicator. This is a scanner (of Nifty-50 stocks). So you can apply (our recommendation is in 30m timeframe) it to any chart (does not matter which chart it is) and it will show every 30 mins (which is also configurable) which all stocks (along with trade levels) to Buy and Sell according to the setup.
It will ease your trading activity.
You can concentrate only on the execution, the filtering you can leave it to this one.
Limitations
There is a build in limitation of the TradingView platform is that one can call only upto 40 securities API. Not beyond that. So naturally we are constraint by that. Otherwise we could monitor 190 Nifty F&O stocks itself.
30m is the recommended timeframe. In very lower (say 5m) this script tends to go out of heap (out of memory). Please note that also.
How to trade using this?
Put any chart in 30m (recommended) timeframe.
Apply this screener from Indicators (shortcut to launch indicators is just type / in your keyboard).
This will provide the Buy (shown in green color) or Sell (shown in red color) recommendations in a table, at every 30m candle closing.
Note the volume and BB width as well.
Wait for at least 2 5-minutes candles to close above/below the recommended level .
Take the trade with the SL and target mentioned.
Mentions
@QuantNomad. The whole implementation concept we mercilessly borrowed from him, even some of his code snippet we took it (after asking him through one of his videos comment section and seeking explicit permission which he readily granted within an hour). Thank You sir @QuantNomad. Indebted to you.
Monika (Rawat) ji: for reviewing, correcting, providing real time examples during live market hours, often compromising her own trading activities, about the effectiveness and usefulness of this setup. Thank You madam ji. Indebted to you.
There are innumerable contents in social media about this. Don't even know whom all we checked. Thanks to all of them.
Happy Trading (in stocks - isn't enough of Indices already?)
Disclaimer
This piece of software does not come up with any warrantee or any rights of not changing it over the future course of time.
We are not responsible for any trading/investment decision you are taking out of the outcome of this indicator.

Hull Suite Oscillator - Normalized | IkkeOmarThis script is based off the Hull Suite by @InSilico.
I made this script to provide and calculate the Hull Moving Average (HMA) based on the chosen variation (HMA, TMA, or EMA) and length to then normalize the HMA values to a range of 0 to 100. The normalized values are further smoothed using an exponential moving average (EMA).
The smoothed oscillator is plotted as a line, where values above 80 are colored red, values below 20 are colored green, and values between 20 and 80 are colored blue. Additionally, there are horizontal dashed lines at the levels of 20 and 80 to serve as reference points.
Explanation for the code:
The script uses the close price of the asset as the source for calculations. The modeSwitch parameter allows selecting the type of Hull variation: Hma, Thma, or Ehma. The length parameter determines the calculation period for the Hull moving averages. The lengthMult parameter is used to adjust the length for higher timeframes. The oscSmooth parameter determines the lookback period for smoothing the oscillator.
There are three functions defined for calculating different types of Hull moving averages: HMA, EHMA, and THMA. These functions take the source and length as inputs and return the corresponding Hull moving average.
The Mode function acts as a switch and selects the appropriate Hull variation based on the modeSwitch parameter. It returns the chosen Hull moving average.
The script calculates the Hull moving averages using the selected mode, source, and length. The main Hull moving average is stored in the _hull variable, and aliases are created for the main Hull moving average (HULL), the main Hull value (MHULL), and the secondary Hull value (SHULL).
To create the normalized oscillator values, the script finds the highest and lowest values of the Hull moving average within the specified length. It then normalizes the Hull values to a range of 0 to 100 using a formula. This normalized oscillator represents the strength of the trend.
To smooth out the oscillator values, an exponential moving average is applied using the oscSmooth parameter.
The smoothed oscillator is plotted as a line chart. The line color is determined based on the oscillator value using conditional statements. If the oscillator value is above or equal to 80, the line color is set to red. If it is below or equal to 20, the color is green. Otherwise, it is blue. The linewidth is set to 2.
Additionally, two horizontal reference lines are plotted at levels 20 and 80 for visual reference. They are displayed in gray and dashed style.
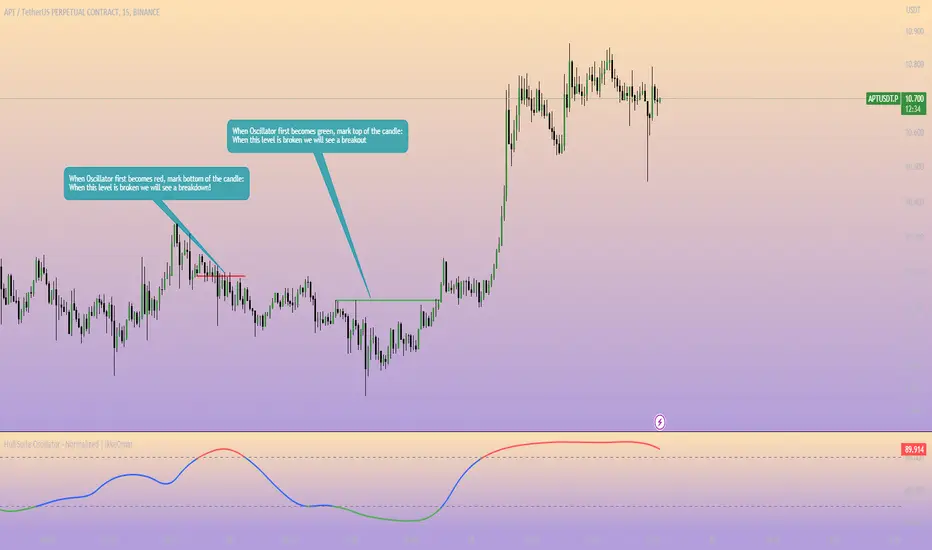
Anchored SMAThis is not your usual single moving average (SMA) indicator. It is an anchored SMA indicator. The anchored SMA does what other SMAs cannot--it stays at an anchored timeframe and presents that SMA relative to the timeframe you are in. For example, standard SMA indicators adjust to the timeframe you are viewing in your chart. So if you set it to a 20 day SMA while in the 1 Day timeframe, when you switch to the 5 minute timeframe, your 20 day SMA now becomes a 100 minute SMA indicator--that is it is only calculating the SMA for 20 ticks at 5 minutes each rather than holding the 20 day indicator at the higher timeframe. However, with the anchored SMA, the indicator would have held at the 20 day SMA while you were in the 5 minute timeframe.
The default setting is for the anchored SMA is the five day SMA. This can be adjusted in the settings to be any amount of ticks in any timeframe you choose from 1 minute to 1 week. The indicator does not hold accurately at timeframes outside of this range. The accompanying chart is the SPX in the 15 minute timeframe with the default anchored SMA settings in blue and the standard 200 tick SMA in black. Now, you could manually adjust the ticks to 130 SMA to fit the same blue line, but why do so when the anchored SMA does it for you?
This brings us to a very important note--this indicator is set to standard market hours at 6.5 hours per day. This means this indicator would not give the same results in markets with different hours, such as futures, FOREX, or Crypto markets. This only holds for equity markets. However, that is not to say it cannot be used in these other markets, it's that it wouldn't be the same result. Anyway, enjoy!