Bullish ABCD Harmonic Patterns [theEccentricTrader]█ OVERVIEW
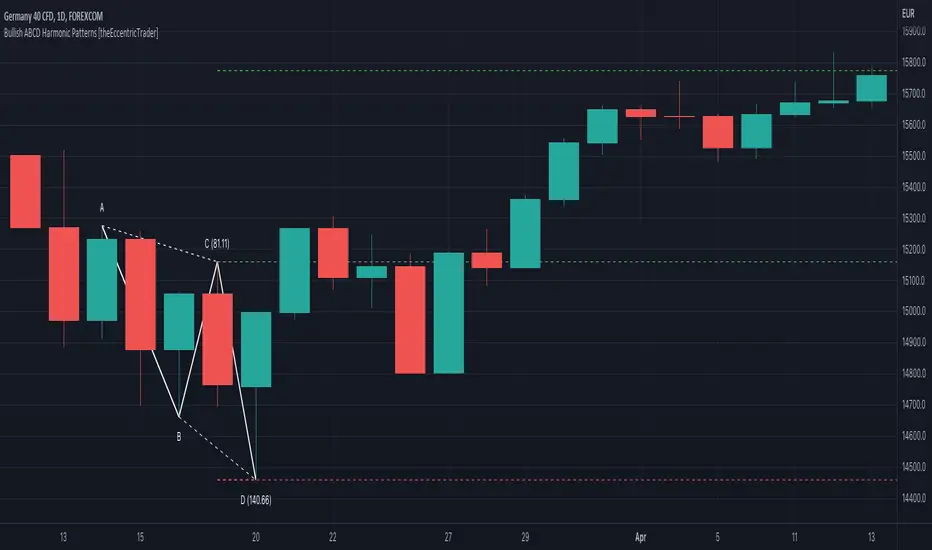
This indicator automatically draws bullish ABCD harmonic patterns and price projections derived from the ranges that constitute the patterns.
█ CONCEPTS
Green and Red Candles
• A green candle is one that closes with a close price equal to or above the price it opened.
• A red candle is one that closes with a close price that is lower than the price it opened.
Swing Highs and Swing Lows
• A swing high is a green candle or series of consecutive green candles followed by a single red candle to complete the swing and form the peak.
• A swing low is a red candle or series of consecutive red candles followed by a single green candle to complete the swing and form the trough.
Peak and Trough Prices (Basic)
• The peak price of a complete swing high is the high price of either the red candle that completes the swing high or the high price of the preceding green candle, depending on which is higher.
• The trough price of a complete swing low is the low price of either the green candle that completes the swing low or the low price of the preceding red candle, depending on which is lower.
Historic Peaks and Troughs
The current, or most recent, peak and trough occurrences are referred to as occurrence zero. Previous peak and trough occurrences are referred to as historic and ordered numerically from right to left, with the most recent historic peak and trough occurrences being occurrence one.
Range
The range is simply the difference between the current peak and current trough prices, generally expressed in terms of points or pips.
Support and Resistance
• Support refers to a price level where the demand for an asset is strong enough to prevent the price from falling further.
• Resistance refers to a price level where the supply of an asset is strong enough to prevent the price from rising further.
Support and resistance levels are important because they can help traders identify where the price of an asset might pause or reverse its direction, offering potential entry and exit points. For example, a trader might look to buy an asset when it approaches a support level , with the expectation that the price will bounce back up. Alternatively, a trader might look to sell an asset when it approaches a resistance level , with the expectation that the price will drop back down.
It's important to note that support and resistance levels are not always relevant, and the price of an asset can also break through these levels and continue moving in the same direction.
Upper Trends
• A return line uptrend is formed when the current peak price is higher than the preceding peak price.
• A downtrend is formed when the current peak price is lower than the preceding peak price.
• A double-top is formed when the current peak price is equal to the preceding peak price.
Lower Trends
• An uptrend is formed when the current trough price is higher than the preceding trough price.
• A return line downtrend is formed when the current trough price is lower than the preceding trough price.
• A double-bottom is formed when the current trough price is equal to the preceding trough price.
Muti-Part Upper and Lower Trends
• A multi-part return line uptrend begins with the formation of a new return line uptrend, or higher peak, and continues until a new downtrend, or lower peak, completes the trend.
• A multi-part downtrend begins with the formation of a new downtrend, or lower peak, and continues until a new return line uptrend, or higher peak, completes the trend.
• A multi-part uptrend begins with the formation of a new uptrend, or higher trough, and continues until a new return line downtrend, or lower trough, completes the trend.
• A multi-part return line downtrend begins with the formation of a new return line downtrend, or lower trough, and continues until a new uptrend, or higher trough, completes the trend.
Double Trends
• A double uptrend is formed when the current trough price is higher than the preceding trough price and the current peak price is higher than the preceding peak price.
• A double downtrend is formed when the current peak price is lower than the preceding peak price and the current trough price is lower than the preceding trough price.
Muti-Part Double Trends
• A multi-part double uptrend begins with the formation of a new uptrend that proceeds a new return line uptrend, and continues until a new downtrend or return line downtrend ends the trend.
• A multi-part double downtrend begins with the formation of a new downtrend that proceeds a new return line downtrend, and continues until a new uptrend or return line uptrend ends the trend.
Wave Cycles
A wave cycle is here defined as a complete two-part move between a swing high and a swing low, or a swing low and a swing high. The first swing high or swing low will set the course for the sequence of wave cycles that follow; for example a chart that begins with a swing low will form its first complete wave cycle upon the formation of the first complete swing high and vice versa.
Figure 1.
Fibonacci Retracement and Extension Ratios
The Fibonacci sequence is a series of numbers in which each number is the sum of the two preceding numbers, starting with 0 and 1. For example 0 + 1 = 1, 1 + 1 = 2, 1 + 2 = 3, and so on. Ultimately, we could go on forever but the first few numbers in the sequence are as follows: 0 , 1, 1, 2, 3, 5, 8, 13, 21, 34, 55, 89, 144.
The extension ratios are calculated by dividing each number in the sequence by the number preceding it. For example 0/1 = 0, 1/1 = 1, 2/1 = 2, 3/2 = 1.5, 5/3 = 1.6666..., 8/5 = 1.6, 13/8 = 1.625, 21/13 = 1.6153..., 34/21 = 1.6190..., 55/34 = 1.6176..., 89/55 = 1.6181..., 144/89 = 1.6179..., and so on. The retracement ratios are calculated by inverting this process and dividing each number in the sequence by the number proceeding it. For example 0/1 = 0, 1/1 = 1, 1/2 = 0.5, 2/3 = 0.666..., 3/5 = 0.6, 5/8 = 0.625, 8/13 = 0.6153..., 13/21 = 0.6190..., 21/34 = 0.6176..., 34/55 = 0.6181..., 55/89 = 0.6179..., 89/144 = 0.6180..., and so on.
1.618 is considered to be the 'golden ratio', found in many natural phenomena such as the growth of seashells and the branching of trees. Some now speculate the universe oscillates at a frequency of 0,618 Hz, which could help to explain such phenomena, but this theory has yet to be proven.
Traders and analysts use Fibonacci retracement and extension indicators, consisting of horizontal lines representing different Fibonacci ratios, for identifying potential levels of support and resistance. Fibonacci ranges are typically drawn from left to right, with retracement levels representing ratios inside of the current range and extension levels representing ratios extended outside of the current range. If the current wave cycle ends on a swing low, the Fibonacci range is drawn from peak to trough. If the current wave cycle ends on a swing high the Fibonacci range is drawn from trough to peak.
Harmonic Patterns
The concept of harmonic patterns in trading was first introduced by H.M. Gartley in his book "Profits in the Stock Market", published in 1935. Gartley observed that markets have a tendency to move in repetitive patterns, and he identified several specific patterns that he believed could be used to predict future price movements.
Since then, many other traders and analysts have built upon Gartley's work and developed their own variations of harmonic patterns. One such contributor is Larry Pesavento, who developed his own methods for measuring harmonic patterns using Fibonacci ratios. Pesavento has written several books on the subject of harmonic patterns and Fibonacci ratios in trading. Another notable contributor to harmonic patterns is Scott Carney, who developed his own approach to harmonic trading in the late 1990s and also popularised the use of Fibonacci ratios to measure harmonic patterns. Carney expanded on Gartley's work and also introduced several new harmonic patterns, such as the Shark pattern and the 5-0 pattern.
The bullish and bearish Gartley patterns are the oldest recognized harmonic patterns in trading and all the other harmonic patterns are ultimately modifications of the original Gartley patterns. Gartley patterns are fundamentally composed of 5 points, or 4 waves.
Bullish and Bearish ABCD Patterns
• Bullish ABCD patterns are fundamentally composed of two peaks and two troughs, with the second peak being lower than the first peak and the second trough being lower than the first trough. Which is the same as a double downtrend.
• Bearish ABCD patterns are fundamentally composed of two troughs and two peaks, with the second trough being higher than the first trough and the second peak being higher than the first peak. Which is the same as a double uptrend.
The most commonly recognised ratio measurements used by traders today are as follows:
• Wave 1 of the pattern, generally referred to as AB, has no specific ratio requirements.
• Wave 2 of the pattern, generally referred to as BC, should retrace by at least 61.8%, but no further than 78.6% of the range set by wave 1.
• Wave 3 of the pattern, generally referred to as CD, should extend to at least 127.2%, but no further than 161.8% of the range set by wave 2.
Measurement Tolerances
In general, tolerance in measurements refers to the allowable variation or deviation from a specific value or dimension. It is the range within which a particular measurement is considered to be acceptable or accurate. In this script I have applied this concept to the measurement of harmonic pattern ratios to increase to the frequency of pattern occurrences.
For example, the AB measurement of Gartley patterns is generally set at around 61.8%, but with such specificity in the measuring requirements the patterns are very rare. We can increase the frequency of pattern occurrences by setting a tolerance. A tolerance of 10% to both downside and upside, which is the default setting for all tolerances, means we would have a tolerable measurement range between 51.8-71.8%, thus increasing the frequency of occurrence.
█ FEATURES
Inputs
• BC Lower Tolerance
• BC Upper Tolerance
• CD Lower Tolerance
• CD Upper Tolerance
• Pattern Color
• Label Color
• Show Projections
• Extend Current Projection Lines
█ LIMITATIONS
All green and red candle calculations are based on differences between open and close prices, as such I have made no attempt to account for green candles that gap lower and close below the close price of the preceding candle, or red candles that gap higher and close above the close price of the preceding candle. This may cause some unexpected behaviour on some markets and timeframes. I can only recommend using 24-hour markets, if and where possible, as there are far fewer gaps and, generally, more data to work with.
ค้นหาในสคริปต์สำหรับ "通达信+选股公式+换手率+0.5+源码"
Bearish Three-Drive Harmonic Patterns [theEccentricTrader]█ OVERVIEW
This indicator automatically draws bearish three-drive harmonic patterns and price projections derived from the ranges that constitute the patterns.
█ CONCEPTS
Green and Red Candles
• A green candle is one that closes with a close price equal to or above the price it opened.
• A red candle is one that closes with a close price that is lower than the price it opened.
Swing Highs and Swing Lows
• A swing high is a green candle or series of consecutive green candles followed by a single red candle to complete the swing and form the peak.
• A swing low is a red candle or series of consecutive red candles followed by a single green candle to complete the swing and form the trough.
Peak and Trough Prices (Basic)
• The peak price of a complete swing high is the high price of either the red candle that completes the swing high or the high price of the preceding green candle, depending on which is higher.
• The trough price of a complete swing low is the low price of either the green candle that completes the swing low or the low price of the preceding red candle, depending on which is lower.
Historic Peaks and Troughs
The current, or most recent, peak and trough occurrences are referred to as occurrence zero. Previous peak and trough occurrences are referred to as historic and ordered numerically from right to left, with the most recent historic peak and trough occurrences being occurrence one.
Range
The range is simply the difference between the current peak and current trough prices, generally expressed in terms of points or pips.
Support and Resistance
• Support refers to a price level where the demand for an asset is strong enough to prevent the price from falling further.
• Resistance refers to a price level where the supply of an asset is strong enough to prevent the price from rising further.
Support and resistance levels are important because they can help traders identify where the price of an asset might pause or reverse its direction, offering potential entry and exit points. For example, a trader might look to buy an asset when it approaches a support level , with the expectation that the price will bounce back up. Alternatively, a trader might look to sell an asset when it approaches a resistance level , with the expectation that the price will drop back down.
It's important to note that support and resistance levels are not always relevant, and the price of an asset can also break through these levels and continue moving in the same direction.
Upper Trends
• A return line uptrend is formed when the current peak price is higher than the preceding peak price.
• A downtrend is formed when the current peak price is lower than the preceding peak price.
• A double-top is formed when the current peak price is equal to the preceding peak price.
Lower Trends
• An uptrend is formed when the current trough price is higher than the preceding trough price.
• A return line downtrend is formed when the current trough price is lower than the preceding trough price.
• A double-bottom is formed when the current trough price is equal to the preceding trough price.
Muti-Part Upper and Lower Trends
• A multi-part return line uptrend begins with the formation of a new return line uptrend, or higher peak, and continues until a new downtrend, or lower peak, completes the trend.
• A multi-part downtrend begins with the formation of a new downtrend, or lower peak, and continues until a new return line uptrend, or higher peak, completes the trend.
• A multi-part uptrend begins with the formation of a new uptrend, or higher trough, and continues until a new return line downtrend, or lower trough, completes the trend.
• A multi-part return line downtrend begins with the formation of a new return line downtrend, or lower trough, and continues until a new uptrend, or higher trough, completes the trend.
Double Trends
• A double uptrend is formed when the current trough price is higher than the preceding trough price and the current peak price is higher than the preceding peak price.
• A double downtrend is formed when the current peak price is lower than the preceding peak price and the current trough price is lower than the preceding trough price.
Muti-Part Double Trends
• A multi-part double uptrend begins with the formation of a new uptrend that proceeds a new return line uptrend, and continues until a new downtrend or return line downtrend ends the trend.
• A multi-part double downtrend begins with the formation of a new downtrend that proceeds a new return line downtrend, and continues until a new uptrend or return line uptrend ends the trend.
Wave Cycles
A wave cycle is here defined as a complete two-part move between a swing high and a swing low, or a swing low and a swing high. The first swing high or swing low will set the course for the sequence of wave cycles that follow; for example a chart that begins with a swing low will form its first complete wave cycle upon the formation of the first complete swing high and vice versa.
Figure 1.
Fibonacci Retracement and Extension Ratios
The Fibonacci sequence is a series of numbers in which each number is the sum of the two preceding numbers, starting with 0 and 1. For example 0 + 1 = 1, 1 + 1 = 2, 1 + 2 = 3, and so on. Ultimately, we could go on forever but the first few numbers in the sequence are as follows: 0 , 1, 1, 2, 3, 5, 8, 13, 21, 34, 55, 89, 144.
The extension ratios are calculated by dividing each number in the sequence by the number preceding it. For example 0/1 = 0, 1/1 = 1, 2/1 = 2, 3/2 = 1.5, 5/3 = 1.6666..., 8/5 = 1.6, 13/8 = 1.625, 21/13 = 1.6153..., 34/21 = 1.6190..., 55/34 = 1.6176..., 89/55 = 1.6181..., 144/89 = 1.6179..., and so on. The retracement ratios are calculated by inverting this process and dividing each number in the sequence by the number proceeding it. For example 0/1 = 0, 1/1 = 1, 1/2 = 0.5, 2/3 = 0.666..., 3/5 = 0.6, 5/8 = 0.625, 8/13 = 0.6153..., 13/21 = 0.6190..., 21/34 = 0.6176..., 34/55 = 0.6181..., 55/89 = 0.6179..., 89/144 = 0.6180..., and so on.
1.618 is considered to be the 'golden ratio', found in many natural phenomena such as the growth of seashells and the branching of trees. Some now speculate the universe oscillates at a frequency of 0,618 Hz, which could help to explain such phenomena, but this theory has yet to be proven.
Traders and analysts use Fibonacci retracement and extension indicators, consisting of horizontal lines representing different Fibonacci ratios, for identifying potential levels of support and resistance. Fibonacci ranges are typically drawn from left to right, with retracement levels representing ratios inside of the current range and extension levels representing ratios extended outside of the current range. If the current wave cycle ends on a swing low, the Fibonacci range is drawn from peak to trough. If the current wave cycle ends on a swing high the Fibonacci range is drawn from trough to peak.
Harmonic Patterns
The concept of harmonic patterns in trading was first introduced by H.M. Gartley in his book "Profits in the Stock Market", published in 1935. Gartley observed that markets have a tendency to move in repetitive patterns, and he identified several specific patterns that he believed could be used to predict future price movements.
Since then, many other traders and analysts have built upon Gartley's work and developed their own variations of harmonic patterns. One such contributor is Larry Pesavento, who developed his own methods for measuring harmonic patterns using Fibonacci ratios. Pesavento has written several books on the subject of harmonic patterns and Fibonacci ratios in trading. Another notable contributor to harmonic patterns is Scott Carney, who developed his own approach to harmonic trading in the late 1990s and also popularised the use of Fibonacci ratios to measure harmonic patterns. Carney expanded on Gartley's work and also introduced several new harmonic patterns, such as the Shark pattern and the 5-0 pattern.
The bullish and bearish Gartley patterns are the oldest recognized harmonic patterns in trading and all the other harmonic patterns are ultimately modifications of the original Gartley patterns. Gartley patterns are fundamentally composed of 5 points, or 4 waves.
Bullish and Bearish Three-Drive Patterns
• Bullish three-drive patterns are fundamentally composed of three peaks and three troughs, with the second peak being lower than the first peak and the third peak being lower than the second peak. And similarly, the second trough being lower than the first trough and the third trough being lower than the second trough.
• Bearish three-drive patterns are fundamentally composed of three troughs and three peaks, with the second trough being higher than the first trough and the third trough being higher than the second troughs. And similarly, the second peak being higher than the first peak and the third peak being higher than the second peak.
The most commonly recognised ratio measurements used by traders today are as follows:
• Wave 1 of the pattern, referred to as X1, should extend to at least 127.2% of the preceding range.
• Wave 2 of the pattern, referred to as 1A, should retrace to 61.8% of the range set by wave 1.
• Wave 3 of the pattern, referred to as drive A2, should extend to at least 127.2%, but no further than 161.8% of the range set by wave 2.
• Wave 4 of the pattern, referred to drive 2B, should retrace to 61.8% of the range set by wave 3.
• Wave 5, generally referred to as drive B3, should extend to at least 127.2%, but no further than 161.8% of the range set by wave 4.
Measurement Tolerances
In general, tolerance in measurements refers to the allowable variation or deviation from a specific value or dimension. It is the range within which a particular measurement is considered to be acceptable or accurate. In this script I have applied this concept to the measurement of harmonic pattern ratios to increase to the frequency of pattern occurrences.
For example, the AB measurement of Gartley patterns is generally set at around 61.8%, but with such specificity in the measuring requirements the patterns are very rare. We can increase the frequency of pattern occurrences by setting a tolerance. A tolerance of 10% to both downside and upside, for example, means we would have a tolerable measurement range between 51.8-71.8%, thus increasing the frequency of occurrence.
█ FEATURES
Inputs
• X1 Lower Tolerance
• 1A Lower Tolerance
• 1A Upper Tolerance
• A2 Lower Tolerance
• A2 Upper Tolerance
• 2B Lower Tolerance
• 2B Upper Tolerance
• B3 Lower Tolerance
• B3 Upper Tolerance
• Pattern Color
• Label Color
• Show Projections
• Extend Current Projection Lines
█ LIMITATIONS
All green and red candle calculations are based on differences between open and close prices, as such I have made no attempt to account for green candles that gap lower and close below the close price of the preceding candle, or red candles that gap higher and close above the close price of the preceding candle. This may cause some unexpected behaviour on some markets and timeframes. I can only recommend using 24-hour markets, if and where possible, as there are far fewer gaps and, generally, more data to work with.
█ NOTES
Please note I have set the default tolerances to 20% for this indicator as the patterns seem to be pretty rare.

Bullish Three-Drive Harmonic Patterns [theEccentricTrader]█ OVERVIEW
This indicator automatically draws bullish three-drive harmonic patterns and price projections derived from the ranges that constitute the patterns.
█ CONCEPTS
Green and Red Candles
• A green candle is one that closes with a close price equal to or above the price it opened.
• A red candle is one that closes with a close price that is lower than the price it opened.
Swing Highs and Swing Lows
• A swing high is a green candle or series of consecutive green candles followed by a single red candle to complete the swing and form the peak.
• A swing low is a red candle or series of consecutive red candles followed by a single green candle to complete the swing and form the trough.
Peak and Trough Prices (Basic)
• The peak price of a complete swing high is the high price of either the red candle that completes the swing high or the high price of the preceding green candle, depending on which is higher.
• The trough price of a complete swing low is the low price of either the green candle that completes the swing low or the low price of the preceding red candle, depending on which is lower.
Historic Peaks and Troughs
The current, or most recent, peak and trough occurrences are referred to as occurrence zero. Previous peak and trough occurrences are referred to as historic and ordered numerically from right to left, with the most recent historic peak and trough occurrences being occurrence one.
Range
The range is simply the difference between the current peak and current trough prices, generally expressed in terms of points or pips.
Support and Resistance
• Support refers to a price level where the demand for an asset is strong enough to prevent the price from falling further.
• Resistance refers to a price level where the supply of an asset is strong enough to prevent the price from rising further.
Support and resistance levels are important because they can help traders identify where the price of an asset might pause or reverse its direction, offering potential entry and exit points. For example, a trader might look to buy an asset when it approaches a support level , with the expectation that the price will bounce back up. Alternatively, a trader might look to sell an asset when it approaches a resistance level , with the expectation that the price will drop back down.
It's important to note that support and resistance levels are not always relevant, and the price of an asset can also break through these levels and continue moving in the same direction.
Upper Trends
• A return line uptrend is formed when the current peak price is higher than the preceding peak price.
• A downtrend is formed when the current peak price is lower than the preceding peak price.
• A double-top is formed when the current peak price is equal to the preceding peak price.
Lower Trends
• An uptrend is formed when the current trough price is higher than the preceding trough price.
• A return line downtrend is formed when the current trough price is lower than the preceding trough price.
• A double-bottom is formed when the current trough price is equal to the preceding trough price.
Muti-Part Upper and Lower Trends
• A multi-part return line uptrend begins with the formation of a new return line uptrend, or higher peak, and continues until a new downtrend, or lower peak, completes the trend.
• A multi-part downtrend begins with the formation of a new downtrend, or lower peak, and continues until a new return line uptrend, or higher peak, completes the trend.
• A multi-part uptrend begins with the formation of a new uptrend, or higher trough, and continues until a new return line downtrend, or lower trough, completes the trend.
• A multi-part return line downtrend begins with the formation of a new return line downtrend, or lower trough, and continues until a new uptrend, or higher trough, completes the trend.
Double Trends
• A double uptrend is formed when the current trough price is higher than the preceding trough price and the current peak price is higher than the preceding peak price.
• A double downtrend is formed when the current peak price is lower than the preceding peak price and the current trough price is lower than the preceding trough price.
Muti-Part Double Trends
• A multi-part double uptrend begins with the formation of a new uptrend that proceeds a new return line uptrend, and continues until a new downtrend or return line downtrend ends the trend.
• A multi-part double downtrend begins with the formation of a new downtrend that proceeds a new return line downtrend, and continues until a new uptrend or return line uptrend ends the trend.
Wave Cycles
A wave cycle is here defined as a complete two-part move between a swing high and a swing low, or a swing low and a swing high. The first swing high or swing low will set the course for the sequence of wave cycles that follow; for example a chart that begins with a swing low will form its first complete wave cycle upon the formation of the first complete swing high and vice versa.
Figure 1.
Fibonacci Retracement and Extension Ratios
The Fibonacci sequence is a series of numbers in which each number is the sum of the two preceding numbers, starting with 0 and 1. For example 0 + 1 = 1, 1 + 1 = 2, 1 + 2 = 3, and so on. Ultimately, we could go on forever but the first few numbers in the sequence are as follows: 0 , 1, 1, 2, 3, 5, 8, 13, 21, 34, 55, 89, 144.
The extension ratios are calculated by dividing each number in the sequence by the number preceding it. For example 0/1 = 0, 1/1 = 1, 2/1 = 2, 3/2 = 1.5, 5/3 = 1.6666..., 8/5 = 1.6, 13/8 = 1.625, 21/13 = 1.6153..., 34/21 = 1.6190..., 55/34 = 1.6176..., 89/55 = 1.6181..., 144/89 = 1.6179..., and so on. The retracement ratios are calculated by inverting this process and dividing each number in the sequence by the number proceeding it. For example 0/1 = 0, 1/1 = 1, 1/2 = 0.5, 2/3 = 0.666..., 3/5 = 0.6, 5/8 = 0.625, 8/13 = 0.6153..., 13/21 = 0.6190..., 21/34 = 0.6176..., 34/55 = 0.6181..., 55/89 = 0.6179..., 89/144 = 0.6180..., and so on.
1.618 is considered to be the 'golden ratio', found in many natural phenomena such as the growth of seashells and the branching of trees. Some now speculate the universe oscillates at a frequency of 0,618 Hz, which could help to explain such phenomena, but this theory has yet to be proven.
Traders and analysts use Fibonacci retracement and extension indicators, consisting of horizontal lines representing different Fibonacci ratios, for identifying potential levels of support and resistance. Fibonacci ranges are typically drawn from left to right, with retracement levels representing ratios inside of the current range and extension levels representing ratios extended outside of the current range. If the current wave cycle ends on a swing low, the Fibonacci range is drawn from peak to trough. If the current wave cycle ends on a swing high the Fibonacci range is drawn from trough to peak.
Harmonic Patterns
The concept of harmonic patterns in trading was first introduced by H.M. Gartley in his book "Profits in the Stock Market", published in 1935. Gartley observed that markets have a tendency to move in repetitive patterns, and he identified several specific patterns that he believed could be used to predict future price movements.
Since then, many other traders and analysts have built upon Gartley's work and developed their own variations of harmonic patterns. One such contributor is Larry Pesavento, who developed his own methods for measuring harmonic patterns using Fibonacci ratios. Pesavento has written several books on the subject of harmonic patterns and Fibonacci ratios in trading. Another notable contributor to harmonic patterns is Scott Carney, who developed his own approach to harmonic trading in the late 1990s and also popularised the use of Fibonacci ratios to measure harmonic patterns. Carney expanded on Gartley's work and also introduced several new harmonic patterns, such as the Shark pattern and the 5-0 pattern.
The bullish and bearish Gartley patterns are the oldest recognized harmonic patterns in trading and all the other harmonic patterns are ultimately modifications of the original Gartley patterns. Gartley patterns are fundamentally composed of 5 points, or 4 waves.
Bullish and Bearish Three-Drive Patterns
• Bullish three-drive patterns are fundamentally composed of three peaks and three troughs, with the second peak being lower than the first peak and the third peak being lower than the second peak. And similarly, the second trough being lower than the first trough and the third trough being lower than the second trough.
• Bearish three-drive patterns are fundamentally composed of three troughs and three peaks, with the second trough being higher than the first trough and the third trough being higher than the second troughs. And similarly, the second peak being higher than the first peak and the third peak being higher than the second peak.
The most commonly recognised ratio measurements used by traders today are as follows:
• Wave 1 of the pattern, referred to as X1, should extend to at least 127.2% of the preceding range.
• Wave 2 of the pattern, referred to as 1A, should retrace to 61.8% of the range set by wave 1.
• Wave 3 of the pattern, referred to as A2, should extend to at least 127.2%, but no further than 161.8% of the range set by wave 2.
• Wave 4 of the pattern, referred to as 2B, should retrace to 61.8% of the range set by wave 3.
• Wave 5 of the pattern, referred to as B3, should extend to at least 127.2%, but no further than 161.8% of the range set by wave 4.
Measurement Tolerances
In general, tolerance in measurements refers to the allowable variation or deviation from a specific value or dimension. It is the range within which a particular measurement is considered to be acceptable or accurate. In this script I have applied this concept to the measurement of harmonic pattern ratios to increase to the frequency of pattern occurrences.
For example, the AB measurement of Gartley patterns is generally set at around 61.8%, but with such specificity in the measuring requirements the patterns are very rare. We can increase the frequency of pattern occurrences by setting a tolerance. A tolerance of 10% to both downside and upside, for example, means we would have a tolerable measurement range between 51.8-71.8%, thus increasing the frequency of occurrence.
█ FEATURES
Inputs
• X1 Lower Tolerance
• 1A Lower Tolerance
• 1A Upper Tolerance
• A2 Lower Tolerance
• A2 Upper Tolerance
• 2B Lower Tolerance
• 2B Upper Tolerance
• B3 Lower Tolerance
• B3 Upper Tolerance
• Pattern Color
• Label Color
• Show Projections
• Extend Current Projection Lines
█ LIMITATIONS
All green and red candle calculations are based on differences between open and close prices, as such I have made no attempt to account for green candles that gap lower and close below the close price of the preceding candle, or red candles that gap higher and close above the close price of the preceding candle. This may cause some unexpected behaviour on some markets and timeframes. I can only recommend using 24-hour markets, if and where possible, as there are far fewer gaps and, generally, more data to work with.
█ NOTES
Please note I have set the default tolerances to 20% for this indicator as the patterns seem to be pretty rare.

Bearish Butterfly Harmonic Patterns [theEccentricTrader]█ OVERVIEW
This indicator automatically draws bearish butterfly harmonic patterns and price projections derived from the ranges that constitute the patterns.
█ CONCEPTS
Green and Red Candles
• A green candle is one that closes with a close price equal to or above the price it opened.
• A red candle is one that closes with a close price that is lower than the price it opened.
Swing Highs and Swing Lows
• A swing high is a green candle or series of consecutive green candles followed by a single red candle to complete the swing and form the peak.
• A swing low is a red candle or series of consecutive red candles followed by a single green candle to complete the swing and form the trough.
Peak and Trough Prices (Basic)
• The peak price of a complete swing high is the high price of either the red candle that completes the swing high or the high price of the preceding green candle, depending on which is higher.
• The trough price of a complete swing low is the low price of either the green candle that completes the swing low or the low price of the preceding red candle, depending on which is lower.
Historic Peaks and Troughs
The current, or most recent, peak and trough occurrences are referred to as occurrence zero. Previous peak and trough occurrences are referred to as historic and ordered numerically from right to left, with the most recent historic peak and trough occurrences being occurrence one.
Range
The range is simply the difference between the current peak and current trough prices, generally expressed in terms of points or pips.
Support and Resistance
• Support refers to a price level where the demand for an asset is strong enough to prevent the price from falling further.
• Resistance refers to a price level where the supply of an asset is strong enough to prevent the price from rising further.
Support and resistance levels are important because they can help traders identify where the price of an asset might pause or reverse its direction, offering potential entry and exit points. For example, a trader might look to buy an asset when it approaches a support level , with the expectation that the price will bounce back up. Alternatively, a trader might look to sell an asset when it approaches a resistance level , with the expectation that the price will drop back down.
It's important to note that support and resistance levels are not always relevant, and the price of an asset can also break through these levels and continue moving in the same direction.
Upper Trends
• A return line uptrend is formed when the current peak price is higher than the preceding peak price.
• A downtrend is formed when the current peak price is lower than the preceding peak price.
• A double-top is formed when the current peak price is equal to the preceding peak price.
Lower Trends
• An uptrend is formed when the current trough price is higher than the preceding trough price.
• A return line downtrend is formed when the current trough price is lower than the preceding trough price.
• A double-bottom is formed when the current trough price is equal to the preceding trough price.
Muti-Part Upper and Lower Trends
• A multi-part return line uptrend begins with the formation of a new return line uptrend, or higher peak, and continues until a new downtrend, or lower peak, completes the trend.
• A multi-part downtrend begins with the formation of a new downtrend, or lower peak, and continues until a new return line uptrend, or higher peak, completes the trend.
• A multi-part uptrend begins with the formation of a new uptrend, or higher trough, and continues until a new return line downtrend, or lower trough, completes the trend.
• A multi-part return line downtrend begins with the formation of a new return line downtrend, or lower trough, and continues until a new uptrend, or higher trough, completes the trend.
Wave Cycles
A wave cycle is here defined as a complete two-part move between a swing high and a swing low, or a swing low and a swing high. The first swing high or swing low will set the course for the sequence of wave cycles that follow; for example a chart that begins with a swing low will form its first complete wave cycle upon the formation of the first complete swing high and vice versa.
Figure 1.
Fibonacci Retracement and Extension Ratios
The Fibonacci sequence is a series of numbers in which each number is the sum of the two preceding numbers, starting with 0 and 1. For example 0 + 1 = 1, 1 + 1 = 2, 1 + 2 = 3, and so on. Ultimately, we could go on forever but the first few numbers in the sequence are as follows: 0 , 1, 1, 2, 3, 5, 8, 13, 21, 34, 55, 89, 144.
The extension ratios are calculated by dividing each number in the sequence by the number preceding it. For example 0/1 = 0, 1/1 = 1, 2/1 = 2, 3/2 = 1.5, 5/3 = 1.6666..., 8/5 = 1.6, 13/8 = 1.625, 21/13 = 1.6153..., 34/21 = 1.6190..., 55/34 = 1.6176..., 89/55 = 1.6181..., 144/89 = 1.6179..., and so on. The retracement ratios are calculated by inverting this process and dividing each number in the sequence by the number proceeding it. For example 0/1 = 0, 1/1 = 1, 1/2 = 0.5, 2/3 = 0.666..., 3/5 = 0.6, 5/8 = 0.625, 8/13 = 0.6153..., 13/21 = 0.6190..., 21/34 = 0.6176..., 34/55 = 0.6181..., 55/89 = 0.6179..., 89/144 = 0.6180..., and so on.
1.618 is considered to be the 'golden ratio', found in many natural phenomena such as the growth of seashells and the branching of trees. Some now speculate the universe oscillates at a frequency of 0,618 Hz, which could help to explain such phenomena, but this theory has yet to be proven.
Traders and analysts use Fibonacci retracement and extension indicators, consisting of horizontal lines representing different Fibonacci ratios, for identifying potential levels of support and resistance. Fibonacci ranges are typically drawn from left to right, with retracement levels representing ratios inside of the current range and extension levels representing ratios extended outside of the current range. If the current wave cycle ends on a swing low, the Fibonacci range is drawn from peak to trough. If the current wave cycle ends on a swing high the Fibonacci range is drawn from trough to peak.
Harmonic Patterns
The concept of harmonic patterns in trading was first introduced by H.M. Gartley in his book "Profits in the Stock Market", published in 1935. Gartley observed that markets have a tendency to move in repetitive patterns, and he identified several specific patterns that he believed could be used to predict future price movements.
Since then, many other traders and analysts have built upon Gartley's work and developed their own variations of harmonic patterns. One such contributor is Larry Pesavento, who developed his own methods for measuring harmonic patterns using Fibonacci ratios. Pesavento has written several books on the subject of harmonic patterns and Fibonacci ratios in trading. Another notable contributor to harmonic patterns is Scott Carney, who developed his own approach to harmonic trading in the late 1990s and also popularised the use of Fibonacci ratios to measure harmonic patterns. Carney expanded on Gartley's work and also introduced several new harmonic patterns, such as the Shark pattern and the 5-0 pattern.
The bullish and bearish Gartley patterns are the oldest recognized harmonic patterns in trading and all the other harmonic patterns are ultimately modifications of the original Gartley patterns. Gartley patterns are fundamentally composed of 5 points, or 4 waves.
Bullish and Bearish Butterfly Patterns
• Bullish butterfly patterns are fundamentally composed of two peaks and three troughs, with the second peak being lower than the first peak. And the third trough being lower than both the second and first troughs, while the second trough is higher than the first.
• Bearish butterfly patterns are fundamentally composed of two troughs and three peaks, with the second trough being higher than the first trough. And the third peak being higher than both the second and first peaks, while the second peak is lower than the first.
The most commonly recognised ratio measurements used by traders today are as follows:
• Wave 1 of the pattern, generally referred to as XA, has no specific ratio requirements.
• Wave 2 of the pattern, generally referred to as AB, should retrace by 78.6% of the range set by wave 1.
• Wave 3 of the pattern, generally referred to as BC, should retrace by at least 38.2%, but no further than 88.6% of the range set by wave 2.
• Wave 4 of the pattern, generally referred to as CD, should extend to at least 161.8%, but no further than 261.8% of the range set by wave 3.
• The last measure, generally referred to as AD, is that of wave 4 as a ratio of the range set by wave 1, which should extend to 127%.
Measurement Tolerances
In general, tolerance in measurements refers to the allowable variation or deviation from a specific value or dimension. It is the range within which a particular measurement is considered to be acceptable or accurate. In this script I have applied this concept to the measurement of harmonic pattern ratios to increase to the frequency of pattern occurrences.
For example, the AB measurement of Gartley patterns is generally set at around 61.8%, but with such specificity in the measuring requirements the patterns are very rare. We can increase the frequency of pattern occurrences by setting a tolerance. A tolerance of 10% to both downside and upside, which is the default setting for all tolerances, means we would have a tolerable measurement range between 51.8-71.8%, thus increasing the frequency of occurrence.
█ FEATURES
Inputs
• AB Lower Tolerance
• AB Upper Tolerance
• BC Lower Tolerance
• BC Upper Tolerance
• CD Lower Tolerance
• CD Upper Tolerance
• AD Lower Tolerance
• AD Upper Tolerance
• Pattern Color
• Label Color
• Show Projections
• Extend Current Projection Lines
█ LIMITATIONS
All green and red candle calculations are based on differences between open and close prices, as such I have made no attempt to account for green candles that gap lower and close below the close price of the preceding candle, or red candles that gap higher and close above the close price of the preceding candle. This may cause some unexpected behaviour on some markets and timeframes. I can only recommend using 24-hour markets, if and where possible, as there are far fewer gaps and, generally, more data to work with.

Bullish Butterfly Harmonic Patterns [theEccentricTrader]█ OVERVIEW
This indicator automatically draws bullish butterfly harmonic patterns and price projections derived from the ranges that constitute the patterns.
█ CONCEPTS
Green and Red Candles
• A green candle is one that closes with a close price equal to or above the price it opened.
• A red candle is one that closes with a close price that is lower than the price it opened.
Swing Highs and Swing Lows
• A swing high is a green candle or series of consecutive green candles followed by a single red candle to complete the swing and form the peak.
• A swing low is a red candle or series of consecutive red candles followed by a single green candle to complete the swing and form the trough.
Peak and Trough Prices (Basic)
• The peak price of a complete swing high is the high price of either the red candle that completes the swing high or the high price of the preceding green candle, depending on which is higher.
• The trough price of a complete swing low is the low price of either the green candle that completes the swing low or the low price of the preceding red candle, depending on which is lower.
Historic Peaks and Troughs
The current, or most recent, peak and trough occurrences are referred to as occurrence zero. Previous peak and trough occurrences are referred to as historic and ordered numerically from right to left, with the most recent historic peak and trough occurrences being occurrence one.
Range
The range is simply the difference between the current peak and current trough prices, generally expressed in terms of points or pips.
Support and Resistance
• Support refers to a price level where the demand for an asset is strong enough to prevent the price from falling further.
• Resistance refers to a price level where the supply of an asset is strong enough to prevent the price from rising further.
Support and resistance levels are important because they can help traders identify where the price of an asset might pause or reverse its direction, offering potential entry and exit points. For example, a trader might look to buy an asset when it approaches a support level , with the expectation that the price will bounce back up. Alternatively, a trader might look to sell an asset when it approaches a resistance level , with the expectation that the price will drop back down.
It's important to note that support and resistance levels are not always relevant, and the price of an asset can also break through these levels and continue moving in the same direction.
Upper Trends
• A return line uptrend is formed when the current peak price is higher than the preceding peak price.
• A downtrend is formed when the current peak price is lower than the preceding peak price.
• A double-top is formed when the current peak price is equal to the preceding peak price.
Lower Trends
• An uptrend is formed when the current trough price is higher than the preceding trough price.
• A return line downtrend is formed when the current trough price is lower than the preceding trough price.
• A double-bottom is formed when the current trough price is equal to the preceding trough price.
Muti-Part Upper and Lower Trends
• A multi-part return line uptrend begins with the formation of a new return line uptrend, or higher peak, and continues until a new downtrend, or lower peak, completes the trend.
• A multi-part downtrend begins with the formation of a new downtrend, or lower peak, and continues until a new return line uptrend, or higher peak, completes the trend.
• A multi-part uptrend begins with the formation of a new uptrend, or higher trough, and continues until a new return line downtrend, or lower trough, completes the trend.
• A multi-part return line downtrend begins with the formation of a new return line downtrend, or lower trough, and continues until a new uptrend, or higher trough, completes the trend.
Wave Cycles
A wave cycle is here defined as a complete two-part move between a swing high and a swing low, or a swing low and a swing high. The first swing high or swing low will set the course for the sequence of wave cycles that follow; for example a chart that begins with a swing low will form its first complete wave cycle upon the formation of the first complete swing high and vice versa.
Figure 1.
Fibonacci Retracement and Extension Ratios
The Fibonacci sequence is a series of numbers in which each number is the sum of the two preceding numbers, starting with 0 and 1. For example 0 + 1 = 1, 1 + 1 = 2, 1 + 2 = 3, and so on. Ultimately, we could go on forever but the first few numbers in the sequence are as follows: 0 , 1, 1, 2, 3, 5, 8, 13, 21, 34, 55, 89, 144.
The extension ratios are calculated by dividing each number in the sequence by the number preceding it. For example 0/1 = 0, 1/1 = 1, 2/1 = 2, 3/2 = 1.5, 5/3 = 1.6666..., 8/5 = 1.6, 13/8 = 1.625, 21/13 = 1.6153..., 34/21 = 1.6190..., 55/34 = 1.6176..., 89/55 = 1.6181..., 144/89 = 1.6179..., and so on. The retracement ratios are calculated by inverting this process and dividing each number in the sequence by the number proceeding it. For example 0/1 = 0, 1/1 = 1, 1/2 = 0.5, 2/3 = 0.666..., 3/5 = 0.6, 5/8 = 0.625, 8/13 = 0.6153..., 13/21 = 0.6190..., 21/34 = 0.6176..., 34/55 = 0.6181..., 55/89 = 0.6179..., 89/144 = 0.6180..., and so on.
1.618 is considered to be the 'golden ratio', found in many natural phenomena such as the growth of seashells and the branching of trees. Some now speculate the universe oscillates at a frequency of 0,618 Hz, which could help to explain such phenomena, but this theory has yet to be proven.
Traders and analysts use Fibonacci retracement and extension indicators, consisting of horizontal lines representing different Fibonacci ratios, for identifying potential levels of support and resistance. Fibonacci ranges are typically drawn from left to right, with retracement levels representing ratios inside of the current range and extension levels representing ratios extended outside of the current range. If the current wave cycle ends on a swing low, the Fibonacci range is drawn from peak to trough. If the current wave cycle ends on a swing high the Fibonacci range is drawn from trough to peak.
Harmonic Patterns
The concept of harmonic patterns in trading was first introduced by H.M. Gartley in his book "Profits in the Stock Market", published in 1935. Gartley observed that markets have a tendency to move in repetitive patterns, and he identified several specific patterns that he believed could be used to predict future price movements.
Since then, many other traders and analysts have built upon Gartley's work and developed their own variations of harmonic patterns. One such contributor is Larry Pesavento, who developed his own methods for measuring harmonic patterns using Fibonacci ratios. Pesavento has written several books on the subject of harmonic patterns and Fibonacci ratios in trading. Another notable contributor to harmonic patterns is Scott Carney, who developed his own approach to harmonic trading in the late 1990s and also popularised the use of Fibonacci ratios to measure harmonic patterns. Carney expanded on Gartley's work and also introduced several new harmonic patterns, such as the Shark pattern and the 5-0 pattern.
The bullish and bearish Gartley patterns are the oldest recognized harmonic patterns in trading and all the other harmonic patterns are ultimately modifications of the original Gartley patterns. Gartley patterns are fundamentally composed of 5 points, or 4 waves.
Bullish and Bearish Butterfly Patterns
• Bullish butterfly patterns are fundamentally composed of two peaks and three troughs, with the second peak being lower than the first peak. And the third trough being lower than both the second and first troughs, while the second trough is higher than the first.
• Bearish butterfly patterns are fundamentally composed of two troughs and three peaks, with the second trough being higher than the first trough. And the third peak being higher than both the second and first peaks, while the second peak is lower than the first.
The most commonly recognised ratio measurements used by traders today are as follows:
• Wave 1 of the pattern, generally referred to as XA, has no specific ratio requirements.
• Wave 2 of the pattern, generally referred to as AB, should retrace by 78.6% of the range set by wave 1.
• Wave 3 of the pattern, generally referred to as BC, should retrace by at least 38.2%, but no further than 88.6% of the range set by wave 2.
• Wave 4 of the pattern, generally referred to as CD, should extend to at least 161.8%, but no further than 261.8% of the range set by wave 3.
• The last measure, generally referred to as AD, is that of wave 4 as a ratio of the range set by wave 1, which should extend to 127%.
Measurement Tolerances
In general, tolerance in measurements refers to the allowable variation or deviation from a specific value or dimension. It is the range within which a particular measurement is considered to be acceptable or accurate. In this script I have applied this concept to the measurement of harmonic pattern ratios to increase to the frequency of pattern occurrences.
For example, the AB measurement of Gartley patterns is generally set at around 61.8%, but with such specificity in the measuring requirements the patterns are very rare. We can increase the frequency of pattern occurrences by setting a tolerance. A tolerance of 10% to both downside and upside, which is the default setting for all tolerances, means we would have a tolerable measurement range between 51.8-71.8%, thus increasing the frequency of occurrence.
█ FEATURES
Inputs
• AB Lower Tolerance
• AB Upper Tolerance
• BC Lower Tolerance
• BC Upper Tolerance
• CD Lower Tolerance
• CD Upper Tolerance
• AD Lower Tolerance
• AD Upper Tolerance
• Pattern Color
• Label Color
• Show Projections
• Extend Current Projection Lines
█ LIMITATIONS
All green and red candle calculations are based on differences between open and close prices, as such I have made no attempt to account for green candles that gap lower and close below the close price of the preceding candle, or red candles that gap higher and close above the close price of the preceding candle. This may cause some unexpected behaviour on some markets and timeframes. I can only recommend using 24-hour markets, if and where possible, as there are far fewer gaps and, generally, more data to work with.

Bearish Crab Harmonic Patterns [theEccentricTrader]█ OVERVIEW
This indicator automatically draws bearish crab harmonic patterns and price projections derived from the ranges that constitute the patterns.
█ CONCEPTS
Green and Red Candles
• A green candle is one that closes with a close price equal to or above the price it opened.
• A red candle is one that closes with a close price that is lower than the price it opened.
Swing Highs and Swing Lows
• A swing high is a green candle or series of consecutive green candles followed by a single red candle to complete the swing and form the peak.
• A swing low is a red candle or series of consecutive red candles followed by a single green candle to complete the swing and form the trough.
Peak and Trough Prices (Basic)
• The peak price of a complete swing high is the high price of either the red candle that completes the swing high or the high price of the preceding green candle, depending on which is higher.
• The trough price of a complete swing low is the low price of either the green candle that completes the swing low or the low price of the preceding red candle, depending on which is lower.
Historic Peaks and Troughs
The current, or most recent, peak and trough occurrences are referred to as occurrence zero. Previous peak and trough occurrences are referred to as historic and ordered numerically from right to left, with the most recent historic peak and trough occurrences being occurrence one.
Range
The range is simply the difference between the current peak and current trough prices, generally expressed in terms of points or pips.
Support and Resistance
• Support refers to a price level where the demand for an asset is strong enough to prevent the price from falling further.
• Resistance refers to a price level where the supply of an asset is strong enough to prevent the price from rising further.
Support and resistance levels are important because they can help traders identify where the price of an asset might pause or reverse its direction, offering potential entry and exit points. For example, a trader might look to buy an asset when it approaches a support level , with the expectation that the price will bounce back up. Alternatively, a trader might look to sell an asset when it approaches a resistance level , with the expectation that the price will drop back down.
It's important to note that support and resistance levels are not always relevant, and the price of an asset can also break through these levels and continue moving in the same direction.
Upper Trends
• A return line uptrend is formed when the current peak price is higher than the preceding peak price.
• A downtrend is formed when the current peak price is lower than the preceding peak price.
• A double-top is formed when the current peak price is equal to the preceding peak price.
Lower Trends
• An uptrend is formed when the current trough price is higher than the preceding trough price.
• A return line downtrend is formed when the current trough price is lower than the preceding trough price.
• A double-bottom is formed when the current trough price is equal to the preceding trough price.
Muti-Part Upper and Lower Trends
• A multi-part return line uptrend begins with the formation of a new return line uptrend, or higher peak, and continues until a new downtrend, or lower peak, completes the trend.
• A multi-part downtrend begins with the formation of a new downtrend, or lower peak, and continues until a new return line uptrend, or higher peak, completes the trend.
• A multi-part uptrend begins with the formation of a new uptrend, or higher trough, and continues until a new return line downtrend, or lower trough, completes the trend.
• A multi-part return line downtrend begins with the formation of a new return line downtrend, or lower trough, and continues until a new uptrend, or higher trough, completes the trend.
Wave Cycles
A wave cycle is here defined as a complete two-part move between a swing high and a swing low, or a swing low and a swing high. The first swing high or swing low will set the course for the sequence of wave cycles that follow; for example a chart that begins with a swing low will form its first complete wave cycle upon the formation of the first complete swing high and vice versa.
Figure 1.
Fibonacci Retracement and Extension Ratios
The Fibonacci sequence is a series of numbers in which each number is the sum of the two preceding numbers, starting with 0 and 1. For example 0 + 1 = 1, 1 + 1 = 2, 1 + 2 = 3, and so on. Ultimately, we could go on forever but the first few numbers in the sequence are as follows: 0 , 1, 1, 2, 3, 5, 8, 13, 21, 34, 55, 89, 144.
The extension ratios are calculated by dividing each number in the sequence by the number preceding it. For example 0/1 = 0, 1/1 = 1, 2/1 = 2, 3/2 = 1.5, 5/3 = 1.6666..., 8/5 = 1.6, 13/8 = 1.625, 21/13 = 1.6153..., 34/21 = 1.6190..., 55/34 = 1.6176..., 89/55 = 1.6181..., 144/89 = 1.6179..., and so on. The retracement ratios are calculated by inverting this process and dividing each number in the sequence by the number proceeding it. For example 0/1 = 0, 1/1 = 1, 1/2 = 0.5, 2/3 = 0.666..., 3/5 = 0.6, 5/8 = 0.625, 8/13 = 0.6153..., 13/21 = 0.6190..., 21/34 = 0.6176..., 34/55 = 0.6181..., 55/89 = 0.6179..., 89/144 = 0.6180..., and so on.
1.618 is considered to be the 'golden ratio', found in many natural phenomena such as the growth of seashells and the branching of trees. Some now speculate the universe oscillates at a frequency of 0,618 Hz, which could help to explain such phenomena, but this theory has yet to be proven.
Traders and analysts use Fibonacci retracement and extension indicators, consisting of horizontal lines representing different Fibonacci ratios, for identifying potential levels of support and resistance. Fibonacci ranges are typically drawn from left to right, with retracement levels representing ratios inside of the current range and extension levels representing ratios extended outside of the current range. If the current wave cycle ends on a swing low, the Fibonacci range is drawn from peak to trough. If the current wave cycle ends on a swing high the Fibonacci range is drawn from trough to peak.
Harmonic Patterns
The concept of harmonic patterns in trading was first introduced by H.M. Gartley in his book "Profits in the Stock Market", published in 1935. Gartley observed that markets have a tendency to move in repetitive patterns, and he identified several specific patterns that he believed could be used to predict future price movements.
Since then, many other traders and analysts have built upon Gartley's work and developed their own variations of harmonic patterns. One such contributor is Larry Pesavento, who developed his own methods for measuring harmonic patterns using Fibonacci ratios. Pesavento has written several books on the subject of harmonic patterns and Fibonacci ratios in trading. Another notable contributor to harmonic patterns is Scott Carney, who developed his own approach to harmonic trading in the late 1990s and also popularised the use of Fibonacci ratios to measure harmonic patterns. Carney expanded on Gartley's work and also introduced several new harmonic patterns, such as the Shark pattern and the 5-0 pattern.
The bullish and bearish Gartley patterns are the oldest recognized harmonic patterns in trading and all the other harmonic patterns are ultimately modifications of the original Gartley patterns. Gartley patterns are fundamentally composed of 5 points, or 4 waves.
Bullish and Bearish Crab Patterns
• Bullish crab patterns are fundamentally composed of three troughs and two peaks, with the second peak being lower than the first peak. And the third trough being lower than both the second and first troughs, while the second trough is higher than the first.
• Bearish crab patterns are fundamentally composed of three peaks and two troughs, with the second trough being higher than the first trough. And the third peak being higher than both the second and first peaks, while the second peak is lower than the first.
The most commonly recognised ratio measurements used by traders today are as follows:
• Wave 1 of the pattern, generally referred to as XA, has no specific ratio requirements.
• Wave 2 of the pattern, generally referred to as AB, should retrace by at least 38.2%, but no further than 61.8% of the range set by wave 1.
• Wave 3 of the pattern, generally referred to as BC, should retrace by at least 38.2%, but no further than 88.6% of the range set by wave 2.
• Wave 4 of the pattern, generally referred to as CD, should extend to at least 261.8%, but no further than 361.8% of the range set by wave 3.
• The last measure, generally referred to as AD, is that of wave 4 as a ratio of the range set by wave 1, which should extend to 161.8%.
Measurement Tolerances
In general, tolerance in measurements refers to the allowable variation or deviation from a specific value or dimension. It is the range within which a particular measurement is considered to be acceptable or accurate. In this script I have applied this concept to the measurement of harmonic pattern ratios to increase to the frequency of pattern occurrences.
For example, the AB measurement of Gartley patterns is generally set at around 61.8%, but with such specificity in the measuring requirements the patterns are very rare. We can increase the frequency of pattern occurrences by setting a tolerance. A tolerance of 10% to both downside and upside, which is the default setting for all tolerances, means we would have a tolerable measurement range between 51.8-71.8%, thus increasing the frequency of occurrence.
█ FEATURES
Inputs
• AB Lower Tolerance
• AB Upper Tolerance
• BC Lower Tolerance
• BC Upper Tolerance
• CD Lower Tolerance
• CD Upper Tolerance
• AD Lower Tolerance
• AD Upper Tolerance
• Pattern Color
• Label Color
• Show Projections
• Extend Current Projection Lines
█ LIMITATIONS
All green and red candle calculations are based on differences between open and close prices, as such I have made no attempt to account for green candles that gap lower and close below the close price of the preceding candle, or red candles that gap higher and close above the close price of the preceding candle. This may cause some unexpected behaviour on some markets and timeframes. I can only recommend using 24-hour markets, if and where possible, as there are far fewer gaps and, generally, more data to work with.

Bullish Crab Harmonic Patterns [theEccentricTrader]█ OVERVIEW
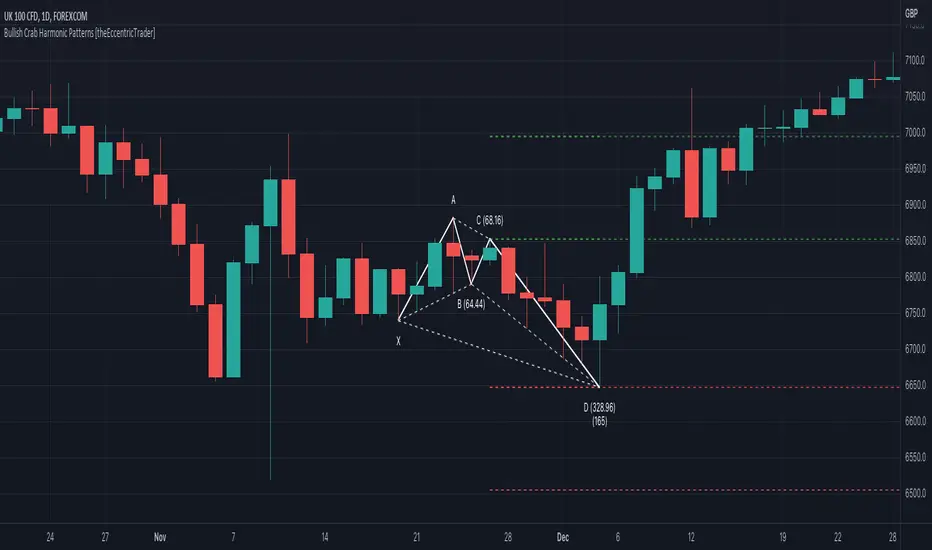
This indicator automatically draws bullish crab harmonic patterns and price projections derived from the ranges that constitute the patterns.
█ CONCEPTS
Green and Red Candles
• A green candle is one that closes with a close price equal to or above the price it opened.
• A red candle is one that closes with a close price that is lower than the price it opened.
Swing Highs and Swing Lows
• A swing high is a green candle or series of consecutive green candles followed by a single red candle to complete the swing and form the peak.
• A swing low is a red candle or series of consecutive red candles followed by a single green candle to complete the swing and form the trough.
Peak and Trough Prices (Basic)
• The peak price of a complete swing high is the high price of either the red candle that completes the swing high or the high price of the preceding green candle, depending on which is higher.
• The trough price of a complete swing low is the low price of either the green candle that completes the swing low or the low price of the preceding red candle, depending on which is lower.
Historic Peaks and Troughs
The current, or most recent, peak and trough occurrences are referred to as occurrence zero. Previous peak and trough occurrences are referred to as historic and ordered numerically from right to left, with the most recent historic peak and trough occurrences being occurrence one.
Range
The range is simply the difference between the current peak and current trough prices, generally expressed in terms of points or pips.
Support and Resistance
• Support refers to a price level where the demand for an asset is strong enough to prevent the price from falling further.
• Resistance refers to a price level where the supply of an asset is strong enough to prevent the price from rising further.
Support and resistance levels are important because they can help traders identify where the price of an asset might pause or reverse its direction, offering potential entry and exit points. For example, a trader might look to buy an asset when it approaches a support level , with the expectation that the price will bounce back up. Alternatively, a trader might look to sell an asset when it approaches a resistance level , with the expectation that the price will drop back down.
It's important to note that support and resistance levels are not always relevant, and the price of an asset can also break through these levels and continue moving in the same direction.
Upper Trends
• A return line uptrend is formed when the current peak price is higher than the preceding peak price.
• A downtrend is formed when the current peak price is lower than the preceding peak price.
• A double-top is formed when the current peak price is equal to the preceding peak price.
Lower Trends
• An uptrend is formed when the current trough price is higher than the preceding trough price.
• A return line downtrend is formed when the current trough price is lower than the preceding trough price.
• A double-bottom is formed when the current trough price is equal to the preceding trough price.
Muti-Part Upper and Lower Trends
• A multi-part return line uptrend begins with the formation of a new return line uptrend, or higher peak, and continues until a new downtrend, or lower peak, completes the trend.
• A multi-part downtrend begins with the formation of a new downtrend, or lower peak, and continues until a new return line uptrend, or higher peak, completes the trend.
• A multi-part uptrend begins with the formation of a new uptrend, or higher trough, and continues until a new return line downtrend, or lower trough, completes the trend.
• A multi-part return line downtrend begins with the formation of a new return line downtrend, or lower trough, and continues until a new uptrend, or higher trough, completes the trend.
Wave Cycles
A wave cycle is here defined as a complete two-part move between a swing high and a swing low, or a swing low and a swing high. The first swing high or swing low will set the course for the sequence of wave cycles that follow; for example a chart that begins with a swing low will form its first complete wave cycle upon the formation of the first complete swing high and vice versa.
Figure 1.
Fibonacci Retracement and Extension Ratios
The Fibonacci sequence is a series of numbers in which each number is the sum of the two preceding numbers, starting with 0 and 1. For example 0 + 1 = 1, 1 + 1 = 2, 1 + 2 = 3, and so on. Ultimately, we could go on forever but the first few numbers in the sequence are as follows: 0 , 1, 1, 2, 3, 5, 8, 13, 21, 34, 55, 89, 144.
The extension ratios are calculated by dividing each number in the sequence by the number preceding it. For example 0/1 = 0, 1/1 = 1, 2/1 = 2, 3/2 = 1.5, 5/3 = 1.6666..., 8/5 = 1.6, 13/8 = 1.625, 21/13 = 1.6153..., 34/21 = 1.6190..., 55/34 = 1.6176..., 89/55 = 1.6181..., 144/89 = 1.6179..., and so on. The retracement ratios are calculated by inverting this process and dividing each number in the sequence by the number proceeding it. For example 0/1 = 0, 1/1 = 1, 1/2 = 0.5, 2/3 = 0.666..., 3/5 = 0.6, 5/8 = 0.625, 8/13 = 0.6153..., 13/21 = 0.6190..., 21/34 = 0.6176..., 34/55 = 0.6181..., 55/89 = 0.6179..., 89/144 = 0.6180..., and so on.
1.618 is considered to be the 'golden ratio', found in many natural phenomena such as the growth of seashells and the branching of trees. Some now speculate the universe oscillates at a frequency of 0,618 Hz, which could help to explain such phenomena, but this theory has yet to be proven.
Traders and analysts use Fibonacci retracement and extension indicators, consisting of horizontal lines representing different Fibonacci ratios, for identifying potential levels of support and resistance. Fibonacci ranges are typically drawn from left to right, with retracement levels representing ratios inside of the current range and extension levels representing ratios extended outside of the current range. If the current wave cycle ends on a swing low, the Fibonacci range is drawn from peak to trough. If the current wave cycle ends on a swing high the Fibonacci range is drawn from trough to peak.
Harmonic Patterns
The concept of harmonic patterns in trading was first introduced by H.M. Gartley in his book "Profits in the Stock Market", published in 1935. Gartley observed that markets have a tendency to move in repetitive patterns, and he identified several specific patterns that he believed could be used to predict future price movements.
Since then, many other traders and analysts have built upon Gartley's work and developed their own variations of harmonic patterns. One such contributor is Larry Pesavento, who developed his own methods for measuring harmonic patterns using Fibonacci ratios. Pesavento has written several books on the subject of harmonic patterns and Fibonacci ratios in trading. Another notable contributor to harmonic patterns is Scott Carney, who developed his own approach to harmonic trading in the late 1990s and also popularised the use of Fibonacci ratios to measure harmonic patterns. Carney expanded on Gartley's work and also introduced several new harmonic patterns, such as the Shark pattern and the 5-0 pattern.
The bullish and bearish Gartley patterns are the oldest recognized harmonic patterns in trading and all the other harmonic patterns are ultimately modifications of the original Gartley patterns. Gartley patterns are fundamentally composed of 5 points, or 4 waves.
Bullish and Bearish Crab Patterns
• Bullish crab patterns are fundamentally composed of three troughs and two peaks, with the second peak being lower than the first peak. And the third trough being lower than both the second and first troughs, while the second trough is higher than the first.
• Bearish crab patterns are fundamentally composed of three peaks and two troughs, with the second trough being higher than the first trough. And the third peak being higher than both the second and first peaks, while the second peak is lower than the first.
The most commonly recognised ratio measurements used by traders today are as follows:
• Wave 1 of the pattern, generally referred to as XA, has no specific ratio requirements.
• Wave 2 of the pattern, generally referred to as AB, should retrace by at least 38.2%, but no further than 61.8% of the range set by wave 1.
• Wave 3 of the pattern, generally referred to as BC, should retrace by at least 38.2%, but no further than 88.6% of the range set by wave 2.
• Wave 4 of the pattern, generally referred to as CD, should extend to at least 261.8%, but no further than 361.8% of the range set by wave 3.
• The last measure, generally referred to as AD, is that of wave 4 as a ratio of the range set by wave 1, which should extend to 161.8%.
Measurement Tolerances
In general, tolerance in measurements refers to the allowable variation or deviation from a specific value or dimension. It is the range within which a particular measurement is considered to be acceptable or accurate. In this script I have applied this concept to the measurement of harmonic pattern ratios to increase to the frequency of pattern occurrences.
For example, the AB measurement of Gartley patterns is generally set at around 61.8%, but with such specificity in the measuring requirements the patterns are very rare. We can increase the frequency of pattern occurrences by setting a tolerance. A tolerance of 10% to both downside and upside, which is the default setting for all tolerances, means we would have a tolerable measurement range between 51.8-71.8%, thus increasing the frequency of occurrence.
█ FEATURES
Inputs
• AB Lower Tolerance
• AB Upper Tolerance
• BC Lower Tolerance
• BC Upper Tolerance
• CD Lower Tolerance
• CD Upper Tolerance
• AD Lower Tolerance
• AD Upper Tolerance
• Pattern Color
• Label Color
• Show Projections
• Extend Current Projection Lines
█ LIMITATIONS
All green and red candle calculations are based on differences between open and close prices, as such I have made no attempt to account for green candles that gap lower and close below the close price of the preceding candle, or red candles that gap higher and close above the close price of the preceding candle. This may cause some unexpected behaviour on some markets and timeframes. I can only recommend using 24-hour markets, if and where possible, as there are far fewer gaps and, generally, more data to work with.
Bearish Bat Harmonic Patterns [theEccentricTrader]█ OVERVIEW
This indicator automatically draws bearish bat harmonic patterns and price projections derived from the ranges that constitute the patterns.
█ CONCEPTS
Green and Red Candles
• A green candle is one that closes with a close price equal to or above the price it opened.
• A red candle is one that closes with a close price that is lower than the price it opened.
Swing Highs and Swing Lows
• A swing high is a green candle or series of consecutive green candles followed by a single red candle to complete the swing and form the peak.
• A swing low is a red candle or series of consecutive red candles followed by a single green candle to complete the swing and form the trough.
Peak and Trough Prices (Basic)
• The peak price of a complete swing high is the high price of either the red candle that completes the swing high or the high price of the preceding green candle, depending on which is higher.
• The trough price of a complete swing low is the low price of either the green candle that completes the swing low or the low price of the preceding red candle, depending on which is lower.
Historic Peaks and Troughs
The current, or most recent, peak and trough occurrences are referred to as occurrence zero. Previous peak and trough occurrences are referred to as historic and ordered numerically from right to left, with the most recent historic peak and trough occurrences being occurrence one.
Range
The range is simply the difference between the current peak and current trough prices, generally expressed in terms of points or pips.
Support and Resistance
• Support refers to a price level where the demand for an asset is strong enough to prevent the price from falling further.
• Resistance refers to a price level where the supply of an asset is strong enough to prevent the price from rising further.
Support and resistance levels are important because they can help traders identify where the price of an asset might pause or reverse its direction, offering potential entry and exit points. For example, a trader might look to buy an asset when it approaches a support level , with the expectation that the price will bounce back up. Alternatively, a trader might look to sell an asset when it approaches a resistance level , with the expectation that the price will drop back down.
It's important to note that support and resistance levels are not always relevant, and the price of an asset can also break through these levels and continue moving in the same direction.
Upper Trends
• A return line uptrend is formed when the current peak price is higher than the preceding peak price.
• A downtrend is formed when the current peak price is lower than the preceding peak price.
• A double-top is formed when the current peak price is equal to the preceding peak price.
Lower Trends
• An uptrend is formed when the current trough price is higher than the preceding trough price.
• A return line downtrend is formed when the current trough price is lower than the preceding trough price.
• A double-bottom is formed when the current trough price is equal to the preceding trough price.
Muti-Part Upper and Lower Trends
• A multi-part return line uptrend begins with the formation of a new return line uptrend, or higher peak, and continues until a new downtrend, or lower peak, completes the trend.
• A multi-part downtrend begins with the formation of a new downtrend, or lower peak, and continues until a new return line uptrend, or higher peak, completes the trend.
• A multi-part uptrend begins with the formation of a new uptrend, or higher trough, and continues until a new return line downtrend, or lower trough, completes the trend.
• A multi-part return line downtrend begins with the formation of a new return line downtrend, or lower trough, and continues until a new uptrend, or higher trough, completes the trend.
Wave Cycles
A wave cycle is here defined as a complete two-part move between a swing high and a swing low, or a swing low and a swing high. The first swing high or swing low will set the course for the sequence of wave cycles that follow; for example a chart that begins with a swing low will form its first complete wave cycle upon the formation of the first complete swing high and vice versa.
Figure 1.
Fibonacci Retracement and Extension Ratios
The Fibonacci sequence is a series of numbers in which each number is the sum of the two preceding numbers, starting with 0 and 1. For example 0 + 1 = 1, 1 + 1 = 2, 1 + 2 = 3, and so on. Ultimately, we could go on forever but the first few numbers in the sequence are as follows: 0 , 1, 1, 2, 3, 5, 8, 13, 21, 34, 55, 89, 144.
The extension ratios are calculated by dividing each number in the sequence by the number preceding it. For example 0/1 = 0, 1/1 = 1, 2/1 = 2, 3/2 = 1.5, 5/3 = 1.6666..., 8/5 = 1.6, 13/8 = 1.625, 21/13 = 1.6153..., 34/21 = 1.6190..., 55/34 = 1.6176..., 89/55 = 1.6181..., 144/89 = 1.6179..., and so on. The retracement ratios are calculated by inverting this process and dividing each number in the sequence by the number proceeding it. For example 0/1 = 0, 1/1 = 1, 1/2 = 0.5, 2/3 = 0.666..., 3/5 = 0.6, 5/8 = 0.625, 8/13 = 0.6153..., 13/21 = 0.6190..., 21/34 = 0.6176..., 34/55 = 0.6181..., 55/89 = 0.6179..., 89/144 = 0.6180..., and so on.
1.618 is considered to be the 'golden ratio', found in many natural phenomena such as the growth of seashells and the branching of trees. Some now speculate the universe oscillates at a frequency of 0,618 Hz, which could help to explain such phenomena, but this theory has yet to be proven.
Traders and analysts use Fibonacci retracement and extension indicators, consisting of horizontal lines representing different Fibonacci ratios, for identifying potential levels of support and resistance. Fibonacci ranges are typically drawn from left to right, with retracement levels representing ratios inside of the current range and extension levels representing ratios extended outside of the current range. If the current wave cycle ends on a swing low, the Fibonacci range is drawn from peak to trough. If the current wave cycle ends on a swing high the Fibonacci range is drawn from trough to peak.
Harmonic Patterns
The concept of harmonic patterns in trading was first introduced by H.M. Gartley in his book "Profits in the Stock Market", published in 1935. Gartley observed that markets have a tendency to move in repetitive patterns, and he identified several specific patterns that he believed could be used to predict future price movements.
Since then, many other traders and analysts have built upon Gartley's work and developed their own variations of harmonic patterns. One such contributor is Larry Pesavento, who developed his own methods for measuring harmonic patterns using Fibonacci ratios. Pesavento has written several books on the subject of harmonic patterns and Fibonacci ratios in trading. Another notable contributor to harmonic patterns is Scott Carney, who developed his own approach to harmonic trading in the late 1990s and also popularised the use of Fibonacci ratios to measure harmonic patterns. Carney expanded on Gartley's work and also introduced several new harmonic patterns, such as the Shark pattern and the 5-0 pattern.
The bullish and bearish Gartley patterns are the oldest recognized harmonic patterns in trading and all the other harmonic patterns are ultimately modifications of the original Gartley patterns. Gartley patterns are fundamentally composed of 5 points, or 4 waves.
Bullish and Bearish Bat Patterns
• Bullish bat patterns are fundamentally composed of three troughs and two peaks, with the second peak being lower than the first peak and the third trough being lower than the second but higher than the first.
• Bearish bat patterns are fundamentally composed of three peaks and two troughs, with the second trough being higher than the first trough and the third peak being higher than the second but lower than the first.
The most commonly recognised ratio measurements used by traders today are as follows:
• Wave 1 of the pattern, generally referred to as XA, has no specific ratio requirements.
• Wave 2 of the pattern, generally referred to as AB, should retrace by at least 38.2%, but no further than 50.0% of the range set by wave 1.
• Wave 3 of the pattern, generally referred to as BC, should retrace by at least 38.2%, but no further than 88.6% of the range set by wave 2.
• Wave 4 of the pattern, generally referred to as CD, should extend to at least 161.8%, but no further than 261.8% of the range set by wave 3.
• The last measure, generally referred to as AD, is that of wave 4 as a ratio of the range set by wave 1, which should retrace to 88.6%.
Measurement Tolerances
In general, tolerance in measurements refers to the allowable variation or deviation from a specific value or dimension. It is the range within which a particular measurement is considered to be acceptable or accurate. In this script I have applied this concept to the measurement of harmonic pattern ratios to increase to the frequency of pattern occurrences.
For example, the AB measurement of Gartley patterns is generally set at around 61.8%, but with such specificity in the measuring requirements the patterns are very rare. We can increase the frequency of pattern occurrences by setting a tolerance. A tolerance of 10% to both downside and upside, which is the default setting for all tolerances, means we would have a tolerable measurement range between 51.8-71.8%, thus increasing the frequency of occurrence.
█ FEATURES
Inputs
• AB Lower Tolerance
• AB Upper Tolerance
• BC Lower Tolerance
• BC Upper Tolerance
• CD Lower Tolerance
• CD Upper Tolerance
• AD Lower Tolerance
• AD Upper Tolerance
• Pattern Color
• Label Color
• Show Projections
• Extend Current Projection Lines
█ LIMITATIONS
All green and red candle calculations are based on differences between open and close prices, as such I have made no attempt to account for green candles that gap lower and close below the close price of the preceding candle, or red candles that gap higher and close above the close price of the preceding candle. This may cause some unexpected behaviour on some markets and timeframes. I can only recommend using 24-hour markets, if and where possible, as there are far fewer gaps and, generally, more data to work with.

Bullish Bat Harmonic Patterns [theEccentricTrader]█ OVERVIEW
This indicator automatically draws bullish bat harmonic patterns and price projections derived from the ranges that constitute the patterns.
█ CONCEPTS
Green and Red Candles
• A green candle is one that closes with a close price equal to or above the price it opened.
• A red candle is one that closes with a close price that is lower than the price it opened.
Swing Highs and Swing Lows
• A swing high is a green candle or series of consecutive green candles followed by a single red candle to complete the swing and form the peak.
• A swing low is a red candle or series of consecutive red candles followed by a single green candle to complete the swing and form the trough.
Peak and Trough Prices (Basic)
• The peak price of a complete swing high is the high price of either the red candle that completes the swing high or the high price of the preceding green candle, depending on which is higher.
• The trough price of a complete swing low is the low price of either the green candle that completes the swing low or the low price of the preceding red candle, depending on which is lower.
Historic Peaks and Troughs
The current, or most recent, peak and trough occurrences are referred to as occurrence zero. Previous peak and trough occurrences are referred to as historic and ordered numerically from right to left, with the most recent historic peak and trough occurrences being occurrence one.
Range
The range is simply the difference between the current peak and current trough prices, generally expressed in terms of points or pips.
Support and Resistance
• Support refers to a price level where the demand for an asset is strong enough to prevent the price from falling further.
• Resistance refers to a price level where the supply of an asset is strong enough to prevent the price from rising further.
Support and resistance levels are important because they can help traders identify where the price of an asset might pause or reverse its direction, offering potential entry and exit points. For example, a trader might look to buy an asset when it approaches a support level , with the expectation that the price will bounce back up. Alternatively, a trader might look to sell an asset when it approaches a resistance level , with the expectation that the price will drop back down.
It's important to note that support and resistance levels are not always relevant, and the price of an asset can also break through these levels and continue moving in the same direction.
Upper Trends
• A return line uptrend is formed when the current peak price is higher than the preceding peak price.
• A downtrend is formed when the current peak price is lower than the preceding peak price.
• A double-top is formed when the current peak price is equal to the preceding peak price.
Lower Trends
• An uptrend is formed when the current trough price is higher than the preceding trough price.
• A return line downtrend is formed when the current trough price is lower than the preceding trough price.
• A double-bottom is formed when the current trough price is equal to the preceding trough price.
Muti-Part Upper and Lower Trends
• A multi-part return line uptrend begins with the formation of a new return line uptrend, or higher peak, and continues until a new downtrend, or lower peak, completes the trend.
• A multi-part downtrend begins with the formation of a new downtrend, or lower peak, and continues until a new return line uptrend, or higher peak, completes the trend.
• A multi-part uptrend begins with the formation of a new uptrend, or higher trough, and continues until a new return line downtrend, or lower trough, completes the trend.
• A multi-part return line downtrend begins with the formation of a new return line downtrend, or lower trough, and continues until a new uptrend, or higher trough, completes the trend.
Wave Cycles
A wave cycle is here defined as a complete two-part move between a swing high and a swing low, or a swing low and a swing high. The first swing high or swing low will set the course for the sequence of wave cycles that follow; for example a chart that begins with a swing low will form its first complete wave cycle upon the formation of the first complete swing high and vice versa.
Figure 1.
Fibonacci Retracement and Extension Ratios
The Fibonacci sequence is a series of numbers in which each number is the sum of the two preceding numbers, starting with 0 and 1. For example 0 + 1 = 1, 1 + 1 = 2, 1 + 2 = 3, and so on. Ultimately, we could go on forever but the first few numbers in the sequence are as follows: 0 , 1, 1, 2, 3, 5, 8, 13, 21, 34, 55, 89, 144.
The extension ratios are calculated by dividing each number in the sequence by the number preceding it. For example 0/1 = 0, 1/1 = 1, 2/1 = 2, 3/2 = 1.5, 5/3 = 1.6666..., 8/5 = 1.6, 13/8 = 1.625, 21/13 = 1.6153..., 34/21 = 1.6190..., 55/34 = 1.6176..., 89/55 = 1.6181..., 144/89 = 1.6179..., and so on. The retracement ratios are calculated by inverting this process and dividing each number in the sequence by the number proceeding it. For example 0/1 = 0, 1/1 = 1, 1/2 = 0.5, 2/3 = 0.666..., 3/5 = 0.6, 5/8 = 0.625, 8/13 = 0.6153..., 13/21 = 0.6190..., 21/34 = 0.6176..., 34/55 = 0.6181..., 55/89 = 0.6179..., 89/144 = 0.6180..., and so on.
1.618 is considered to be the 'golden ratio', found in many natural phenomena such as the growth of seashells and the branching of trees. Some now speculate the universe oscillates at a frequency of 0,618 Hz, which could help to explain such phenomena, but this theory has yet to be proven.
Traders and analysts use Fibonacci retracement and extension indicators, consisting of horizontal lines representing different Fibonacci ratios, for identifying potential levels of support and resistance. Fibonacci ranges are typically drawn from left to right, with retracement levels representing ratios inside of the current range and extension levels representing ratios extended outside of the current range. If the current wave cycle ends on a swing low, the Fibonacci range is drawn from peak to trough. If the current wave cycle ends on a swing high the Fibonacci range is drawn from trough to peak.
Harmonic Patterns
The concept of harmonic patterns in trading was first introduced by H.M. Gartley in his book "Profits in the Stock Market", published in 1935. Gartley observed that markets have a tendency to move in repetitive patterns, and he identified several specific patterns that he believed could be used to predict future price movements.
Since then, many other traders and analysts have built upon Gartley's work and developed their own variations of harmonic patterns. One such contributor is Larry Pesavento, who developed his own methods for measuring harmonic patterns using Fibonacci ratios. Pesavento has written several books on the subject of harmonic patterns and Fibonacci ratios in trading. Another notable contributor to harmonic patterns is Scott Carney, who developed his own approach to harmonic trading in the late 1990s and also popularised the use of Fibonacci ratios to measure harmonic patterns. Carney expanded on Gartley's work and also introduced several new harmonic patterns, such as the Shark pattern and the 5-0 pattern.
The bullish and bearish Gartley patterns are the oldest recognized harmonic patterns in trading and all the other harmonic patterns are ultimately modifications of the original Gartley patterns. Gartley patterns are fundamentally composed of 5 points, or 4 waves.
Bullish and Bearish Bat Patterns
• Bullish bat patterns are fundamentally composed of three troughs and two peaks, with the second peak being lower than the first peak and the third trough being lower than the second but higher than the first.
• Bearish bat patterns are fundamentally composed of three peaks and two troughs, with the second trough being higher than the first trough and the third peak being higher than the second but lower than the first.
The most commonly recognised ratio measurements used by traders today are as follows:
• Wave 1 of the pattern, generally referred to as XA, has no specific ratio requirements.
• Wave 2 of the pattern, generally referred to as AB, should retrace by at least 38.2%, but no further than 50.0% of the range set by wave 1.
• Wave 3 of the pattern, generally referred to as BC, should retrace by at least 38.2%, but no further than 88.6% of the range set by wave 2.
• Wave 4 of the pattern, generally referred to as CD, should extend to at least 161.8%, but no further than 261.8% of the range set by wave 3.
• The last measure, generally referred to as AD, is that of wave 4 as a ratio of the range set by wave 1, which should retrace to 88.6%.
Measurement Tolerances
In general, tolerance in measurements refers to the allowable variation or deviation from a specific value or dimension. It is the range within which a particular measurement is considered to be acceptable or accurate. In this script I have applied this concept to the measurement of harmonic pattern ratios to increase to the frequency of pattern occurrences.
For example, the AB measurement of Gartley patterns is generally set at around 61.8%, but with such specificity in the measuring requirements the patterns are very rare. We can increase the frequency of pattern occurrences by setting a tolerance. A tolerance of 10% to both downside and upside, which is the default setting for all tolerances, means we would have a tolerable measurement range between 51.8-71.8%, thus increasing the frequency of occurrence.
█ FEATURES
Inputs
• AB Lower Tolerance
• AB Upper Tolerance
• BC Lower Tolerance
• BC Upper Tolerance
• CD Lower Tolerance
• CD Upper Tolerance
• AD Lower Tolerance
• AD Upper Tolerance
• Pattern Color
• Label Color
• Show Projections
• Extend Current Projection Lines
█ LIMITATIONS
All green and red candle calculations are based on differences between open and close prices, as such I have made no attempt to account for green candles that gap lower and close below the close price of the preceding candle, or red candles that gap higher and close above the close price of the preceding candle. This may cause some unexpected behaviour on some markets and timeframes. I can only recommend using 24-hour markets, if and where possible, as there are far fewer gaps and, generally, more data to work with.

Bearish Gartley Harmonic Patterns [theEccentricTrader]█ OVERVIEW
This indicator automatically draws bearish Gartley harmonic patterns and price projections derived from the ranges that constitute the patterns.
█ CONCEPTS
Green and Red Candles
• A green candle is one that closes with a close price equal to or above the price it opened.
• A red candle is one that closes with a close price that is lower than the price it opened.
Swing Highs and Swing Lows
• A swing high is a green candle or series of consecutive green candles followed by a single red candle to complete the swing and form the peak.
• A swing low is a red candle or series of consecutive red candles followed by a single green candle to complete the swing and form the trough.
Peak and Trough Prices (Basic)
• The peak price of a complete swing high is the high price of either the red candle that completes the swing high or the high price of the preceding green candle, depending on which is higher.
• The trough price of a complete swing low is the low price of either the green candle that completes the swing low or the low price of the preceding red candle, depending on which is lower.
Historic Peaks and Troughs
The current, or most recent, peak and trough occurrences are referred to as occurrence zero. Previous peak and trough occurrences are referred to as historic and ordered numerically from right to left, with the most recent historic peak and trough occurrences being occurrence one.
Range
The range is simply the difference between the current peak and current trough prices, generally expressed in terms of points or pips.
Support and Resistance
• Support refers to a price level where the demand for an asset is strong enough to prevent the price from falling further.
• Resistance refers to a price level where the supply of an asset is strong enough to prevent the price from rising further.
Support and resistance levels are important because they can help traders identify where the price of an asset might pause or reverse its direction, offering potential entry and exit points. For example, a trader might look to buy an asset when it approaches a support level , with the expectation that the price will bounce back up. Alternatively, a trader might look to sell an asset when it approaches a resistance level , with the expectation that the price will drop back down.
It's important to note that support and resistance levels are not always relevant, and the price of an asset can also break through these levels and continue moving in the same direction.
Upper Trends
• A return line uptrend is formed when the current peak price is higher than the preceding peak price.
• A downtrend is formed when the current peak price is lower than the preceding peak price.
• A double-top is formed when the current peak price is equal to the preceding peak price.
Lower Trends
• An uptrend is formed when the current trough price is higher than the preceding trough price.
• A return line downtrend is formed when the current trough price is lower than the preceding trough price.
• A double-bottom is formed when the current trough price is equal to the preceding trough price.
Muti-Part Upper and Lower Trends
• A multi-part return line uptrend begins with the formation of a new return line uptrend, or higher peak, and continues until a new downtrend, or lower peak, completes the trend.
• A multi-part downtrend begins with the formation of a new downtrend, or lower peak, and continues until a new return line uptrend, or higher peak, completes the trend.
• A multi-part uptrend begins with the formation of a new uptrend, or higher trough, and continues until a new return line downtrend, or lower trough, completes the trend.
• A multi-part return line downtrend begins with the formation of a new return line downtrend, or lower trough, and continues until a new uptrend, or higher trough, completes the trend.
Wave Cycles
A wave cycle is here defined as a complete two-part move between a swing high and a swing low, or a swing low and a swing high. The first swing high or swing low will set the course for the sequence of wave cycles that follow; for example a chart that begins with a swing low will form its first complete wave cycle upon the formation of the first complete swing high and vice versa.
Figure 1.
Fibonacci Retracement and Extension Ratios
The Fibonacci sequence is a series of numbers in which each number is the sum of the two preceding numbers, starting with 0 and 1. For example 0 + 1 = 1, 1 + 1 = 2, 1 + 2 = 3, and so on. Ultimately, we could go on forever but the first few numbers in the sequence are as follows: 0 , 1, 1, 2, 3, 5, 8, 13, 21, 34, 55, 89, 144.
The extension ratios are calculated by dividing each number in the sequence by the number preceding it. For example 0/1 = 0, 1/1 = 1, 2/1 = 2, 3/2 = 1.5, 5/3 = 1.6666..., 8/5 = 1.6, 13/8 = 1.625, 21/13 = 1.6153..., 34/21 = 1.6190..., 55/34 = 1.6176..., 89/55 = 1.6181..., 144/89 = 1.6179..., and so on. The retracement ratios are calculated by inverting this process and dividing each number in the sequence by the number proceeding it. For example 0/1 = 0, 1/1 = 1, 1/2 = 0.5, 2/3 = 0.666..., 3/5 = 0.6, 5/8 = 0.625, 8/13 = 0.6153..., 13/21 = 0.6190..., 21/34 = 0.6176..., 34/55 = 0.6181..., 55/89 = 0.6179..., 89/144 = 0.6180..., and so on.
1.618 is considered to be the 'golden ratio', found in many natural phenomena such as the growth of seashells and the branching of trees. Some now speculate the universe oscillates at a frequency of 0,618 Hz, which could help to explain such phenomena, but this theory has yet to be proven.
Traders and analysts use Fibonacci retracement and extension indicators, consisting of horizontal lines representing different Fibonacci ratios, for identifying potential levels of support and resistance. Fibonacci ranges are typically drawn from left to right, with retracement levels representing ratios inside of the current range and extension levels representing ratios extended outside of the current range. If the current wave cycle ends on a swing low, the Fibonacci range is drawn from peak to trough. If the current wave cycle ends on a swing high the Fibonacci range is drawn from trough to peak.
Harmonic Patterns
The concept of harmonic patterns in trading was first introduced by H.M. Gartley in his book "Profits in the Stock Market", published in 1935. Gartley observed that markets have a tendency to move in repetitive patterns, and he identified several specific patterns that he believed could be used to predict future price movements. The bullish and bearish Gartley patterns are the oldest recognized harmonic patterns in trading and all the other harmonic patterns are modifications of the original Gartley patterns. Gartley patterns are fundamentally composed of 5 points, or 4 waves.
Since then, many other traders and analysts have built upon Gartley's work and developed their own variations of harmonic patterns. One such contributor is Larry Pesavento, who developed his own methods for measuring harmonic patterns using Fibonacci ratios. Pesavento has written several books on the subject of harmonic patterns and Fibonacci ratios in trading. Another notable contributor to harmonic patterns is Scott Carney, who developed his own approach to harmonic trading in the late 1990s and also popularised the use of Fibonacci ratios to measure harmonic patterns. Carney expanded on Gartley's work and also introduced several new harmonic patterns, such as the Shark pattern and the 5-0 pattern.
Bullish and Bearish Gartley Patterns
• Bullish Gartley patterns are fundamentally composed of three troughs and two peaks, with the second peak being lower than the first peak and the third trough being lower than the second but higher than the first.
• Bearish Gartley patterns are fundamentally composed of three peaks and two troughs, with the second trough being higher than the first trough and the third peak being higher than the second but lower than the first.
The most commonly recognised ratio measurements used by traders today are as follows:
• Wave 1 of the pattern, generally referred to as XA, has no specific ratio requirements.
• Wave 2 of the pattern, generally referred to as AB, should retrace to 61.8% of the range set by wave 1.
• Wave 3 of the pattern, generally referred to as BC, should retrace by at least 38.2%, but no further than 88.6% of the range set by wave 2.
• Wave 4 of the pattern, generally referred to as CD, should extend to at least 127.2%, but no further than 161.8% of the range set by wave 3.
• The last measure, generally referred to as AD, is that of wave 4 as a ratio of the range set by wave 1, which should retrace to 78.6%.
Measurement Tolerances
In general, tolerance in measurements refers to the allowable variation or deviation from a specific value or dimension. It is the range within which a particular measurement is considered to be acceptable or accurate. In this script I have introduced the concept of measurement tolerances to harmonic pattern identification.
For example, the AB measurement of Gartley patterns is generally set at around 61.8%, but with such specificity in the measuring requirements the patterns are very rare. We can increase the frequency of pattern occurrences by setting a tolerance. A tolerance of 10% to both downside and upside, for example, means we would have a tolerable measurement range between 51.8-71.8%, thus increasing the frequency of occurrence.
█ FEATURES
Inputs
• AB Lower Tolerance
• AB Upper Tolerance
• BC Lower Tolerance
• BC Upper Tolerance
• CD Lower Tolerance
• CD Upper Tolerance
• AD Lower Tolerance
• AD Upper Tolerance
• Pattern Color
• Label Color
• Show Projections
• Extend Current Projection Lines
█ LIMITATIONS
All green and red candle calculations are based on differences between open and close prices, as such I have made no attempt to account for green candles that gap lower and close below the close price of the preceding candle, or red candles that gap higher and close above the close price of the preceding candle. This may cause some unexpected behaviour on some markets and timeframes. I can only recommend using 24-hour markets, if and where possible, as there are far fewer gaps and, generally, more data to work with.
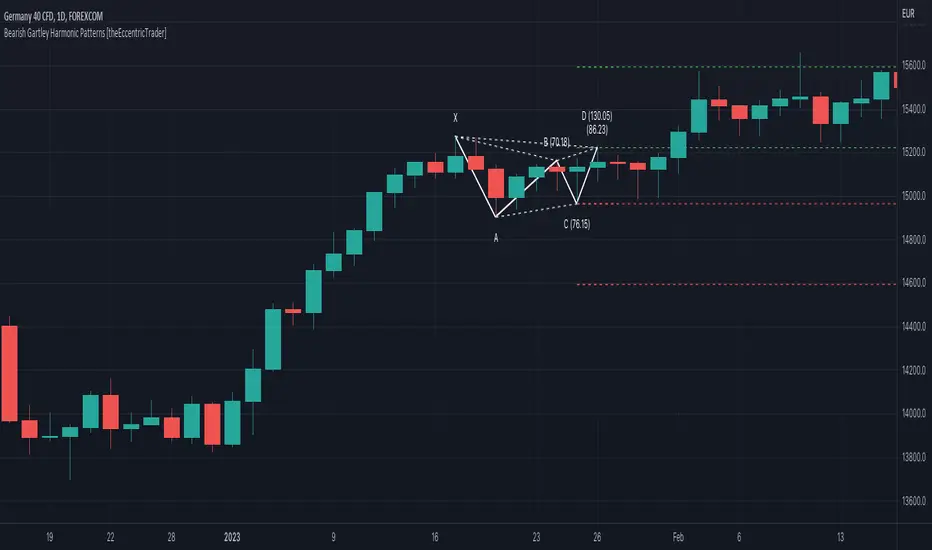
Bullish Gartley Harmonic Patterns [theEccentricTrader]█ OVERVIEW
This indicator automatically draws bullish Gartley harmonic patterns and price projections derived from the ranges that constitute the patterns.
█ CONCEPTS
Green and Red Candles
• A green candle is one that closes with a close price equal to or above the price it opened.
• A red candle is one that closes with a close price that is lower than the price it opened.
Swing Highs and Swing Lows
• A swing high is a green candle or series of consecutive green candles followed by a single red candle to complete the swing and form the peak.
• A swing low is a red candle or series of consecutive red candles followed by a single green candle to complete the swing and form the trough.
Peak and Trough Prices (Basic)
• The peak price of a complete swing high is the high price of either the red candle that completes the swing high or the high price of the preceding green candle, depending on which is higher.
• The trough price of a complete swing low is the low price of either the green candle that completes the swing low or the low price of the preceding red candle, depending on which is lower.
Historic Peaks and Troughs
The current, or most recent, peak and trough occurrences are referred to as occurrence zero. Previous peak and trough occurrences are referred to as historic and ordered numerically from right to left, with the most recent historic peak and trough occurrences being occurrence one.
Range
The range is simply the difference between the current peak and current trough prices, generally expressed in terms of points or pips.
Support and Resistance
• Support refers to a price level where the demand for an asset is strong enough to prevent the price from falling further.
• Resistance refers to a price level where the supply of an asset is strong enough to prevent the price from rising further.
Support and resistance levels are important because they can help traders identify where the price of an asset might pause or reverse its direction, offering potential entry and exit points. For example, a trader might look to buy an asset when it approaches a support level , with the expectation that the price will bounce back up. Alternatively, a trader might look to sell an asset when it approaches a resistance level , with the expectation that the price will drop back down.
It's important to note that support and resistance levels are not always relevant, and the price of an asset can also break through these levels and continue moving in the same direction.
Upper Trends
• A return line uptrend is formed when the current peak price is higher than the preceding peak price.
• A downtrend is formed when the current peak price is lower than the preceding peak price.
• A double-top is formed when the current peak price is equal to the preceding peak price.
Lower Trends
• An uptrend is formed when the current trough price is higher than the preceding trough price.
• A return line downtrend is formed when the current trough price is lower than the preceding trough price.
• A double-bottom is formed when the current trough price is equal to the preceding trough price.
Muti-Part Upper and Lower Trends
• A multi-part return line uptrend begins with the formation of a new return line uptrend, or higher peak, and continues until a new downtrend, or lower peak, completes the trend.
• A multi-part downtrend begins with the formation of a new downtrend, or lower peak, and continues until a new return line uptrend, or higher peak, completes the trend.
• A multi-part uptrend begins with the formation of a new uptrend, or higher trough, and continues until a new return line downtrend, or lower trough, completes the trend.
• A multi-part return line downtrend begins with the formation of a new return line downtrend, or lower trough, and continues until a new uptrend, or higher trough, completes the trend.
Wave Cycles
A wave cycle is here defined as a complete two-part move between a swing high and a swing low, or a swing low and a swing high. The first swing high or swing low will set the course for the sequence of wave cycles that follow; for example a chart that begins with a swing low will form its first complete wave cycle upon the formation of the first complete swing high and vice versa.
Figure 1.
Fibonacci Retracement and Extension Ratios
The Fibonacci sequence is a series of numbers in which each number is the sum of the two preceding numbers, starting with 0 and 1. For example 0 + 1 = 1, 1 + 1 = 2, 1 + 2 = 3, and so on. Ultimately, we could go on forever but the first few numbers in the sequence are as follows: 0 , 1, 1, 2, 3, 5, 8, 13, 21, 34, 55, 89, 144.
The extension ratios are calculated by dividing each number in the sequence by the number preceding it. For example 0/1 = 0, 1/1 = 1, 2/1 = 2, 3/2 = 1.5, 5/3 = 1.6666..., 8/5 = 1.6, 13/8 = 1.625, 21/13 = 1.6153..., 34/21 = 1.6190..., 55/34 = 1.6176..., 89/55 = 1.6181..., 144/89 = 1.6179..., and so on. The retracement ratios are calculated by inverting this process and dividing each number in the sequence by the number proceeding it. For example 0/1 = 0, 1/1 = 1, 1/2 = 0.5, 2/3 = 0.666..., 3/5 = 0.6, 5/8 = 0.625, 8/13 = 0.6153..., 13/21 = 0.6190..., 21/34 = 0.6176..., 34/55 = 0.6181..., 55/89 = 0.6179..., 89/144 = 0.6180..., and so on.
1.618 is considered to be the 'golden ratio', found in many natural phenomena such as the growth of seashells and the branching of trees. Some now speculate the universe oscillates at a frequency of 0,618 Hz, which could help to explain such phenomena, but this theory has yet to be proven.
Traders and analysts use Fibonacci retracement and extension indicators, consisting of horizontal lines representing different Fibonacci ratios, for identifying potential levels of support and resistance. Fibonacci ranges are typically drawn from left to right, with retracement levels representing ratios inside of the current range and extension levels representing ratios extended outside of the current range. If the current wave cycle ends on a swing low, the Fibonacci range is drawn from peak to trough. If the current wave cycle ends on a swing high the Fibonacci range is drawn from trough to peak.
Harmonic Patterns
The concept of harmonic patterns in trading was first introduced by H.M. Gartley in his book "Profits in the Stock Market", published in 1935. Gartley observed that markets have a tendency to move in repetitive patterns, and he identified several specific patterns that he believed could be used to predict future price movements. The bullish and bearish Gartley patterns are the oldest recognized harmonic patterns in trading and all the other harmonic patterns are modifications of the original Gartley patterns. Gartley patterns are fundamentally composed of 5 points, or 4 waves.
Since then, many other traders and analysts have built upon Gartley's work and developed their own variations of harmonic patterns. One such contributor is Larry Pesavento, who developed his own methods for measuring harmonic patterns using Fibonacci ratios. Pesavento has written several books on the subject of harmonic patterns and Fibonacci ratios in trading. Another notable contributor to harmonic patterns is Scott Carney, who developed his own approach to harmonic trading in the late 1990s and also popularised the use of Fibonacci ratios to measure harmonic patterns. Carney expanded on Gartley's work and also introduced several new harmonic patterns, such as the Shark pattern and the 5-0 pattern.
Bullish and Bearish Gartley Patterns
• Bullish Gartley patterns are fundamentally composed of three troughs and two peaks, with the second peak being lower than the first peak and the third trough being lower than the second but higher than the first.
• Bearish Gartley patterns are fundamentally composed of three peaks and two troughs, with the second trough being higher than the first trough and the third peak being higher than the second but lower than the first.
The most commonly recognised ratio measurements used by traders today are as follows:
• Wave 1 of the pattern, generally referred to as XA, has no specific ratio requirements.
• Wave 2 of the pattern, generally referred to as AB, should retrace to 61.8% of the range set by wave 1.
• Wave 3 of the pattern, generally referred to as BC, should retrace by at least 38.2%, but no further than 88.6% of the range set by wave 2.
• Wave 4 of the pattern, generally referred to as CD, should extend to at least 127.2%, but no further than 161.8% of the range set by wave 3.
• The last measure, generally referred to as AD, is that of wave 4 as a ratio of the range set by wave 1, which should retrace to 78.6%.
Measurement Tolerances
In general, tolerance in measurements refers to the allowable variation or deviation from a specific value or dimension. It is the range within which a particular measurement is considered to be acceptable or accurate. In this script I have introduced the concept of measurement tolerances to harmonic pattern identification.
For example, the AB measurement of Gartley patterns is generally set at around 61.8%, but with such specificity in the measuring requirements the patterns are very rare. We can increase the frequency of pattern occurrences by setting a tolerance. A tolerance of 10% to both downside and upside, for example, means we would have a tolerable measurement range between 51.8-71.8%, thus increasing the frequency of occurrence.
█ FEATURES
Inputs
• AB Lower Tolerance
• AB Upper Tolerance
• BC Lower Tolerance
• BC Upper Tolerance
• CD Lower Tolerance
• CD Upper Tolerance
• AD Lower Tolerance
• AD Upper Tolerance
• Pattern Color
• Label Color
• Show Projections
• Extend Current Projection Lines
█ LIMITATIONS
All green and red candle calculations are based on differences between open and close prices, as such I have made no attempt to account for green candles that gap lower and close below the close price of the preceding candle, or red candles that gap higher and close above the close price of the preceding candle. This may cause some unexpected behaviour on some markets and timeframes. I can only recommend using 24-hour markets, if and where possible, as there are far fewer gaps and, generally, more data to work with.
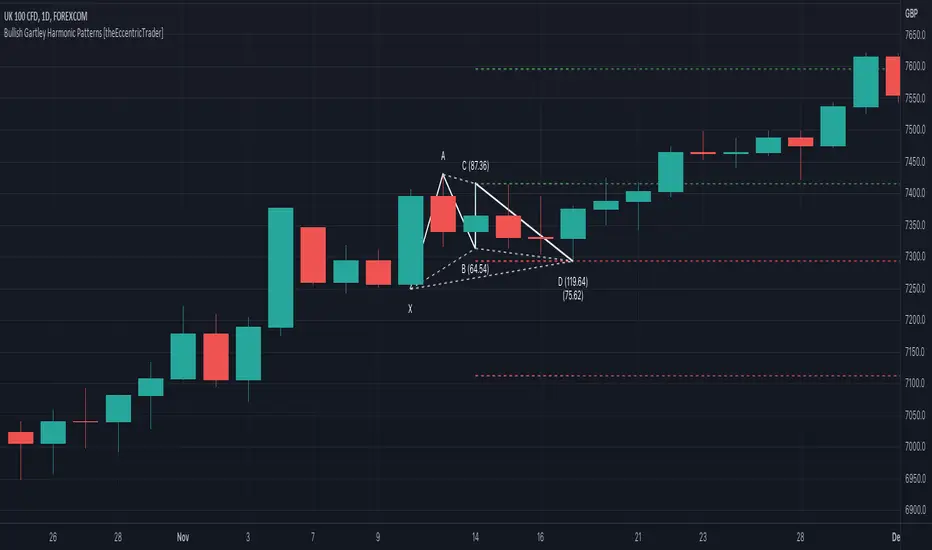
Descending Elliot Wave Patterns [theEccentricTrader]█ OVERVIEW
This indicator automatically draws descending Elliot Wave patterns and price projections derived from the ranges that constitute the patterns.
█ CONCEPTS
Green and Red Candles
• A green candle is one that closes with a close price equal to or above the price it opened.
• A red candle is one that closes with a close price that is lower than the price it opened.
Swing Highs and Swing Lows
• A swing high is a green candle or series of consecutive green candles followed by a single red candle to complete the swing and form the peak.
• A swing low is a red candle or series of consecutive red candles followed by a single green candle to complete the swing and form the trough.
Peak and Trough Prices (Basic)
• The peak price of a complete swing high is the high price of either the red candle that completes the swing high or the high price of the preceding green candle, depending on which is higher.
• The trough price of a complete swing low is the low price of either the green candle that completes the swing low or the low price of the preceding red candle, depending on which is lower.
Historic Peaks and Troughs
The current, or most recent, peak and trough occurrences are referred to as occurrence zero. Previous peak and trough occurrences are referred to as historic and ordered numerically from right to left, with the most recent historic peak and trough occurrences being occurrence one.
Range
The range is simply the difference between the current peak and current trough prices, generally expressed in terms of points or pips.
Support and Resistance
• Support refers to a price level where the demand for an asset is strong enough to prevent the price from falling further.
• Resistance refers to a price level where the supply of an asset is strong enough to prevent the price from rising further.
Support and resistance levels are important because they can help traders identify where the price of an asset might pause or reverse its direction, offering potential entry and exit points. For example, a trader might look to buy an asset when it approaches a support level , with the expectation that the price will bounce back up. Alternatively, a trader might look to sell an asset when it approaches a resistance level , with the expectation that the price will drop back down.
It's important to note that support and resistance levels are not always relevant, and the price of an asset can also break through these levels and continue moving in the same direction.
Upper Trends
• A return line uptrend is formed when the current peak price is higher than the preceding peak price.
• A downtrend is formed when the current peak price is lower than the preceding peak price.
• A double-top is formed when the current peak price is equal to the preceding peak price.
Lower Trends
• An uptrend is formed when the current trough price is higher than the preceding trough price.
• A return line downtrend is formed when the current trough price is lower than the preceding trough price.
• A double-bottom is formed when the current trough price is equal to the preceding trough price.
Muti-Part Upper and Lower Trends
• A multi-part return line uptrend begins with the formation of a new return line uptrend, or higher peak, and continues until a new downtrend, or lower peak, completes the trend.
• A multi-part downtrend begins with the formation of a new downtrend, or lower peak, and continues until a new return line uptrend, or higher peak, completes the trend.
• A multi-part uptrend begins with the formation of a new uptrend, or higher trough, and continues until a new return line downtrend, or lower trough, completes the trend.
• A multi-part return line downtrend begins with the formation of a new return line downtrend, or lower trough, and continues until a new uptrend, or higher trough, completes the trend.
Double Trends
• A double uptrend is formed when the current trough price is higher than the preceding trough price and the current peak price is higher than the preceding peak price.
• A double downtrend is formed when the current peak price is lower than the preceding peak price and the current trough price is lower than the preceding trough price.
Muti-Part Double Trends
• A multi-part double uptrend begins with the formation of a new uptrend that proceeds a new return line uptrend, and continues until a new downtrend or return line downtrend ends the trend.
• A multi-part double downtrend begins with the formation of a new downtrend that proceeds a new return line downtrend, and continues until a new uptrend or return line uptrend ends the trend.
Wave Cycles
A wave cycle is here defined as a complete two-part move between a swing high and a swing low, or a swing low and a swing high. The first swing high or swing low will set the course for the sequence of wave cycles that follow; for example a chart that begins with a swing low will form its first complete wave cycle upon the formation of the first complete swing high and vice versa.
Figure 1.
Fibonacci Retracement and Extension Ratios
The Fibonacci sequence is a series of numbers in which each number is the sum of the two preceding numbers, starting with 0 and 1. For example 0 + 1 = 1, 1 + 1 = 2, 1 + 2 = 3, and so on. Ultimately, we could go on forever but the first few numbers in the sequence are as follows: 0 , 1, 1, 2, 3, 5, 8, 13, 21, 34, 55, 89, 144.
The extension ratios are calculated by dividing each number in the sequence by the number preceding it. For example 0/1 = 0, 1/1 = 1, 2/1 = 2, 3/2 = 1.5, 5/3 = 1.6666..., 8/5 = 1.6, 13/8 = 1.625, 21/13 = 1.6153..., 34/21 = 1.6190..., 55/34 = 1.6176..., 89/55 = 1.6181..., 144/89 = 1.6179..., and so on. The retracement ratios are calculated by inverting this process and dividing each number in the sequence by the number proceeding it. For example 0/1 = 0, 1/1 = 1, 1/2 = 0.5, 2/3 = 0.666..., 3/5 = 0.6, 5/8 = 0.625, 8/13 = 0.6153..., 13/21 = 0.6190..., 21/34 = 0.6176..., 34/55 = 0.6181..., 55/89 = 0.6179..., 89/144 = 0.6180..., and so on.
1.618 is considered to be the 'golden ratio', found in many natural phenomena such as the growth of seashells and the branching of trees. Some now speculate the universe oscillates at a frequency of 0,618 Hz, which could help to explain such phenomena, but this theory has yet to be proven.
Traders and analysts use Fibonacci retracement and extension indicators, consisting of horizontal lines representing different Fibonacci ratios, for identifying potential levels of support and resistance. Fibonacci ranges are typically drawn from left to right, with retracement levels representing ratios inside of the current range and extension levels representing ratios extended outside of the current range. If the current wave cycle ends on a swing low, the Fibonacci range is drawn from peak to trough. If the current wave cycle ends on a swing high the Fibonacci range is drawn from trough to peak.
Elliot Wave Patterns
Ralph Nelson Elliott, authored his book on Elliott wave theory titled "The Wave Principle" in 1938. In this book, Elliott presented his theory of market behaviour, which he believed reflected the natural laws that govern human behaviour.
The Elliott Wave Theory is based on the principle that waves have a tendency to unfold in a specific sequence of five waves in the direction of the trend, followed by three waves leading in the opposite direction. This pattern is called a 5-3 wave pattern and is the foundation of Elliott's theory.
The five waves in the direction of the trend are labelled 1, 2, 3, 4, and 5, while the three waves in the opposite direction are labelled A, B, and C. Waves 1, 3, and 5 are impulse waves, while waves 2 and 4 are corrective waves. Waves A and C are also corrective waves, while wave B is an impulse wave.
According to Elliott, the pattern of waves is fractal in nature, meaning that it occurs on all time frames, from the smallest to the largest.
In Elliott Wave Theory, the distance that waves move from each other depends on the specific market conditions and the amplitude of the waves involved. There is no fixed rule or limit for how far waves should move from each other, however, there are several guidelines to help identify and measure wave distances. One of the most common guidelines is the Fibonacci ratios, which can be used to describe the relationships between wave lengths. For example, Elliott identified that wave 3 is typically the strongest and longest wave, and it tends to be 1.618 times the length of wave 1. Meanwhile, wave 2 tends to retrace between 50% and 78.6% of wave 1, and wave 4 tends to retrace between 38.2% and 78.6% of wave 3.
In general, the patterns are quite rare and the distances that the waves move in relation to one another is subject to interpretation. For such reasons, I have simply included the ratios of the current ranges as ratios of the preceding ranges in the wave labels and it will, ultimately, be up to the user to decide whether or not the patterns qualify as valid.
█ FEATURES
Inputs
• Show Projections
• Pattern Color
• Label Color
• Extend Current Projection Lines
█ LIMITATIONS
All green and red candle calculations are based on differences between open and close prices, as such I have made no attempt to account for green candles that gap lower and close below the close price of the preceding candle, or red candles that gap higher and close above the close price of the preceding candle. This may cause some unexpected behaviour on some markets and timeframes. I can only recommend using 24-hour markets, if and where possible, as there are far fewer gaps and, generally, more data to work with.

Ascending Elliot Wave Patterns [theEccentricTrader]█ OVERVIEW
This indicator automatically draws ascending Elliot Wave patterns and price projections derived from the ranges that constitute the patterns.
█ CONCEPTS
Green and Red Candles
• A green candle is one that closes with a close price equal to or above the price it opened.
• A red candle is one that closes with a close price that is lower than the price it opened.
Swing Highs and Swing Lows
• A swing high is a green candle or series of consecutive green candles followed by a single red candle to complete the swing and form the peak.
• A swing low is a red candle or series of consecutive red candles followed by a single green candle to complete the swing and form the trough.
Peak and Trough Prices (Basic)
• The peak price of a complete swing high is the high price of either the red candle that completes the swing high or the high price of the preceding green candle, depending on which is higher.
• The trough price of a complete swing low is the low price of either the green candle that completes the swing low or the low price of the preceding red candle, depending on which is lower.
Historic Peaks and Troughs
The current, or most recent, peak and trough occurrences are referred to as occurrence zero. Previous peak and trough occurrences are referred to as historic and ordered numerically from right to left, with the most recent historic peak and trough occurrences being occurrence one.
Range
The range is simply the difference between the current peak and current trough prices, generally expressed in terms of points or pips.
Support and Resistance
• Support refers to a price level where the demand for an asset is strong enough to prevent the price from falling further.
• Resistance refers to a price level where the supply of an asset is strong enough to prevent the price from rising further.
Support and resistance levels are important because they can help traders identify where the price of an asset might pause or reverse its direction, offering potential entry and exit points. For example, a trader might look to buy an asset when it approaches a support level , with the expectation that the price will bounce back up. Alternatively, a trader might look to sell an asset when it approaches a resistance level , with the expectation that the price will drop back down.
It's important to note that support and resistance levels are not always relevant, and the price of an asset can also break through these levels and continue moving in the same direction.
Upper Trends
• A return line uptrend is formed when the current peak price is higher than the preceding peak price.
• A downtrend is formed when the current peak price is lower than the preceding peak price.
• A double-top is formed when the current peak price is equal to the preceding peak price.
Lower Trends
• An uptrend is formed when the current trough price is higher than the preceding trough price.
• A return line downtrend is formed when the current trough price is lower than the preceding trough price.
• A double-bottom is formed when the current trough price is equal to the preceding trough price.
Muti-Part Upper and Lower Trends
• A multi-part return line uptrend begins with the formation of a new return line uptrend, or higher peak, and continues until a new downtrend, or lower peak, completes the trend.
• A multi-part downtrend begins with the formation of a new downtrend, or lower peak, and continues until a new return line uptrend, or higher peak, completes the trend.
• A multi-part uptrend begins with the formation of a new uptrend, or higher trough, and continues until a new return line downtrend, or lower trough, completes the trend.
• A multi-part return line downtrend begins with the formation of a new return line downtrend, or lower trough, and continues until a new uptrend, or higher trough, completes the trend.
Double Trends
• A double uptrend is formed when the current trough price is higher than the preceding trough price and the current peak price is higher than the preceding peak price.
• A double downtrend is formed when the current peak price is lower than the preceding peak price and the current trough price is lower than the preceding trough price.
Muti-Part Double Trends
• A multi-part double uptrend begins with the formation of a new uptrend that proceeds a new return line uptrend, and continues until a new downtrend or return line downtrend ends the trend.
• A multi-part double downtrend begins with the formation of a new downtrend that proceeds a new return line downtrend, and continues until a new uptrend or return line uptrend ends the trend.
Wave Cycles
A wave cycle is here defined as a complete two-part move between a swing high and a swing low, or a swing low and a swing high. The first swing high or swing low will set the course for the sequence of wave cycles that follow; for example a chart that begins with a swing low will form its first complete wave cycle upon the formation of the first complete swing high and vice versa.
Figure 1.
Fibonacci Retracement and Extension Ratios
The Fibonacci sequence is a series of numbers in which each number is the sum of the two preceding numbers, starting with 0 and 1. For example 0 + 1 = 1, 1 + 1 = 2, 1 + 2 = 3, and so on. Ultimately, we could go on forever but the first few numbers in the sequence are as follows: 0 , 1, 1, 2, 3, 5, 8, 13, 21, 34, 55, 89, 144.
The extension ratios are calculated by dividing each number in the sequence by the number preceding it. For example 0/1 = 0, 1/1 = 1, 2/1 = 2, 3/2 = 1.5, 5/3 = 1.6666..., 8/5 = 1.6, 13/8 = 1.625, 21/13 = 1.6153..., 34/21 = 1.6190..., 55/34 = 1.6176..., 89/55 = 1.6181..., 144/89 = 1.6179..., and so on. The retracement ratios are calculated by inverting this process and dividing each number in the sequence by the number proceeding it. For example 0/1 = 0, 1/1 = 1, 1/2 = 0.5, 2/3 = 0.666..., 3/5 = 0.6, 5/8 = 0.625, 8/13 = 0.6153..., 13/21 = 0.6190..., 21/34 = 0.6176..., 34/55 = 0.6181..., 55/89 = 0.6179..., 89/144 = 0.6180..., and so on.
1.618 is considered to be the 'golden ratio', found in many natural phenomena such as the growth of seashells and the branching of trees. Some now speculate the universe oscillates at a frequency of 0,618 Hz, which could help to explain such phenomena, but this theory has yet to be proven.
Traders and analysts use Fibonacci retracement and extension indicators, consisting of horizontal lines representing different Fibonacci ratios, for identifying potential levels of support and resistance. Fibonacci ranges are typically drawn from left to right, with retracement levels representing ratios inside of the current range and extension levels representing ratios extended outside of the current range. If the current wave cycle ends on a swing low, the Fibonacci range is drawn from peak to trough. If the current wave cycle ends on a swing high the Fibonacci range is drawn from trough to peak.
Elliot Wave Patterns
Ralph Nelson Elliott, authored his book on Elliott wave theory titled "The Wave Principle" in 1938. In this book, Elliott presented his theory of market behaviour, which he believed reflected the natural laws that govern human behaviour.
The Elliott Wave Theory is based on the principle that waves have a tendency to unfold in a specific sequence of five waves in the direction of the trend, followed by three waves leading in the opposite direction. This pattern is called a 5-3 wave pattern and is the foundation of Elliott's theory.
The five waves in the direction of the trend are labelled 1, 2, 3, 4, and 5, while the three waves in the opposite direction are labelled A, B, and C. Waves 1, 3, and 5 are impulse waves, while waves 2 and 4 are corrective waves. Waves A and C are also corrective waves, while wave B is an impulse wave.
According to Elliott, the pattern of waves is fractal in nature, meaning that it occurs on all time frames, from the smallest to the largest.
In Elliott Wave Theory, the distance that waves move from each other depends on the specific market conditions and the amplitude of the waves involved. There is no fixed rule or limit for how far waves should move from each other, however, there are several guidelines to help identify and measure wave distances. One of the most common guidelines is the Fibonacci ratios, which can be used to describe the relationships between wave lengths. For example, Elliott identified that wave 3 is typically the strongest and longest wave, and it tends to be 1.618 times the length of wave 1. Meanwhile, wave 2 tends to retrace between 50% and 78.6% of wave 1, and wave 4 tends to retrace between 38.2% and 78.6% of wave 3.
In general, the patterns are quite rare and the distances that the waves move in relation to one another is subject to interpretation. For such reasons, I have simply included the ratios of the current ranges as ratios of the preceding ranges in the wave labels and it will, ultimately, be up to the user to decide whether or not the patterns qualify as valid.
█ FEATURES
Inputs
• Show Projections
• Pattern Color
• Label Color
• Extend Current Projection Lines
█ LIMITATIONS
All green and red candle calculations are based on differences between open and close prices, as such I have made no attempt to account for green candles that gap lower and close below the close price of the preceding candle, or red candles that gap higher and close above the close price of the preceding candle. This may cause some unexpected behaviour on some markets and timeframes. I can only recommend using 24-hour markets, if and where possible, as there are far fewer gaps and, generally, more data to work with.
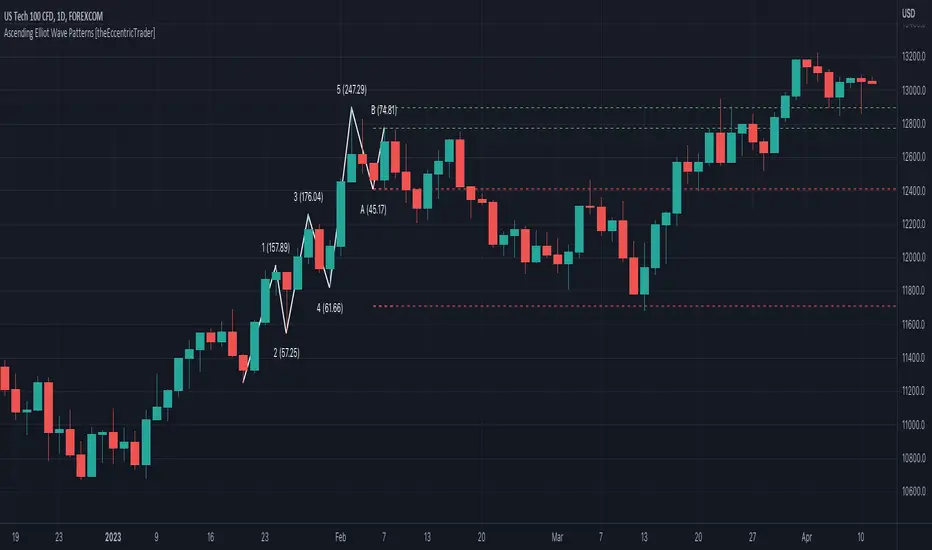
Probability of Candle Close Higher Than OpenThe "Probability of Candle Close Higher Than Open" indicator is designed to help traders assess the likelihood of a given candle closing higher than its open based on the previous candle's price action. It does this by calculating a probability score between 0 and 1 and displaying it on the chart, along with a horizontal line representing a user-defined probability threshold.
The indicator uses three input variables to determine the probability score:
lookback_period: This input defines the number of previous candles to consider when calculating the probability. By default, it is set to 2, meaning the indicator considers the previous two candles.
prev_high and prev_low: These variables are calculated using the highest() and lowest() functions, respectively, and represent the highest high and lowest low of the previous lookback_period candles.
prev_body: This variable calculates the absolute value of the difference between the open and close prices of the previous candle.
The probability score is then calculated based on the following conditions:
If the current candle's open price is higher than the previous lookback_period candles' highest high, the probability score is set to 0.1 (indicating a low probability of the candle closing higher than its open).
If the current candle's open price is lower than the previous lookback_period candles' lowest low, the probability score is set to 0.9 (indicating a high probability of the candle closing higher than its open).
If neither of the above conditions apply, the probability score is calculated using the following formula:
If the previous candle closed higher than its open, the probability score is set to 0.5 plus half of the previous candle's body (i.e., the absolute difference between its open and close prices).
If the previous candle closed lower than its open, the probability score is set to 0.1 plus half of the previous candle's body.
If the previous candle closed at the same price as its open, the probability score is set to 0.1.
Finally, the indicator plots the probability score as a label on the chart and a horizontal line representing the probability threshold.
Disclaimer:
Trading involves significant risk and is not suitable for all investors. The "Probability of Candle Close Higher Than Open" indicator is for informational purposes only and should not be used as the sole basis for making trading decisions. Always conduct your own research and due diligence before entering any trades. No guarantee or warranty is given as to the accuracy or completeness of the information provided by this indicator, and any reliance on this information is at your own risk. Past performance is not necessarily indicative of future results. Trading with margin carries the risk of losing more than your initial investment. Only trade with risk capital that you can afford to lose.

Fibonacci Ratios HTF [theEccentricTrader]█ OVERVIEW
This indicator automatically draws higher timeframe Fibonacci levels from current peak to current trough or current trough to current peak, depending on where the current wave cycle ends. In the example above I have set the higher timeframe resolution to 1-month and applied it to a daily chart.
█ CONCEPTS
Green and Red Candles
• A green candle is one that closes with a high price equal to or above the price it opened.
• A red candle is one that closes with a low price that is lower than the price it opened.
Swing Highs and Swing Lows
• A swing high is a green candle or series of consecutive green candles followed by a single red candle to complete the swing and form the peak.
• A swing low is a red candle or series of consecutive red candles followed by a single green candle to complete the swing and form the trough.
Peak and Trough Prices (Basic)
• The peak price of a complete swing high is the high price of either the red candle that completes the swing high or the high price of the preceding green candle, depending on which is higher.
• The trough price of a complete swing low is the low price of either the green candle that completes the swing low or the low price of the preceding red candle, depending on which is lower.
Historic Peaks and Troughs
The current, or most recent, peak and trough occurrences are referred to as occurrence zero. Previous peak and trough occurrences are referred to as historic and ordered numerically from right to left, with the most recent historic peak and trough occurrences being occurrence one.
Wave Cycles
A wave cycle is here defined as a complete two-part move between a swing high and a swing low, or a swing low and a swing high. The first swing high or swing low will set the course for the sequence of wave cycles that follow; for example a chart that begins with a swing low will form its first complete wave cycle upon the formation of the first complete swing high and vice versa.
Figure 1.
Range
The range is simply the difference between the current peak and current trough prices, generally expressed in terms of points or pips.
Support and Resistance
• Support refers to a price level where the demand for an asset is strong enough to prevent the price from falling further.
• Resistance refers to a price level where the supply of an asset is strong enough to prevent the price from rising further.
Support and resistance levels are important because they can help traders identify where the price of an asset might pause or reverse its direction, offering potential entry and exit points. For example, a trader might look to buy an asset when it approaches a support level , with the expectation that the price will bounce back up. Alternatively, a trader might look to sell an asset when it approaches a resistance level , with the expectation that the price will drop back down.
It's important to note that support and resistance levels are not always relevant, and the price of an asset can also break through these levels and continue moving in the same direction.
Fibonacci Retracement and Extension Ratios
The Fibonacci sequence is a series of numbers in which each number is the sum of the two preceding numbers, starting with 0 and 1. For example 0 + 1 = 1, 1 + 1 = 2, 1 + 2 = 3, and so on. Ultimately, we could go on forever but the first few numbers in the sequence are as follows: 0 , 1, 1, 2, 3, 5, 8, 13, 21, 34, 55, 89, 144.
The extension ratios are calculated by dividing each number in the sequence by the number preceding it. For example 0/1 = 0, 1/1 = 1, 2/1 = 2, 3/2 = 1.5, 5/3 = 1.6666..., 8/5 = 1.6, 13/8 = 1.625, 21/13 = 1.6153..., 34/21 = 1.6190..., 55/34 = 1.6176..., 89/55 = 1.6181..., 144/89 = 1.6179..., and so on. The retracement ratios are calculated by inverting this process and dividing each number in the sequence by the number proceeding it. For example 0/1 = 0, 1/1 = 1, 1/2 = 0.5, 2/3 = 0.666..., 3/5 = 0.6, 5/8 = 0.625, 8/13 = 0.6153..., 13/21 = 0.6190..., 21/34 = 0.6176..., 34/55 = 0.6181..., 55/89 = 0.6179..., 89/144 = 0.6180..., and so on.
1.618 is considered to be the 'golden ratio', found in many natural phenomena such as the growth of seashells and the branching of trees. Some now speculate the universe oscillates at a frequency of 0,618 Hz, which could help to explain such phenomena, but this theory has yet to be proven.
Traders and analysts use Fibonacci retracement and extension indicators, consisting of horizontal lines representing different Fibonacci ratios, for identifying potential levels of support and resistance. Fibonacci ranges are typically drawn from left to right, with retracement levels representing ratios inside of the current range and extension levels representing ratios extended outside of the current range. If the current wave cycle ends on a swing low, the Fibonacci range is drawn from peak to trough. If the current wave cycle ends on a swing high the Fibonacci range is drawn from trough to peak.
Although there is some contention over which popular levels are and are not actually Fibonacci ratios, such as 50% and 100%, in this script I have based my retracement level calculations on the ratios of 23.6%, 38.2%, 50%, 61.8%, 78.6% and 100%. And my extension level calculations on the ratios of 161.8%, 261.8%, 361.8%, 423.6% and 461.8%.
█ FEATURES
Inputs
• HTF Resolution
• Show Fibonacci Extensions
• 00.0% Line Color
• 23.6% Line Color
• 38.2% Line Color
• 50.0% Line Color
• 61.8% Line Color
• 78.6% Line Color
• 100.0% Line Color
• 161.8% Line Color
• 261.8% Line Color
• 361.8% Line Color
• 423.6% Line Color
• 461.8% Line Color
• Extend Line Type
• Show Labels
• Label Colors
█ LIMITATIONS
All green and red candle calculations are based on differences between open and close prices, as such I have made no attempt to account for green candles that gap lower and close below the close price of the preceding candle, or red candles that gap higher and close above the close price of the preceding candle. This may cause some unexpected behaviour on some markets and timeframes. I can only recommend using 24-hour markets, if and where possible, as there are far fewer gaps and, generally, more data to work with.
Similarly, if the current timeframe is not a factor of the higher timeframe there will be occasions when the left hand offset is out by a couple of bars. This is because the calculations are ultimately based on how many lower timeframe bars there are inside a sequence of higher timeframe bars. The indicator will also behave unexpectedly if the higher timeframe resolution is lower than the current timeframe, but that should be expected.
If the lines do not draw or you see a study error saying that the script references too many candles in history, this is most likely because the higher timeframe anchor point is not present on the current timeframe. This problem usually occurs when referencing a higher timeframe, such as the 1-month, from a much lower timeframe, such as the 1-minute. How far you can lookback for higher timeframe anchor points on the current timeframe will also be limited by your Trading View subscription plan. Premium users get 20,000 candles worth of data, pro+ and pro users get 10,000, and basic users get 5,000.
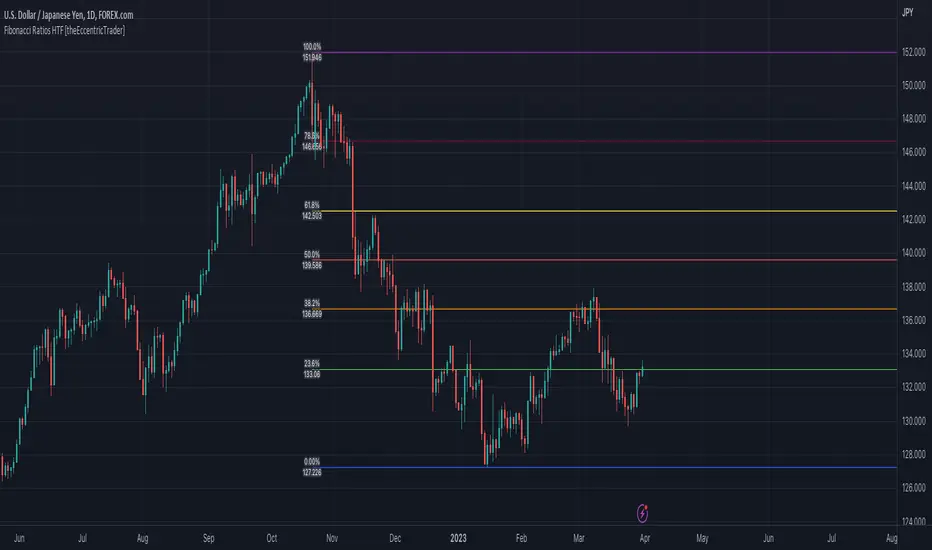
Fibonacci Ratios [theEccentricTrader]█ OVERVIEW
This indicator automatically draws Fibonacci levels from current peak to current trough or current trough to current peak, depending on where the current wave cycle ends.
█ CONCEPTS
Green and Red Candles
• A green candle is one that closes with a high price equal to or above the price it opened.
• A red candle is one that closes with a low price that is lower than the price it opened.
Swing Highs and Swing Lows
• A swing high is a green candle or series of consecutive green candles followed by a single red candle to complete the swing and form the peak.
• A swing low is a red candle or series of consecutive red candles followed by a single green candle to complete the swing and form the trough.
Peak and Trough Prices (Basic)
• The peak price of a complete swing high is the high price of either the red candle that completes the swing high or the high price of the preceding green candle, depending on which is higher.
• The trough price of a complete swing low is the low price of either the green candle that completes the swing low or the low price of the preceding red candle, depending on which is lower.
Historic Peaks and Troughs
The current, or most recent, peak and trough occurrences are referred to as occurrence zero. Previous peak and trough occurrences are referred to as historic and ordered numerically from right to left, with the most recent historic peak and trough occurrences being occurrence one.
Wave Cycles
A wave cycle is here defined as a complete two-part move between a swing high and a swing low, or a swing low and a swing high. The first swing high or swing low will set the course for the sequence of wave cycles that follow; for example a chart that begins with a swing low will form its first complete wave cycle upon the formation of the first complete swing high and vice versa.
Figure 1.
Range
The range is simply the difference between the current peak and current trough prices, generally expressed in terms of points or pips.
Support and Resistance
• Support refers to a price level where the demand for an asset is strong enough to prevent the price from falling further.
• Resistance refers to a price level where the supply of an asset is strong enough to prevent the price from rising further.
Support and resistance levels are important because they can help traders identify where the price of an asset might pause or reverse its direction, offering potential entry and exit points. For example, a trader might look to buy an asset when it approaches a support level , with the expectation that the price will bounce back up. Alternatively, a trader might look to sell an asset when it approaches a resistance level , with the expectation that the price will drop back down.
It's important to note that support and resistance levels are not always relevant, and the price of an asset can also break through these levels and continue moving in the same direction.
Fibonacci Retracement and Extension Ratios
The Fibonacci sequence is a series of numbers in which each number is the sum of the two preceding numbers, starting with 0 and 1. For example 0 + 1 = 1, 1 + 1 = 2, 1 + 2 = 3, and so on. Ultimately, we could go on forever but the first few numbers in the sequence are as follows: 0 , 1, 1, 2, 3, 5, 8, 13, 21, 34, 55, 89, 144.
The extension ratios are calculated by dividing each number in the sequence by the number preceding it. For example 0/1 = 0, 1/1 = 1, 2/1 = 2, 3/2 = 1.5, 5/3 = 1.6666..., 8/5 = 1.6, 13/8 = 1.625, 21/13 = 1.6153..., 34/21 = 1.6190..., 55/34 = 1.6176..., 89/55 = 1.6181..., 144/89 = 1.6179..., and so on. The retracement ratios are calculated by inverting this process and dividing each number in the sequence by the number proceeding it. For example 0/1 = 0, 1/1 = 1, 1/2 = 0.5, 2/3 = 0.666..., 3/5 = 0.6, 5/8 = 0.625, 8/13 = 0.6153..., 13/21 = 0.6190..., 21/34 = 0.6176..., 34/55 = 0.6181..., 55/89 = 0.6179..., 89/144 = 0.6180..., and so on.
1.618 is considered to be the 'golden ratio', found in many natural phenomena such as the growth of seashells and the branching of trees. Some now speculate the universe oscillates at a frequency of 0,618 Hz, which could help to explain such phenomena, but this theory has yet to be proven.
Traders and analysts use Fibonacci retracement and extension indicators, consisting of horizontal lines representing different Fibonacci ratios, for identifying potential levels of support and resistance. Fibonacci ranges are typically drawn from left to right, with retracement levels representing ratios inside of the current range and extension levels representing ratios extended outside of the current range. If the current wave cycle ends on a swing low, the Fibonacci range is drawn from peak to trough. If the current wave cycle ends on a swing high the Fibonacci range is drawn from trough to peak.
Although there is some contention over which popular levels are and are not actually Fibonacci ratios, such as 50% and 100%, in this script I have based my retracement level calculations on the ratios of 23.6%, 38.2%, 50%, 61.8%, 78.6% and 100%. And my extension level calculations on the ratios of 161.8%, 261.8%, 361.8%, 423.6% and 461.8%.
█ FEATURES
Inputs
• Show Fibonacci Extensions
• 00.0% Line Color
• 23.6% Line Color
• 38.2% Line Color
• 50.0% Line Color
• 61.8% Line Color
• 78.6% Line Color
• 100.0% Line Color
• 161.8% Line Color
• 261.8% Line Color
• 361.8% Line Color
• 423.6% Line Color
• 461.8% Line Color
• Extend Line Type
• Show Labels
• Label Colors
█ LIMITATIONS
All green and red candle calculations are based on differences between open and close prices, as such I have made no attempt to account for green candles that gap lower and close below the close price of the preceding candle, or red candles that gap higher and close above the close price of the preceding candle. This may cause some unexpected behaviour on some markets and timeframes. I can only recommend using 24-hour markets, if and where possible, as there are far fewer gaps and, generally, more data to work with.
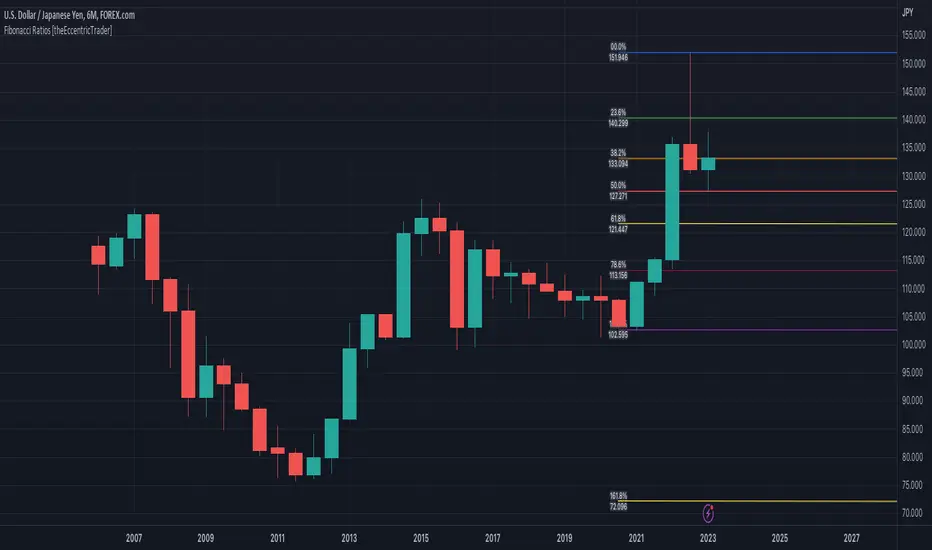
IOFin F-Score by zdmre🗣The IOFin F-Score is a discrete score between zero and ten that reflects ten criteria used to determine the strength of a firm's financial position.
🗣It is used to determine the best value stocks, with ten being the best and zero being the worst.
The IOFin F-Score broken down into the following categories:
Profitability
Equity, cash flow, liquidity, and source of funds
Operating efficiency
Criteria Include:
Price to book (P/B) lower than 3 (1 point)
Debt to Equity (D/E) lower than 0.5 (1 point)
Price to FreeCashFlow (P/FCF) equal to or lower than 20 (1 point)
Peg Ratio lower than 1 (1 point)
Sustainable Growth Rate higher than 0.3 (1 point)
Return on Assets (ROIC) higher than 0.07 (1 point)
Return on Equity (ROE) higher than 0.3 (1 point)
EnterpriseValue/Ebitda lower than 10 (1 point)
Quick Ratio equal to or higher than 1 (1 point)
Operating Margin higher than 0.15 (1 point)

Leveraged Share Conversion IndicatorHello everyone,
Releasing my leveraged share conversion indicator.
I noticed that the option traders have all the fun and resources but the share traders don't really have many resources in terms of adjusting or profits on leveraged and inverse shares. So, I decided to change that this this indicator!
What it does:
In a nut shell, the calculator converts one share to the price of another through the use of a regression based analysis.
There are multiple pre-stored libraries available in the indicator, including IWM, SPY, BTC and QQQ.
However, if the ticker you want to convert is not in one of the pre-defined libraries, you can select "Use Alternative Ticker" and indicate the stock you wish to convert.
Using Libraries:
If the conversion you want is available in one of the libraries, simply select the conversion you would like. For example, if you want to convert SPY to SPXU, select that conversion. The indicator will then launch up the conversion results which it will display in a dashboard to the right and will also display the plotted conversion on a chart (see imagine below:
In the dashboard, the indicator will show you:
a) The conversion result: This is the most likely price based on the analysis
b) The standard error: This is the degree of error within the conversion. This is the basis of the upper and lower bands. In statistics, we can add and subtract the standard error from the likely result to get the "Upper" and "Lower" Confidence levels of assessment. This is just a fancy way of saying the range in which our predicted result will fall. So, for example, in the image above it shows you the price of SPXU is assessed to be around 16$ based on SPY's price. The standard error range is 15-17. This means that, the majority of the time, based on this SPY close price, SPXU should fall between 15-17$ with the most likely result being the 16$ range.
Why is there error?
Because leveraged shares have an inherent decay in them. The degree of decay can be captured utilizing the standard error. So at any given time, the small changes in price fluctuations caused by the fact that the share is leveraged can be assessed and displayed using standard error measurements.
c) The current correlation: This is important! Because if the stocks are not strongly correlated, it tells you there is a problem. In general, a perfect correlation is 1 or -1 (perfectly negative correlation or inverse correlation) and a bad correlation is anything under 0.5 or -0.5. So, for an INVERSE leveraged share, you would expect the correlation to read a negative value. Ideally -1. Because the inverse share is doing the opposite of the underlying (if the underlying goes up, the inverse goes down and vice versa). For a non-inverse leveraged share, the correlation should read a positive value. As the underlying goes up, so too does the leveraged.
Manual Conversion using Library:
If you are using a pre-defined library but want to convert a manual close price, simply select "Enable manual conversion" at the bottom of the settings and then type in the manual close price. If you are converting SPY to SPXU, type in the manual close price of SPY to get the result in SPXU and vice versa.
Using an Alternative Ticker:
If the ticker you want is not available in a pre-defined library (i.e. UDOW, BOIL, APPU, TSLL, etc.), simply select "Use Alternative Ticker" in the settings menu. When you select this, make sure your chart is set to the dominant chart. The "Dominant chart" is the chart of the underlying. So, if you want TSLA to TSLL, be sure you have the TSLA chart open and then set your Alternative Ticker to TSLL or TSLQ.
The process of using an Alternative Ticker remains the same. If you wish to enter a manual close price, simply select "Enable Manual Conversion".
Special Considerations:
The indicator uses 1 hour candles. Thus, please leave your dominant chart set on the 1 hour time frame to avoid confusing the indicator.
The lookback period of the manual conversion is 10, 1 hour candles. As such, the results should not be used to make longer term predictions (i.e. anything over 6 months is pushing the capabilities of a manual conversion but fair game for the pre-defined library conversions which use more longer-term data).
You can technically use the indicator to make assessments between 2 separate equities. For example, the relationship between QQQ and ARKK, SPY and DIA, IWM and SPY, etc. If there is a good enough correlation, you can use it to make predictions of the opposing ticker. For example, if DIA goes to 340, what would SPY likely do? And vice versa.
As always, I have prepared a tutorial and getting started video for your reference:
As always, let me know your questions and requests/recommendations for the indicator below. This indicator is my final reference indicator in my 3 part reference indicator release. I will be going back over the feedback to make improvements based on the suggestions I have received. So please feel free to leave any suggestions here and I will take them into consideration for improvement!
Thank you for checking this out and as always, safe trades!
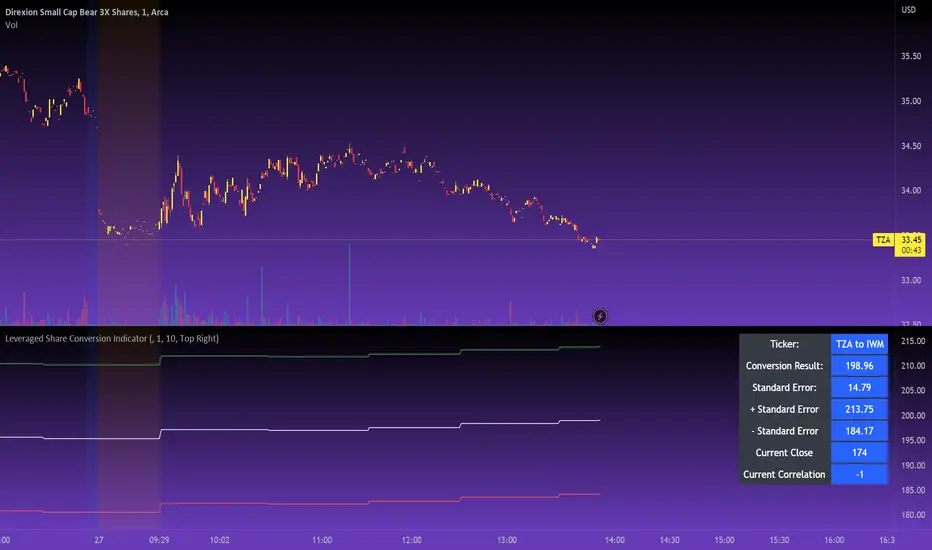
Pin Candle DetectionPin candles are a variation of hammer candles that are useful in technical analysis . In particular, when combined with volume profile studies, they can be a powerful set up for long entries or other decision making.
For example, when looking at volume profiles, a long entry would be a fair value area (i.e. 40%) below the close of a pin candle. When combined with a support level , the set up is stronger.
While most scripts look for hammer candles, pin candles are somewhat different in that the length of the wick is significant.
This script and its parameters was built for ES futures 15 min chart in mind.
This script is unique in that it allows for the below parameters to be adjusted to suit other instruments and timeframes:
1. Fib level: Candle must close within a certain retracement level). My preference is 0.55. Some traders like 0.5, while others prefer 0.33
2. Wick length: Pin candles differ from pure hammers in that the length of the wick must be significant. My preference is 7 points on ES (as in $ and not ticks)
Add this script to your alerts to no longer miss these set ups.

Expansion Finder by nnamWhat this Indicator Does
This indicator helps the trader locate expansion and contraction areas in an easy visual way.
When the asset moves from a contraction phase into an expansion phase, the bars change color (customizable). This allows the trader to recognize areas of contraction and avoid trading them. Once a Bar Range moves outside of the average range as specified by the user, the bar will change color informing the trader that the current bar and by default the market, is moving into an expansion phase from a contraction phase.
The indicator works well for those traders that use the Forex Master Pattern to locate Value Lines and Value Areas on the chart giving them an opportunity to draw in these areas with ease.
As shown in the screenshot below, the boxes are manually drawn after the trader locates an easily identifiable area of contraction.
The Indicator makes it easy to find longer areas of contraction and ignore the noise of smaller contractions.
Customizable Settings allow the trader to define the lookback range that determines the number of bars to base the average.
A "multiplier" setting allows the trader to easily adjust the Average by changing the average using a simple calculation.
Example, if the average multiplier is set to "1", the average will be used.
Using the standard average is not always the best way to define these contractions, so traders can set the average to a higher or lower number by using the multiplier, thus changing the calculation but maintaining a consistent number across the chart.
Example: If the average is not plotting the contraction correctly, the trader can manually adjust the multiplier down to 0.5 thus adjusting the average in half or increase the multiplier to 2 thus doubling the average.
As seen in the screenshot below, this changes the number of expansion bars visible on the chart.
Below you can see Value Areas and Value Lines drawn in. These lines assist the trader in defining important levels for future trading.
I hope this Indicator helps you locate value areas and value lines on charts in an easy way.
Any questions or concerns or suggestions, please do not hesitate to reach out.
Happy Trading !!!!
Vector2Library "Vector2"
Representation of two dimensional vectors or points.
This structure is used to represent positions in two dimensional space or vectors,
for example in spacial coordinates in 2D space.
~~~
references:
docs.unity3d.com
gist.github.com
github.com
gist.github.com
gist.github.com
gist.github.com
~~~
new(x, y)
Create a new Vector2 object.
Parameters:
x : float . The x value of the vector, default=0.
y : float . The y value of the vector, default=0.
Returns: Vector2. Vector2 object.
-> usage:
`unitx = Vector2.new(1.0) , plot(unitx.x)`
from(value)
Assigns value to a new vector `x,y` elements.
Parameters:
value : float, x and y value of the vector.
Returns: Vector2. Vector2 object.
-> usage:
`one = Vector2.from(1.0), plot(one.x)`
from(value, element_sep, open_par, close_par)
Assigns value to a new vector `x,y` elements.
Parameters:
value : string . The `x` and `y` value of the vector in a `x,y` or `(x,y)` format, spaces and parentesis will be removed automatically.
element_sep : string . Element separator character, default=`,`.
open_par : string . Open parentesis character, default=`(`.
close_par : string . Close parentesis character, default=`)`.
Returns: Vector2. Vector2 object.
-> usage:
`one = Vector2.from("1.0,2"), plot(one.x)`
copy(this)
Creates a deep copy of a vector.
Parameters:
this : Vector2 . Vector2 object.
Returns: Vector2. Vector2 object.
-> usage:
`a = Vector2.new(1.0) , b = a.copy() , plot(b.x)`
down()
Vector in the form `(0, -1)`.
Returns: Vector2. Vector2 object.
left()
Vector in the form `(-1, 0)`.
Returns: Vector2. Vector2 object.
right()
Vector in the form `(1, 0)`.
Returns: Vector2. Vector2 object.
up()
Vector in the form `(0, 1)`.
Returns: Vector2. Vector2 object.
one()
Vector in the form `(1, 1)`.
Returns: Vector2. Vector2 object.
zero()
Vector in the form `(0, 0)`.
Returns: Vector2. Vector2 object.
minus_one()
Vector in the form `(-1, -1)`.
Returns: Vector2. Vector2 object.
unit_x()
Vector in the form `(1, 0)`.
Returns: Vector2. Vector2 object.
unit_y()
Vector in the form `(0, 1)`.
Returns: Vector2. Vector2 object.
nan()
Vector in the form `(float(na), float(na))`.
Returns: Vector2. Vector2 object.
xy(this)
Return the values of `x` and `y` as a tuple.
Parameters:
this : Vector2 . Vector2 object.
Returns: .
-> usage:
`a = Vector2.new(1.0, 1.0) , = a.xy() , plot(ax)`
length_squared(this)
Length of vector `a` in the form. `a.x^2 + a.y^2`, for comparing vectors this is computationaly lighter.
Parameters:
this : Vector2 . Vector2 object.
Returns: float. Squared length of vector.
-> usage:
`a = Vector2.new(1.0, 1.0) , plot(a.length_squared())`
length(this)
Magnitude of vector `a` in the form. `sqrt(a.x^2 + a.y^2)`
Parameters:
this : Vector2 . Vector2 object.
Returns: float. Length of vector.
-> usage:
`a = Vector2.new(1.0, 1.0) , plot(a.length())`
normalize(a)
Vector normalized with a magnitude of 1, in the form. `a / length(a)`.
Parameters:
a : Vector2 . Vector2 object.
Returns: Vector2. Vector2 object.
-> usage:
`a = normalize(Vector2.new(3.0, 2.0)) , plot(a.y)`
isNA(this)
Checks if any of the components is `na`.
Parameters:
this : Vector2 . Vector2 object.
Returns: bool.
usage:
p = Vector2.new(1.0, na) , plot(isNA(p)?1:0)
add(a, b)
Adds vector `b` to `a`, in the form `(a.x + b.x, a.y + b.y)`.
Parameters:
a : Vector2 . Vector2 object.
b : Vector2 . Vector2 object.
Returns: Vector2. Vector2 object.
-> usage:
`a = one() , b = one() , c = add(a, b) , plot(c.x)`
add(a, b)
Adds vector `b` to `a`, in the form `(a.x + b, a.y + b)`.
Parameters:
a : Vector2 . Vector2 object.
b : float . Value.
Returns: Vector2. Vector2 object.
-> usage:
`a = one() , b = 1.0 , c = add(a, b) , plot(c.x)`
add(a, b)
Adds vector `b` to `a`, in the form `(a + b.x, a + b.y)`.
Parameters:
a : float . Value.
b : Vector2 . Vector2 object.
Returns: Vector2. Vector2 object.
-> usage:
`a = 1.0 , b = one() , c = add(a, b) , plot(c.x)`
subtract(a, b)
Subtract vector `b` from `a`, in the form `(a.x - b.x, a.y - b.y)`.
Parameters:
a : Vector2 . Vector2 object.
b : Vector2 . Vector2 object.
Returns: Vector2. Vector2 object.
-> usage:
`a = one() , b = one() , c = subtract(a, b) , plot(c.x)`
subtract(a, b)
Subtract vector `b` from `a`, in the form `(a.x - b, a.y - b)`.
Parameters:
a : Vector2 . vector2 object.
b : float . Value.
Returns: Vector2. Vector2 object.
-> usage:
`a = one() , b = 1.0 , c = subtract(a, b) , plot(c.x)`
subtract(a, b)
Subtract vector `b` from `a`, in the form `(a - b.x, a - b.y)`.
Parameters:
a : float . value.
b : Vector2 . Vector2 object.
Returns: Vector2. Vector2 object.
-> usage:
`a = 1.0 , b = one() , c = subtract(a, b) , plot(c.x)`
multiply(a, b)
Multiply vector `a` with `b`, in the form `(a.x * b.x, a.y * b.y)`.
Parameters:
a : Vector2 . Vector2 object.
b : Vector2 . Vector2 object.
Returns: Vector2. Vector2 object.
-> usage:
`a = one() , b = one() , c = multiply(a, b) , plot(c.x)`
multiply(a, b)
Multiply vector `a` with `b`, in the form `(a.x * b, a.y * b)`.
Parameters:
a : Vector2 . Vector2 object.
b : float . Value.
Returns: Vector2. Vector2 object.
-> usage:
`a = one() , b = 1.0 , c = multiply(a, b) , plot(c.x)`
multiply(a, b)
Multiply vector `a` with `b`, in the form `(a * b.x, a * b.y)`.
Parameters:
a : float . Value.
b : Vector2 . Vector2 object.
Returns: Vector2. Vector2 object.
-> usage:
`a = 1.0 , b = one() , c = multiply(a, b) , plot(c.x)`
divide(a, b)
Divide vector `a` with `b`, in the form `(a.x / b.x, a.y / b.y)`.
Parameters:
a : Vector2 . Vector2 object.
b : Vector2 . Vector2 object.
Returns: Vector2. Vector2 object.
-> usage:
`a = from(3.0) , b = from(2.0) , c = divide(a, b) , plot(c.x)`
divide(a, b)
Divide vector `a` with value `b`, in the form `(a.x / b, a.y / b)`.
Parameters:
a : Vector2 . Vector2 object.
b : float . Value.
Returns: Vector2. Vector2 object.
-> usage:
`a = from(3.0) , b = 2.0 , c = divide(a, b) , plot(c.x)`
divide(a, b)
Divide value `a` with vector `b`, in the form `(a / b.x, a / b.y)`.
Parameters:
a : float . Value.
b : Vector2 . Vector2 object.
Returns: Vector2. Vector2 object.
-> usage:
`a = 3.0 , b = from(2.0) , c = divide(a, b) , plot(c.x)`
negate(a)
Negative of vector `a`, in the form `(-a.x, -a.y)`.
Parameters:
a : Vector2 . Vector2 object.
Returns: Vector2. Vector2 object.
-> usage:
`a = from(3.0) , b = a.negate , plot(b.x)`
pow(a, b)
Raise vector `a` with exponent vector `b`, in the form `(a.x ^ b.x, a.y ^ b.y)`.
Parameters:
a : Vector2 . Vector2 object.
b : Vector2 . Vector2 object.
Returns: Vector2. Vector2 object.
-> usage:
`a = from(3.0) , b = from(2.0) , c = pow(a, b) , plot(c.x)`
pow(a, b)
Raise vector `a` with value `b`, in the form `(a.x ^ b, a.y ^ b)`.
Parameters:
a : Vector2 . Vector2 object.
b : float . Value.
Returns: Vector2. Vector2 object.
-> usage:
`a = from(3.0) , b = 2.0 , c = pow(a, b) , plot(c.x)`
pow(a, b)
Raise value `a` with vector `b`, in the form `(a ^ b.x, a ^ b.y)`.
Parameters:
a : float . Value.
b : Vector2 . Vector2 object.
Returns: Vector2. Vector2 object.
-> usage:
`a = 3.0 , b = from(2.0) , c = pow(a, b) , plot(c.x)`
sqrt(a)
Square root of the elements in a vector.
Parameters:
a : Vector2 . Vector2 object.
Returns: Vector2. Vector2 object.
-> usage:
`a = from(3.0) , b = sqrt(a) , plot(b.x)`
abs(a)
Absolute properties of the vector.
Parameters:
a : Vector2 . Vector2 object.
Returns: Vector2. Vector2 object.
-> usage:
`a = from(-3.0) , b = abs(a) , plot(b.x)`
min(a)
Lowest element of a vector.
Parameters:
a : Vector2 . Vector2 object.
Returns: float.
-> usage:
`a = new(3.0, 1.5) , b = min(a) , plot(b)`
max(a)
Highest element of a vector.
Parameters:
a : Vector2 . Vector2 object.
Returns: float.
-> usage:
`a = new(3.0, 1.5) , b = max(a) , plot(b)`
vmax(a, b)
Highest elements of two vectors.
Parameters:
a : Vector2 . Vector2 object.
b : Vector2 . Vector2 object.
Returns: Vector2. Vector2 object.
-> usage:
`a = new(3.0, 2.0) , b = new(2.0, 3.0) , c = vmax(a, b) , plot(c.x)`
vmax(a, b, c)
Highest elements of three vectors.
Parameters:
a : Vector2 . Vector2 object.
b : Vector2 . Vector2 object.
c : Vector2 . Vector2 object.
Returns: Vector2. Vector2 object.
-> usage:
`a = new(3.0, 2.0) , b = new(2.0, 3.0) , c = new(1.5, 4.5) , d = vmax(a, b, c) , plot(d.x)`
vmin(a, b)
Lowest elements of two vectors.
Parameters:
a : Vector2 . Vector2 object.
b : Vector2 . Vector2 object.
Returns: Vector2. Vector2 object.
-> usage:
`a = new(3.0, 2.0) , b = new(2.0, 3.0) , c = vmin(a, b) , plot(c.x)`
vmin(a, b, c)
Lowest elements of three vectors.
Parameters:
a : Vector2 . Vector2 object.
b : Vector2 . Vector2 object.
c : Vector2 . Vector2 object.
Returns: Vector2. Vector2 object.
-> usage:
`a = new(3.0, 2.0) , b = new(2.0, 3.0) , c = new(1.5, 4.5) , d = vmin(a, b, c) , plot(d.x)`
perp(a)
Perpendicular Vector of `a`, in the form `(a.y, -a.x)`.
Parameters:
a : Vector2 . Vector2 object.
Returns: Vector2. Vector2 object.
-> usage:
`a = new(3.0, 1.5) , b = perp(a) , plot(b.x)`
floor(a)
Compute the floor of vector `a`.
Parameters:
a : Vector2 . Vector2 object.
Returns: Vector2. Vector2 object.
-> usage:
`a = new(3.0, 1.5) , b = floor(a) , plot(b.x)`
ceil(a)
Ceils vector `a`.
Parameters:
a : Vector2 . Vector2 object.
Returns: Vector2. Vector2 object.
-> usage:
`a = new(3.0, 1.5) , b = ceil(a) , plot(b.x)`
ceil(a, digits)
Ceils vector `a`.
Parameters:
a : Vector2 . Vector2 object.
digits : int . Digits to use as ceiling.
Returns: Vector2. Vector2 object.
round(a)
Round of vector elements.
Parameters:
a : Vector2 . Vector2 object.
Returns: Vector2. Vector2 object.
-> usage:
`a = new(3.0, 1.5) , b = round(a) , plot(b.x)`
round(a, precision)
Round of vector elements.
Parameters:
a : Vector2 . Vector2 object.
precision : int . Number of digits to round vector "a" elements.
Returns: Vector2. Vector2 object.
-> usage:
`a = new(0.123456, 1.234567) , b = round(a, 2) , plot(b.x)`
fractional(a)
Compute the fractional part of the elements from vector `a`.
Parameters:
a : Vector2 . Vector2 object.
Returns: Vector2. Vector2 object.
-> usage:
`a = new(3.123456, 1.23456) , b = fractional(a) , plot(b.x)`
dot_product(a, b)
dot_product product of 2 vectors, in the form `a.x * b.x + a.y * b.y.
Parameters:
a : Vector2 . Vector2 object.
b : Vector2 . Vector2 object.
Returns: float.
-> usage:
`a = new(3.0, 1.5) , b = from(2.0) , c = dot_product(a, b) , plot(c)`
cross_product(a, b)
cross product of 2 vectors, in the form `a.x * b.y - a.y * b.x`.
Parameters:
a : Vector2 . Vector2 object.
b : Vector2 . Vector2 object.
Returns: float.
-> usage:
`a = new(3.0, 1.5) , b = from(2.0) , c = cross_product(a, b) , plot(c)`
equals(a, b)
Compares two vectors
Parameters:
a : Vector2 . Vector2 object.
b : Vector2 . Vector2 object.
Returns: bool. Representing the equality.
-> usage:
`a = new(3.0, 1.5) , b = from(2.0) , c = equals(a, b) ? 1 : 0 , plot(c)`
sin(a)
Compute the sine of argument vector `a`.
Parameters:
a : Vector2 . Vector2 object.
Returns: Vector2. Vector2 object.
-> usage:
`a = new(3.0, 1.5) , b = sin(a) , plot(b.x)`
cos(a)
Compute the cosine of argument vector `a`.
Parameters:
a : Vector2 . Vector2 object.
Returns: Vector2. Vector2 object.
-> usage:
`a = new(3.0, 1.5) , b = cos(a) , plot(b.x)`
tan(a)
Compute the tangent of argument vector `a`.
Parameters:
a : Vector2 . Vector2 object.
Returns: Vector2. Vector2 object.
-> usage:
`a = new(3.0, 1.5) , b = tan(a) , plot(b.x)`
atan2(x, y)
Approximation to atan2 calculation, arc tangent of `y/x` in the range (-pi,pi) radians.
Parameters:
x : float . The x value of the vector.
y : float . The y value of the vector.
Returns: float. Value with angle in radians. (negative if quadrante 3 or 4)
-> usage:
`a = new(3.0, 1.5) , b = atan2(a.x, a.y) , plot(b)`
atan2(a)
Approximation to atan2 calculation, arc tangent of `y/x` in the range (-pi,pi) radians.
Parameters:
a : Vector2 . Vector2 object.
Returns: float, value with angle in radians. (negative if quadrante 3 or 4)
-> usage:
`a = new(3.0, 1.5) , b = atan2(a) , plot(b)`
distance(a, b)
Distance between vector `a` and `b`.
Parameters:
a : Vector2 . Vector2 object.
b : Vector2 . Vector2 object.
Returns: float.
-> usage:
`a = new(3.0, 1.5) , b = from(2.0) , c = distance(a, b) , plot(c)`
rescale(a, length)
Rescale a vector to a new magnitude.
Parameters:
a : Vector2 . Vector2 object.
length : float . Magnitude.
Returns: Vector2. Vector2 object.
-> usage:
`a = new(3.0, 1.5) , b = 2.0 , c = rescale(a, b) , plot(c.x)`
rotate(a, radians)
Rotates vector by a angle.
Parameters:
a : Vector2 . Vector2 object.
radians : float . Angle value in radians.
Returns: Vector2. Vector2 object.
-> usage:
`a = new(3.0, 1.5) , b = 2.0 , c = rotate(a, b) , plot(c.x)`
rotate_degree(a, degree)
Rotates vector by a angle.
Parameters:
a : Vector2 . Vector2 object.
degree : float . Angle value in degrees.
Returns: Vector2. Vector2 object.
-> usage:
`a = new(3.0, 1.5) , b = 45.0 , c = rotate_degree(a, b) , plot(c.x)`
rotate_around(this, center, angle)
Rotates vector `target` around `origin` by angle value.
Parameters:
this
center : Vector2 . Vector2 object.
angle : float . Angle value in degrees.
Returns: Vector2. Vector2 object.
-> usage:
`a = new(3.0, 1.5) , b = from(2.0) , c = rotate_around(a, b, 45.0) , plot(c.x)`
perpendicular_distance(a, b, c)
Distance from point `a` to line between `b` and `c`.
Parameters:
a : Vector2 . Vector2 object.
b : Vector2 . Vector2 object.
c : Vector2 . Vector2 object.
Returns: float.
-> usage:
`a = new(1.5, 2.6) , b = from(1.0) , c = from(3.0) , d = perpendicular_distance(a, b, c) , plot(d.x)`
project(a, axis)
Project a vector onto another.
Parameters:
a : Vector2 . Vector2 object.
axis : Vector2 . Vector2 object.
Returns: Vector2. Vector2 object.
-> usage:
`a = new(3.0, 1.5) , b = from(2.0) , c = project(a, b) , plot(c.x)`
projectN(a, axis)
Project a vector onto a vector of unit length.
Parameters:
a : Vector2 . Vector2 object.
axis : Vector2 . Vector2 object.
Returns: Vector2. Vector2 object.
-> usage:
`a = new(3.0, 1.5) , b = from(2.0) , c = projectN(a, b) , plot(c.x)`
reflect(a, axis)
Reflect a vector on another.
Parameters:
a : Vector2 . Vector2 object.
axis
Returns: Vector2. Vector2 object.
-> usage:
`a = new(3.0, 1.5) , b = from(2.0) , c = reflect(a, b) , plot(c.x)`
reflectN(a, axis)
Reflect a vector to a arbitrary axis.
Parameters:
a : Vector2 . Vector2 object.
axis
Returns: Vector2. Vector2 object.
-> usage:
`a = new(3.0, 1.5) , b = from(2.0) , c = reflectN(a, b) , plot(c.x)`
angle(a)
Angle in radians of a vector.
Parameters:
a : Vector2 . Vector2 object.
Returns: float.
-> usage:
`a = new(3.0, 1.5) , b = angle(a) , plot(b)`
angle_unsigned(a, b)
unsigned degree angle between 0 and +180 by given two vectors.
Parameters:
a : Vector2 . Vector2 object.
b : Vector2 . Vector2 object.
Returns: float.
-> usage:
`a = new(3.0, 1.5) , b = from(2.0) , c = angle_unsigned(a, b) , plot(c)`
angle_signed(a, b)
Signed degree angle between -180 and +180 by given two vectors.
Parameters:
a : Vector2 . Vector2 object.
b : Vector2 . Vector2 object.
Returns: float.
-> usage:
`a = new(3.0, 1.5) , b = from(2.0) , c = angle_signed(a, b) , plot(c)`
angle_360(a, b)
Degree angle between 0 and 360 by given two vectors
Parameters:
a : Vector2 . Vector2 object.
b : Vector2 . Vector2 object.
Returns: float.
-> usage:
`a = new(3.0, 1.5) , b = from(2.0) , c = angle_360(a, b) , plot(c)`
clamp(a, min, max)
Restricts a vector between a min and max value.
Parameters:
a : Vector2 . Vector2 object.
min
max
Returns: Vector2. Vector2 object.
-> usage:
`a = new(3.0, 1.5) , b = from(2.0) , c = from(2.5) , d = clamp(a, b, c) , plot(d.x)`
clamp(a, min, max)
Restricts a vector between a min and max value.
Parameters:
a : Vector2 . Vector2 object.
min : float . Lower boundary value.
max : float . Higher boundary value.
Returns: Vector2. Vector2 object.
-> usage:
`a = new(3.0, 1.5) , b = clamp(a, 2.0, 2.5) , plot(b.x)`
lerp(a, b, rate)
Linearly interpolates between vectors a and b by rate.
Parameters:
a : Vector2 . Vector2 object.
b : Vector2 . Vector2 object.
rate : float . Value between (a:-infinity -> b:1.0), negative values will move away from b.
Returns: Vector2. Vector2 object.
-> usage:
`a = new(3.0, 1.5) , b = from(2.0) , c = lerp(a, b, 0.5) , plot(c.x)`
herp(a, b, rate)
Hermite curve interpolation between vectors a and b by rate.
Parameters:
a : Vector2 . Vector2 object.
b : Vector2 . Vector2 object.
rate : Vector2 . Vector2 object. Value between (a:0 > 1:b).
Returns: Vector2. Vector2 object.
-> usage:
`a = new(3.0, 1.5) , b = from(2.0) , c = from(2.5) , d = herp(a, b, c) , plot(d.x)`
transform(position, mat)
Transform a vector by the given matrix.
Parameters:
position : Vector2 . Source vector.
mat : M32 . Transformation matrix
Returns: Vector2. Transformed vector.
transform(position, mat)
Transform a vector by the given matrix.
Parameters:
position : Vector2 . Source vector.
mat : M44 . Transformation matrix
Returns: Vector2. Transformed vector.
transform(position, mat)
Transform a vector by the given matrix.
Parameters:
position : Vector2 . Source vector.
mat : matrix . Transformation matrix, requires a 3x2 or a 4x4 matrix.
Returns: Vector2. Transformed vector.
transform(this, rotation)
Transform a vector by the given quaternion rotation value.
Parameters:
this : Vector2 . Source vector.
rotation : Quaternion . Rotation to apply.
Returns: Vector2. Transformed vector.
area_triangle(a, b, c)
Find the area in a triangle of vectors.
Parameters:
a : Vector2 . Vector2 object.
b : Vector2 . Vector2 object.
c : Vector2 . Vector2 object.
Returns: float.
-> usage:
`a = new(1.0, 2.0) , b = from(2.0) , c = from(1.0) , d = area_triangle(a, b, c) , plot(d.x)`
random(max)
2D random value.
Parameters:
max : Vector2 . Vector2 object. Vector upper boundary.
Returns: Vector2. Vector2 object.
-> usage:
`a = from(2.0) , b = random(a) , plot(b.x)`
random(max)
2D random value.
Parameters:
max : float, Vector upper boundary.
Returns: Vector2. Vector2 object.
-> usage:
`a = random(2.0) , plot(a.x)`
random(min, max)
2D random value.
Parameters:
min : Vector2 . Vector2 object. Vector lower boundary.
max : Vector2 . Vector2 object. Vector upper boundary.
Returns: Vector2. Vector2 object.
-> usage:
`a = from(1.0) , b = from(2.0) , c = random(a, b) , plot(c.x)`
random(min, max)
2D random value.
Parameters:
min : Vector2 . Vector2 object. Vector lower boundary.
max : Vector2 . Vector2 object. Vector upper boundary.
Returns: Vector2. Vector2 object.
-> usage:
`a = random(1.0, 2.0) , plot(a.x)`
noise(a)
2D Noise based on Morgan McGuire @morgan3d.
Parameters:
a : Vector2 . Vector2 object.
Returns: Vector2. Vector2 object.
-> usage:
`a = from(2.0) , b = noise(a) , plot(b.x)`
to_string(a)
Converts vector `a` to a string format, in the form `"(x, y)"`.
Parameters:
a : Vector2 . Vector2 object.
Returns: string. In `"(x, y)"` format.
-> usage:
`a = from(2.0) , l = barstate.islast ? label.new(bar_index, 0.0, to_string(a)) : label(na)`
to_string(a, format)
Converts vector `a` to a string format, in the form `"(x, y)"`.
Parameters:
a : Vector2 . Vector2 object.
format : string . Format to apply transformation.
Returns: string. In `"(x, y)"` format.
-> usage:
`a = from(2.123456) , l = barstate.islast ? label.new(bar_index, 0.0, to_string(a, "#.##")) : label(na)`
to_array(a)
Converts vector to a array format.
Parameters:
a : Vector2 . Vector2 object.
Returns: array.
-> usage:
`a = from(2.0) , b = to_array(a) , plot(array.get(b, 0))`
to_barycentric(this, a, b, c)
Captures the barycentric coordinate of a cartesian position in the triangle plane.
Parameters:
this : Vector2 . Source cartesian coordinate position.
a : Vector2 . Triangle corner `a` vertice.
b : Vector2 . Triangle corner `b` vertice.
c : Vector2 . Triangle corner `c` vertice.
Returns: bool.
from_barycentric(this, a, b, c)
Captures the cartesian coordinate of a barycentric position in the triangle plane.
Parameters:
this : Vector2 . Source barycentric coordinate position.
a : Vector2 . Triangle corner `a` vertice.
b : Vector2 . Triangle corner `b` vertice.
c : Vector2 . Triangle corner `c` vertice.
Returns: bool.
to_complex(this)
Translate a Vector2 structure to complex.
Parameters:
this : Vector2 . Source vector.
Returns: Complex.
to_polar(this)
Translate a Vector2 cartesian coordinate into polar coordinates.
Parameters:
this : Vector2 . Source vector.
Returns: Pole. The returned angle is in radians.
Profitable Supertrend v0.1 - AlphaThis a script to try detect the best combination of supertrend parameters in a space of time. Sadly the script is slow. Evaluate all possibilities params is hard for a pinescript and my knowledge too. In some cases, when you want evaluate many time could be the script fails for timeout. Perhaps with time I could enhance. For this problem of speed the calculate of combinatios it's not complete: In factor use a increment of 0.2 in each param (0.1, 0.3, 0.5 ...) in period the increment for each value is 3. The range for factor it's from 3.0 to 12.0. The range of period it's from 10 to 43
My knowledge don't let me go more far. Perhaps with time I can enhance the script.

ATR PivotsThe "ATR Pivots" script is a technical analysis tool designed to help traders identify key levels of support and resistance on a chart. The indicator uses various metrics such as the Average True Range (ATR), Daily True Range ( DTR ), Daily True Range Percentage (DTR%), Average Daily Range (ADR), Previous Day High ( PDH ), and Previous Day Low ( PDL ) to provide a comprehensive picture of the volatility and movement of a security. The script also includes an EMA cloud and 200 EMA for trend identification and a 1-minute ATR scalping strategy for traders to make informed trading decisions.
ATR Detail:-
The ATR is a measure of the volatility of a security over a given period of time. It is calculated by taking the average of the true range (the difference between the high and low of a security) over a set number of periods. The user can input the number of periods (ATR length) to be used for the ATR calculation. The script also allows the user to choose whether to use the current close or not for the calculation. The script calculates various levels of support and resistance based on the relationship between the security's range ( high-low ) and the ATR. The levels are calculated by multiplying the ATR by different Fibonacci ratios (0.236, 0.382, 0.5, 0.618, 0.786, 1.000) and then adding or subtracting the result from the previous close. The script plots these levels on the chart, with the -100 level being the most significant level. The user also has an option to choose whether to plot all Fibonacci levels or not.
DTR and DTR% Detail:-
The Daily True Range Percentage (DTR%) is a metric that measures the daily volatility of a security as a percentage of its previous close. It is calculated by dividing the Daily True Range ( DTR ) by the previous close. DTR is the range between the current period's high and low and gives a measure of the volatility of the security on a daily basis. DTR% can be used as an indicator of the percentage of movement of the security on a daily basis. In this script, DTR% is used in combination with other metrics such as the Average True Range (ATR) and Fibonacci ratios to calculate key levels of support and resistance for the security. The idea behind using DTR% is that it can help traders to better understand the daily volatility of the security and make more informed trading decisions.
For example, if a security has a DTR% of 2%, it suggests that the security has a relatively low level of volatility and is less likely to experience significant price movements on a daily basis. On the other hand, if a security has a DTR% of 10%, it suggests that the security has a relatively high level of volatility and is more likely to experience significant price movements on a daily basis.
ADR:-
The script then calculates the ADR (Average Daily Range) which is the average of the daily range of the security, using the formula (Period High - Period Low) / ATR Length. This gives a measure of the average volatility of the security on a daily basis, which can be useful for determining potential levels of support and resistance .
PDH /PDL:-
The script also calculates PDH (Previous Day High) and PDL (Previous Day Low) which are the High and low of the previous day of the security. This gives a measure of the previous day's volatility and movement, which can be useful for determining potential levels of support and resistance .
EMA Cloud and 200 EMA Detail:-
The EMA cloud is a technical analysis tool that helps traders identify the trend of the market by comparing two different exponential moving averages (EMAs) of different lengths. The cloud is created by plotting the fast EMA and the slow EMA on the chart and filling the space between them. The user can input the length of the fast and slow EMA , and the script will calculate and plot these EMAs on the chart. The space between the two EMAs is then filled with a color that represents the trend, with green indicating a bullish trend and red indicating a bearish trend . Additionally, the script also plots a 200 EMA , which is a commonly used long-term trend indicator. When the fast EMA is above the slow EMA and the 200 EMA , it is considered a bullish signal, indicating an uptrend. When the fast EMA is below the slow EMA and the 200 EMA , it is considered a bearish signal, indicating a downtrend. The EMA cloud and 200 EMA can be used together to help traders identify the overall trend of the market and make more informed trading decisions.
1 Minute ATR Scalping Strategy:-
The script also includes a 1-minute ATR scalping strategy that can be used by traders looking for quick profits in the market. The strategy involves using the ATR levels calculated by the script as well as the EMA cloud and 200 EMA to identify potential buy and sell opportunities. For example, if the 1-minute ATR is above 11 in NIFTY and the EMA cloud is bullish , the strategy suggests buying the security. Similarly, if the 1-minute ATR is above 30 in BANKNIFTY and the EMA cloud is bullish , the strategy suggests buying the security.
Inside Candle:-
The Inside Candle is a price action pattern that occurs when the current candle's high and low are entirely within the range of the previous candle's high and low. This pattern indicates indecision or consolidation in the market and can be a potential sign of a trend reversal. When used in the 15-minute chart, traders can look for Inside Candle patterns that occur at key levels of support or resistance. If the Inside Candle pattern occurs at a key level and the price subsequently breaks out of the range of the Inside Candle, it can be a signal to enter a trade in the direction of the breakout. Traders can also use the Inside Candle pattern to trade in a tight range, or to reduce their exposure to a current trend.
Risk Management:-
As with any trading strategy, it is important to practice proper risk management when using the ATR Pivots script and the 1-minute ATR scalping strategy. This may include setting stop-loss orders, using appropriate position sizing, and diversifying your portfolio. It is also important to note that past performance is not indicative of future results and that the script and strategy provided are for educational purposes only.
In conclusion, the "ATR Pivots" script is a powerful tool that can help traders identify key levels of support and resistance , as well as trend direction. The additional metrics such as DTR , DTR%, ADR, PDH , and PDL provide a more comprehensive picture of the volatility and movement of the security, making it easier for traders to make better trading decisions. The inclusion of the EMA cloud and 200 EMA for trend identification, and the 1-minute ATR scalping strategy for quick profits can further enhance a trader's decision-making process. However, it is important to practice proper risk management and understand that past performance is not indicative of future results.
Special thanks to satymahajan for the idea of clubbing Average True Range with Fibonacci levels.
