TA Basics: Creating a Zero Lag Moving Average using "Mirroring"we all know how moving averages suffer from lag - they have a delayed response to change in the underlying values - regardless if the underlying values are price movement or some kind of indicator formula that we are trying to smooth using a moving average.
here's a simple technique that can help minimize the lag built into the moving average - you can use this technique while building your own indicator (say modifying RSI) or simply apply it to a price chart to generate some sort of signal.
the concept here is simple and it actually depends on the fact that there's lag in moving averages - however, it was also observed that this lag is less when we use a weighted moving average (WMA) vs a simple moving average (SMA). (for a quick intro / refresher on Moving Averages, there's an awesome write-up here on TradingView that you can easily find with a quick search)
so the idea is to take the delta between these 2 lines (which is mathematically equal to SMA - WMA) , and "mirror it" on the other side of the WMA to produce the new Zero-lag line (let's call it ZLMA. sounds easy, right?
now, expanding on this concept just one step further, while we're at it, why don't we take, say, 1.5 times that delta, or 2 times and mirror it - wouldn't that produce an even less lagging line that moves in lockstep with the price (or whatever data series)? -- yes it would, we added that in the sample code here, but be careful with that, if you increase that factor too much, the ZLMA starts behaving "wildly" and loses relevance to the underlying data. so keep it from 1 to 2.5 -- an ideal value would be around the 1.5 (and of course, for the mathematically gifted, as you expect, you make that factor -1.0, and you end up with a ZLMA that is exactly same as the SMA :) ..
if you don't use a ZLMA factor "f" -- then the simple equation is ZLMA = 2W - S, which you can simply add to any indicator to smoother it without introducing a lot of lag -- however, i still suggest you keep that smoothing to a small value between 3 and 6 -- to stay relevant to underlying data
hope you like this and find it useful. let me know -- i'd like to know if there's interest in these types of concepts and there's more to come.
pls stay safe,
ค้นหาในสคริปต์สำหรับ "西布罗姆vs伯恩利"

(JS) Squeeze Pro OverlaysSo this was something I planned on doing in the future, I knew it would take some time to put together but here it is, the Squeeze Pro 2 Overlays.
On my original Squeeze Pro, I had made several overlay indicators to go along with it, this time my goal was to combine all that stuff into a single indicator and allow the user to turn on and off the specific features they'd prefer to use. The version illustrated in the preview has everything turned on. What is "everything"? Here's the breakdown...
First of all - the color schemes in the Squeeze Pro match the color schemes in the Overlays indicator, so you can match them up (Color Scheme 3 in example). There are 6 schemes, option 1 is the original Squeeze colors.
There's also an option to make the light squeeze black, rather than white. This is for people who aren't using Dark Mode. It will flip all white to black, to make your charts better to read!
So there are 4 main overlays that can be switched on and off with this indicator, they include;
1. Early Signal Candles
2. BBMA Basis Line
3. Bollinger Bands/Keltner Channel Breaches
4. Signal Arrows
Early Signal Candles
The Early Signal Candles have two parameters, the entry smoothing period and the exit smoothing period.
There is a different type of early entry signal for each type of squeeze.
Low Squeeze generates white dots on the highs of the candles.
Mid Squeeze generates a lime green candle (or purple candle in color scheme 3).
High Squeeze generates a bigger purple circle on the high of the candle.
These three signals are made to mimic the original Early In/Out Candles from John Carter and represent the same thing (they work the same way).
As for the early exit, that would be determined by the color of the candle vs the color of the squeeze, works the same way as the original as well.
BBMA Basis Line
The BBMA (Bollinger Bands Momentum Average) was a moving average I had made to use with the squeeze on the previous version.
It is the basis line of the BB and KC used to make up the Squeeze (a 20 SMA). There are 4 different colors to it on this version.
1. Orange - This means no squeeze.
2. White/Black - Low Squeeze
3. Red - Mid Squeeze
4. Yellow - High Squeeze
You'll also notice these colors are light and dark in different spots - this is a representation of whether the Bollinger Bands are expanding or contracting. Dark means expanding, light means contracting.
Bollinger Bands/Keltner Channel Breaches
This is a pretty simple feature. If there is an ongoing squeeze, and a candle closes above or below the Bollinger Bands or Keltner Channels, a circle appears at the top or the bottom of the chart telling you which way the channel has been breached.
Signal Arrows
This is what makes up most of the overlay indicator. If you turn it on, the default is set to work just like the original. There are lots of options with this though.
First, you can turn each type of Squeeze Arrow on or off by checking/unchecking the boxes for them.
Now allow me to explain the "Signal Length", as there are several options.
The default is "6 Dots", this generates a signal when a particular type of Squeeze reaches the 6th dot ("12 Dots" works the same way).
"End of Squeeze" generates a signal once a type of Squeeze has concluded.
"End of Early Signal" generates a signal when the early dots (or candle) finishes.
"Custom" allows you to select your own dot duration to produce a signal, you select that number in the field below.
The other portion of this is the "Signal Type", this is where you select how each signal is generated once the selected amount of time takes place.
The default is the same as the original "+/-", this generates a signal based on whether Squeeze momentum is positive or negative.
"Rising/Falling" will only generate a signal if the Squeeze momentum maintains consistently over the last 6 bars.
"Crossed Zero" only generates a signal if the Squeeze momentum crosses above or below the zero line.
"Basis Line Momentum" is based on the BBMA. A signal is generated based on whether the current candle closes above or below the basis line.
"Divergence" only generates a signal if there is a divergence signal present at the time of the signal.
"Current Momentum" generates a signal based simply on the current direction of Squeeze momentum.
"Sum of Change" generates a signal based on the sum of the change in the Squeeze momentum being positive (long) or negative (short) over the length of time you select in the "Sum of Change Length" field.
Then "Combo" tries to take a look at everything and generates a score based on these parameters. Positive score = long, negative = short.
I hope I gave a detailed enough explanation on how everything works, let me know if you have any questions! Hope you like it!

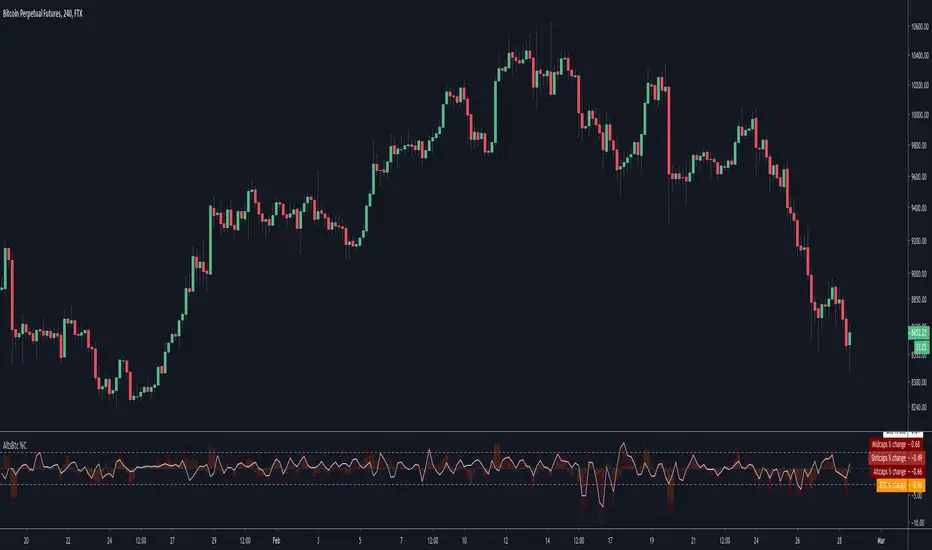
Alts vs Btc percentage changesCatch differences and over-corrections between Alts and Bitcoin via Ftx's indexes
A more visual description : i.imgur.com
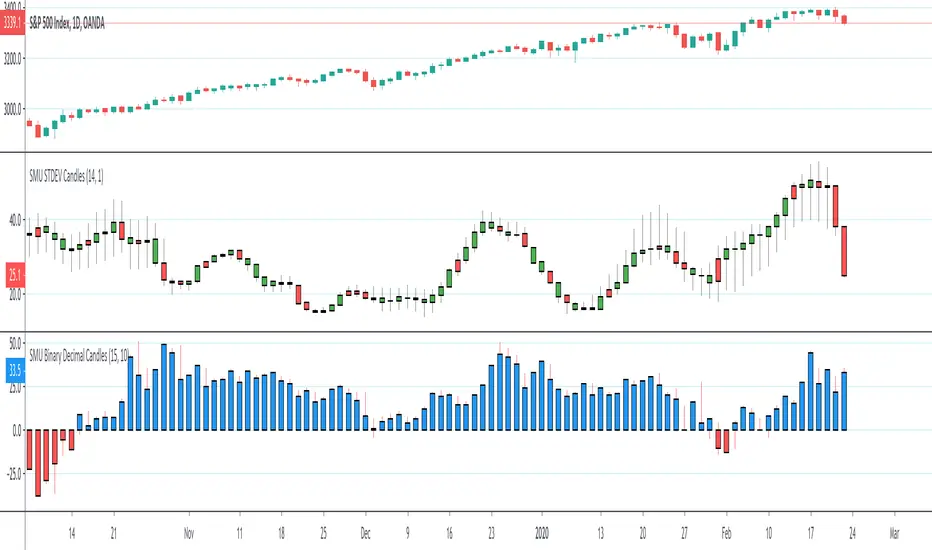
SMU Binary Decimal CandlesThis script creates a Decimal and Binary representation of the price using ROC. The idea is to simplify the price action into a distance from Zero to upside and downside.
You can see clearly trend develops in the ROC in the decimal view, kind of like MACD but based on raw price action change. I'm' a big fan of raw price action, so my scripts are super simple.
You can also use this script in a binary mode close higher = 1 and lower is -1. I use the binary mode to remove the psychological pressure of watching the stock going against me. I turn off the actual price and only focus on number of reds vs blue. On a Quantum physics level, when I short, I observe /wish for more reds like last night 1% sell-off
The main message form all my scripts is think outside the box, experiment with something crazy that doesn't make sense at first and make it to make sense. I always start with an idea that pops into my head, script with Pine script super simple and then watch it for hours to see what is trying to tell me. I have many work in progress that still doesn't make sense but looks really weird and wonderful. When I figure out what is trying to tell me I publish it
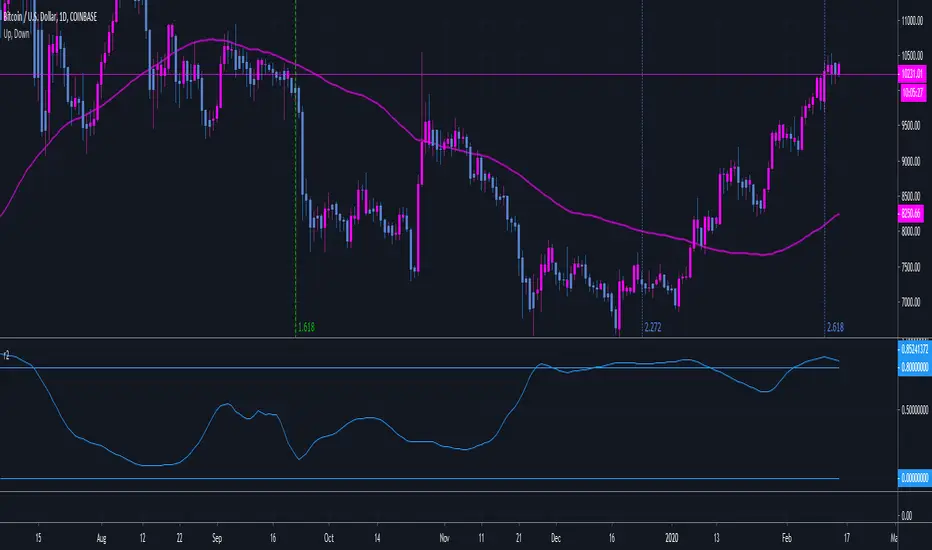
r2 correlation coefficientmade a quick script to compare r2 correlation coefficient, can change source and correlation component in inputs menu
example, here we can see that btc currently has a 0.85 correlation with eth vs usd when using simple moving avg on the daily (above 0.8 is positive correlation. below -0.8 is negitive correlation, and anything in between means there is no correlation)
note: if you wanted to compare with a different source like rsi, then you would need to reduce the length in the inputs menu
not an expert, i encourage doing your own research
biffy

Market Delta [Makit0]MARKET DELTA INDICATOR v0.5 beta
Market Delta is suitable for daytrading on intraday timeframes, is a volume based indicator which allows to see the UP VOLUME vs the DOWN VOLUME, the DELTA (difference) and the CUMULATIVE DELTA (cumulative sum of difference) between them
This indicator is based on contracts volume (data avaiable), not in ask/bid volume (data not avaiable)
The up/down volume is calculated at each candle as follows:
- calculate the ticks of the range, top wick and bottom wick
- calculate the ticks up and ticks down to get the total ticks of the candle
- calculate the volume per tick as total volume divided by total ticks
- calculate the up and down volume as volume per tick multiplied by up ticks and down ticks
The delta is calculated as volume up minus volume down
The cumulative delta is a cumulative sum of delta and is resetted to 0 twice a day at the globex open and at the us cash open
By default the indicator plots the 'CANDLE MODE' which is useful for charting the cumulative volume to find out support and resistance zones where the volume is rejected or pass thru, as the volume moves so does the price, price always follows the volume, price goes away from where volume dries and price auctions comfortable where is plenty of volume, in a way PRICE FEEDS ON VOLUME
An indication about the plotting style in the volume, delta and cumulative delta modes: I can't use histogram as intended due a bug at autoresizing the scale in the candle mode, so the styles used are areabr and circles.
FEATURES
- Plot volume in one of four modes: Volume Up/Down, Delta, Cumulative Delta, Cumulative Delta as Candles
- Cumulative delta resetted twice a day (globex and cash open)
- Show a base line at 0
SETTINGS
- Mode: select one of the four volume output modes: Volume, Delta, Cumulative Delta and Candles. Candles by default
- Show zero line: show/hide the zero base line. False by default.
HOW TO SETTING UP THE INDICATOR:
BE AWARE, by default the indicator settings are configured for using the Cumulative Delta Candle Mode
- Candles Mode Settings: configured by default, mode candles and zero line off
- Volume, Delta, Cumulative Delta Mode Settings: select the mode you want and switch on/off the zero line
GOOD LUCK AND HAPPY TRADING

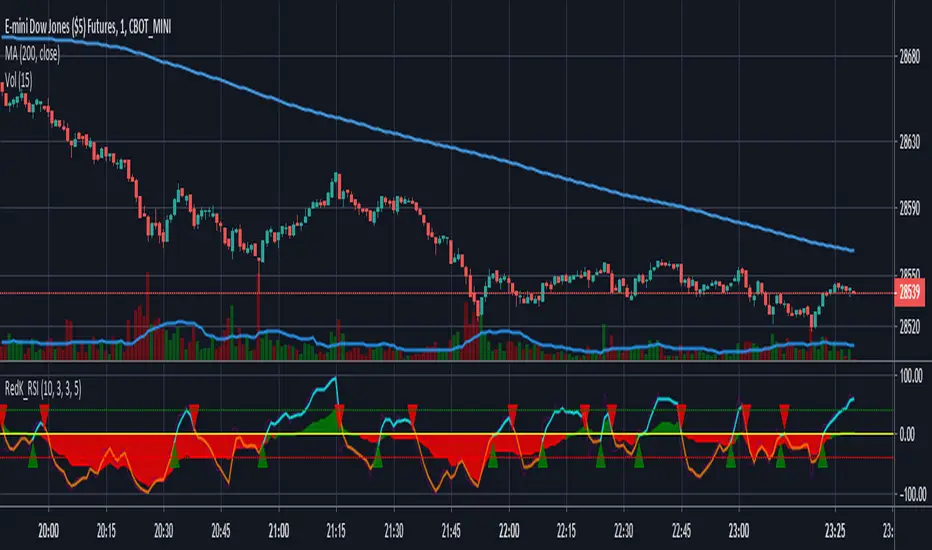
RedK Vol_Weighted RSI: Extending the power of the classic RSILet's take the classic Relative Strength Index (RSI) and give it couple of modern upgrades - the results are better visuals with improved signals and trade decision support:
Options and features:
- Dual period: look at the short term RSI vs a backdrop of a longer period RSI (expressing the longer-term "prevailing sentiment") - get clearer "re-entry" points in long bull or bear runs
- Longer period RSI has a "Step" option - since what we won't be really interested in the fractions, but more of the broad "strength" of the sentiment (weak, medium..) - default set to a step of 5. please experiment with what works best for you.
- Option to make the RSI volume-weighted. (On by default) - won't say much here, but possibly this is the biggest and most important added feature for those keen on the combined price - volume effect (and Wyckoff'ians)
- Smoothing option -- i would keep this set to 3 to avoid extra lag due to the smoothing
- scaled to +100 / -100 with zero as the signal line - that's how i like oscillators to work
- Adjustable optional overbought / oversold levels - can also be used to also mark strong up/down levels
- designed for the "visually oriented" -- like me :)
- code is open and commented
What Values to use:
many setting combinations possible. play around and find your sweet spot based on what/how you trade. for me, i usually prefer what i set as defaults in the study.
tip: if you set Length = 14, smoothing = 1, Sent. factor =1, Vol Weighted = No, you're back (almost) with a classic RSI - the only difference would be that i use Weighted Moving Average in my calculation of the RSI (i tend to believe WMA is the most naturally-suited for looking at "market price" data series)
Please feel free to use, share or give feedback.
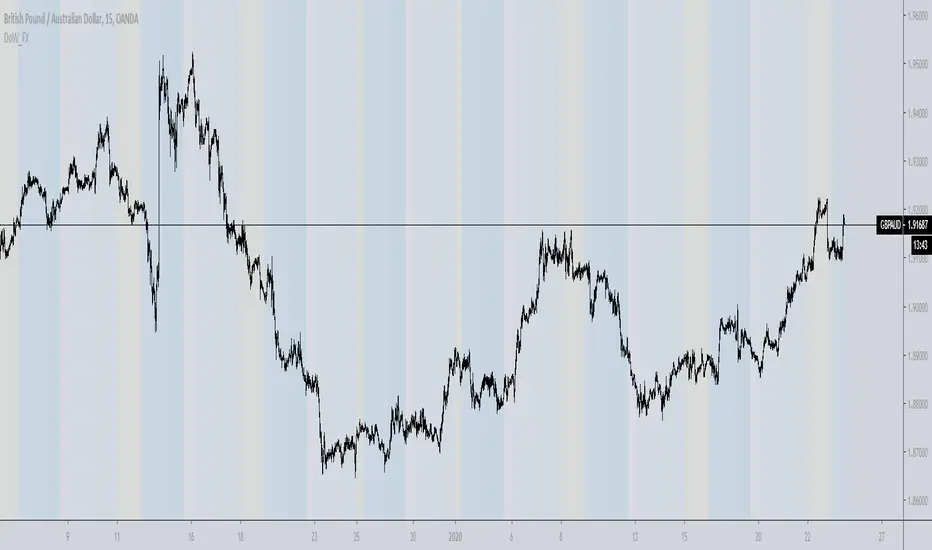
Day of week, Forex FixCalendar to work on instruments that trade a 24 hour day like crypto and forex, also does not display if you are above an intraday time. Main tweak was to end the trading day at 0000 (midnight) instead of 1700 (5pm) NYC time.
This update is geared towards Forex traders, which is why I chose to highlight Wednesday in yellow since that is commonly thought of as a midweek reversal point.
@airscape built a good calendar indicator based on the work of @ChrisMoody, this is really an update to their work and directed towards FX and Crypto
airscape:
ChrisMoody:
Future development:
Toggle for light and dark themes
Adjustment/offset for DLST and local vs/ server time
Additional color bands to denote Asian/London/NYC sessions?
Text label for days instead of color option?
Clean up the code and simplify
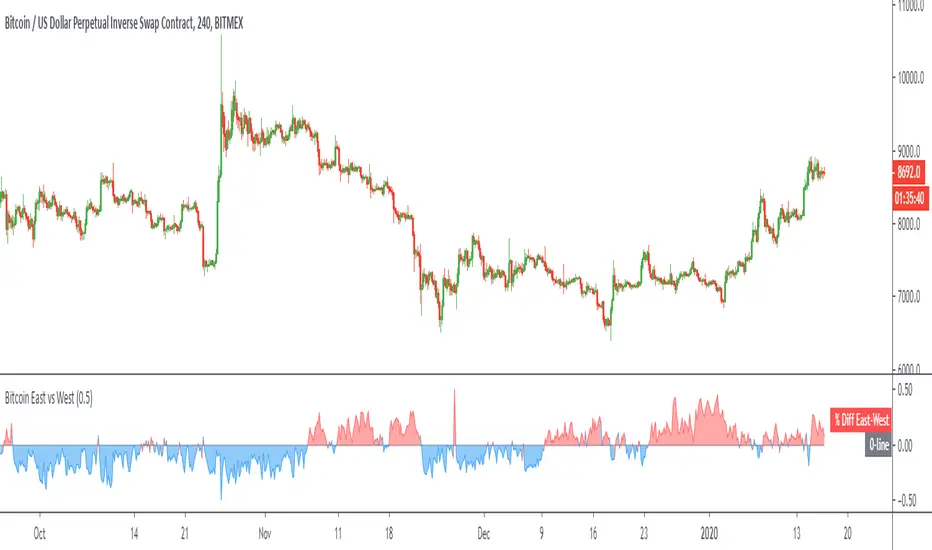
Bitcoin East vs WestPlots the volume weighted price difference between the top spot exchanges in the "East" (Asian markets) versus the "West" (US/UK/EU markets).
Optional: view the volume difference between the two.
BEST Supertrend MAHello traders,
That one is an experiment
I was curious to see what a supertrend based on moving average cross could give
How does it work?
Bull event: fast moving average crossing over the slow moving average
Bear event: fast moving average crossing under the slow moving average
When the event is triggered, the script will plot the Supertrend as follow
UP Trend = ohlc4+ ATR * Factor
DOWN Trend = ohlc4- ATR * Factor
Interesting to see the results given by ohlc4 vs hl2 and hl3
Documentation: www.tradingview.com
This is an alternative of the classical Supertrend based on candle close being above/beyond the previous Supertrend level.
Hope you'll enjoy it and it will improve your trading making you a better trader
Dave

Log xSo this is logaritmic scaling with upper and lower deviation
you can change input (set to 100) but you can try different rates if better
the Log trend seen in blue=bullish vs red line =bearish
the indicator give us better sense of potential break up or down and overall trend
Happy new year to All members of Trading view

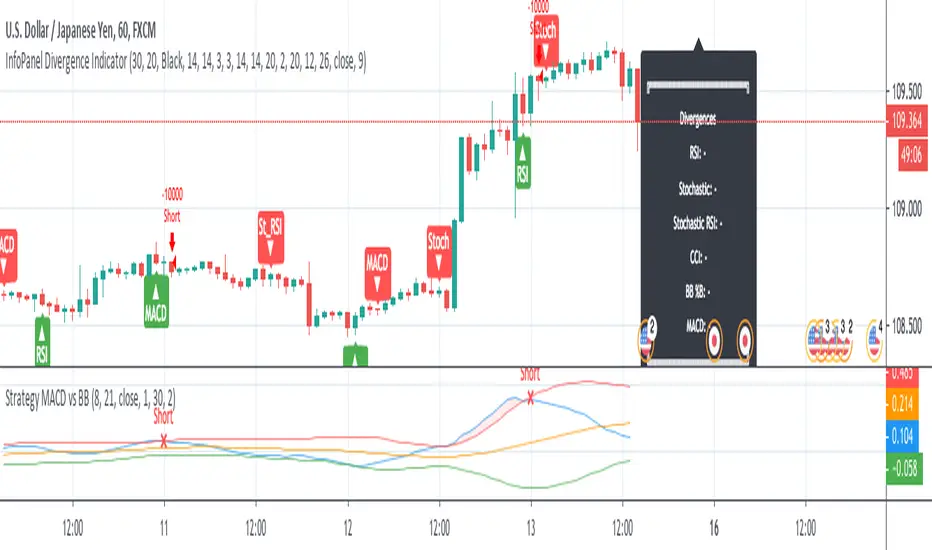
Strategy MACD vs BBStrategy based on MACD and Bollinger Bands, where BBs are calculatend from macd signal.
Strategy doesn't open at breakout of bands but it waits for a pullback.
Upper and lower bands are used as resistance and support.
There are various parameters that can be optimized.
I have also a study with alerts.
Please use comment section for any feedback or cointact me if you need support.
Directional Movement Index + Average Directional IndexPersonal DMI and ADX script
ADX color change from positive vs negative momentum
DMI Color fill based on DMI+/- positive momentum
No fill color during lack of momentum

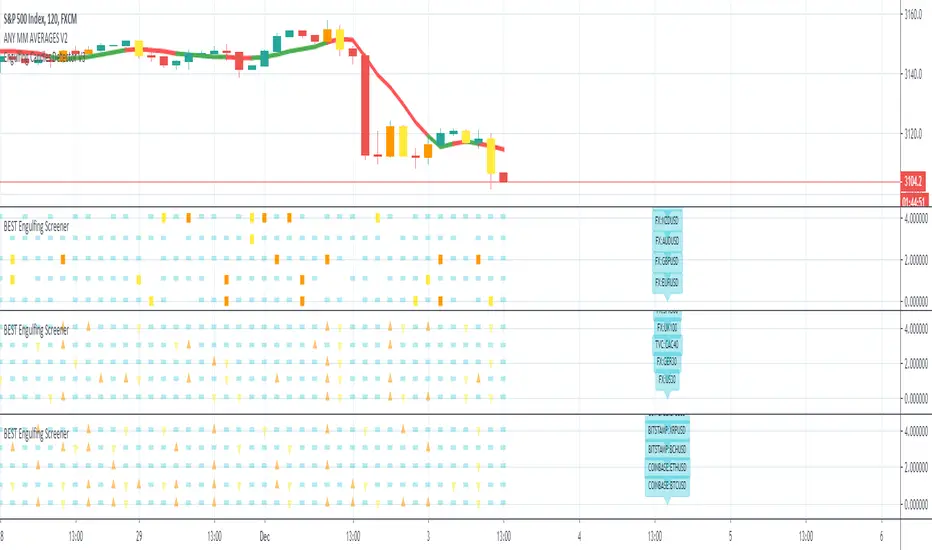
BEST Ultimate Engulfing ScreenerHello traders
Continuing deeper and stronger with the screeners serie. I keep getting requests private messages and requests saying that screeners aren't possible with TradingView.
My answer is always... "Reallyyy ??" (I never find a better answer than that...)
I'll publish a few screeners just for everyone to understand what can be done with Pinescript. We don't have to wait for TradingView to allow screener based on custom indicator - we can build our own ^^
I - What is an engulfing pattern
Let's start with a screener to check for a very famous candlestick pattern called engulfing
Engulfing candles tend to signal a reversal of the current trend in the market. This specific pattern involves two candles with the latter candle ‘engulfing’ the entire body of the candle before it.
The engulfing candle can be bullish or bearish depending on where it forms in relation to the existing trend
Source and more info here
These engulfing candles indicate a strong shift in direction, and when combined with observation of the price-trending direction that precedes it, this shift creates the opportunity for a trading strategy.
II - How did I set the screener
I added an optional filter being Price vs SMA. The idea is to select only the engulfing whenever the price also breaks an SMA - this usually translates a stronger move - but could sometimes give the signal too late (#meh #trading #ain't #easy)
The visual signals are as follow:
- square: whenever the engine detects an engulfing and an SMA breakout
- triangle: the engine only detects an engulfing
- dash: none of the above
Then the colors are:
- orange when bullish
- yellow when bearish
- aqua/dash when none of the above
Cool Hacks
"But sir... what can we do with only 5 instruments for a screener?" I agree not much but...
even if I allow only 5 instruments per indicator - nothing prevents you from adding multiple times the same indicator and changing the selected instruments for each. I also show why the SPX500 gave a yellow triangle (bearish engulfing) and how to match it with the screener.
=> imgur.com
Wishing you all the BEST trading
Dave
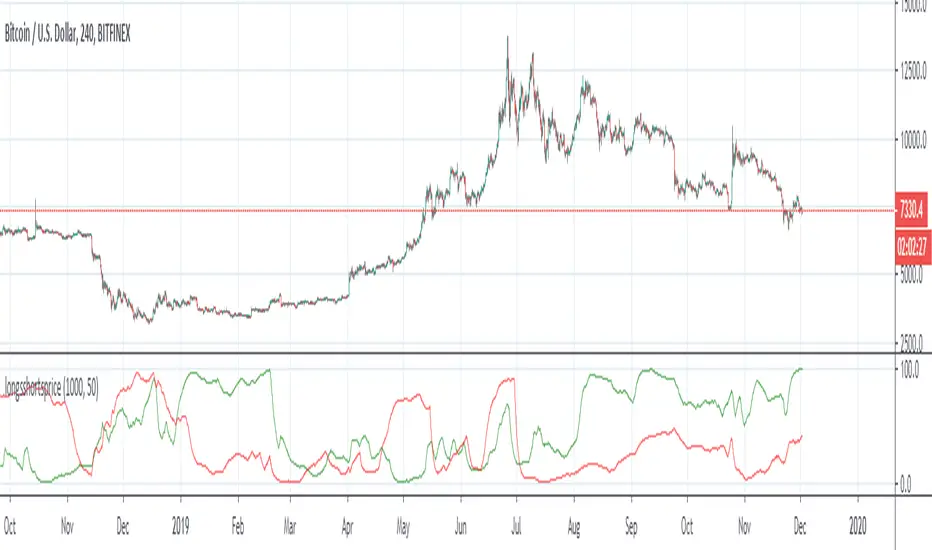
Longs Vs Shorts BTC - Open sourceUsing percentage function to compare longs/shorts over a defined time window and smoothing (a dividor of the time window)