Clear Signal Trading Strategy V5Clear Signal Trading Strategy - Description
This strategy uses a simple 0-5 point scoring system to identify high-probability trades. It combines trend following with momentum confirmation to generate clear BUY/SELL signals while filtering out market noise.
How it works: The strategy waits for EMA crossovers, then scores the setup based on trend alignment, momentum, RSI position, and volume. Only trades scoring above your chosen threshold are executed.
Recommended Settings by Market Type
For Beginners / Risk-Averse Traders:
Signal Sensitivity: Conservative
Volume Confirmation: ON
Risk Per Trade: 1-2%
Stop Loss Type: ATR
ATR Multiplier: 2.5
Risk:Reward Ratio: 2.0
For Trending Markets (Strong Directional Movement):
Signal Sensitivity: Balanced
Volume Confirmation: ON
Risk Per Trade: 2%
Stop Loss Type: ATR
ATR Multiplier: 2.0
Risk:Reward Ratio: 2.5-3.0
For Ranging/Choppy Markets:
Signal Sensitivity: Conservative
Volume Confirmation: ON
Risk Per Trade: 1%
Stop Loss Type: Percentage
Percentage Stop: 2%
Risk:Reward Ratio: 1.5
For Volatile Markets (Crypto/High Beta Stocks):
Signal Sensitivity: Conservative
Volume Confirmation: ON
Risk Per Trade: 1%
Stop Loss Type: ATR
ATR Multiplier: 3.0
Risk:Reward Ratio: 2.0
Best Practices
Timeframes:
15-minute to 1-hour for day trading
4-hour to daily for swing trading
Works best on liquid instruments with good volume
When to avoid trading:
When dashboard shows "HIGH" volatility above 4%
During major news events
When win rate drops below 40%
In markets with no clear trend (prolonged NEUTRAL state)
Success tips:
Start with Conservative mode until you see 10+ successful trades
Only increase to Balanced mode when win rate exceeds 55%
Never use Aggressive mode unless market shows strong trend for 5+ days
Always honor the stop loss - no exceptions
Take partial profits at first target if unsure
ค้นหาในสคริปต์สำหรับ "股票开盘前15分钟交易规则"

Market Bias [Mario]Indicator Description: Market Bias
Core Objective and Philosophy
The Market Bias indicator is designed not as a simple signal generator, but as a comprehensive tool for trend analysis and directional bias assessment. Its primary purpose is to provide traders with a clear, at-a-glance understanding of the market's direction across multiple timeframes. By visualizing the alignment of trends, it helps traders make more informed decisions, ensuring they are trading in harmony with the broader market momentum rather than against it. This is a tool for strategic positioning, not for providing blind buy or sell commands.
How It Works: The Core Mechanic
The indicator's logic is based on the relationship between two configurable moving averages (MAs): a Fast MA (defaulting to a 9-period EMA) and a Slow MA (defaulting to a 21-period SMA). The market bias on any given timeframe is determined as follows:
Bullish Bias: When the Fast MA is trading above the Slow MA, it indicates positive, upward momentum.
Bearish Bias: When the Fast MA is trading below the Slow MA, it indicates negative, downward momentum.
Users have full control to customize the type (SMA, EMA, WMA, etc.) and length of each moving average to fit their specific trading style and the asset being analyzed.
Key Feature: The Higher Timeframe (HTF) Bias Table
This is the most powerful feature of the indicator and its main reason for existence. It displays a simple, color-coded table in the corner of the chart, showing the real-time bias for the Daily (D), 4-Hour (4H), and 1-Hour (1H) timeframes.
Purpose: The HTF table solves a critical problem for traders: losing sight of the bigger picture. A trader on a 15-minute chart might see a setup to go long, but if the 4H and Daily charts are strongly bearish, that trade is fighting a powerful current and has a lower probability of success.
Application: By checking this table, a trader can instantly verify if their intended trade direction is aligned with the higher timeframe trends. The ideal scenario is "confluence," where the bias is the same across all key timeframes (e.g., D, 4H, and 1H are all Bullish), giving the trader a strong conviction to only look for long entries.
On-Chart Visual Aids
To support the analysis on the current chart, the indicator provides several visual aids:
Moving Average Plots: Both the Fast and Slow MAs are drawn directly on the chart, allowing traders to see their interaction with price in real-time.
Color-Coded Bars: To make the current trend immediately obvious, the chart's price bars can be colored. Green bars signify a bullish bias (Fast > Slow), while red bars signify a bearish bias (Fast < Slow).
Crossover Markers (Optional): While the indicator is not a signal provider, it can optionally display "Buy" (up arrow) and "Sell" (down arrow) markers when the MAs cross. These should not be interpreted as direct trade signals. Instead, they serve as alerts that the market momentum may be shifting on the current timeframe. They are best used as points of interest or for confirming a thesis that is already supported by the HTF bias.
Summary
In essence, the Market Bias indicator is a decision-support tool. It encourages a disciplined, top-down approach to trading.
Use the HTF Table first to establish your strategic directional bias for the day or week.
Use the on-chart MAs and colored bars to analyze the trend on your preferred trading timeframe.
Use the optional crossover markers only as a final confirmation or timing tool, ensuring they align with the dominant bias established by the higher timeframes.

Volume SMA with Multiple Overlays in Separate PaneVolume plays a pivotal role in our trading. Stock market price movements are randam until and unless same is supported by volume. Voulme is the only leding indicator and can track instituitional activity.
This indicator analyses volume to indentify unsual volumes in the market. it draws there sma lines of last 1200 barrs as follows:
1. sma of 1200 bars represented by blue
2. sma of 1200 bars multiplied by 15, represented by red
3. sma of 1200 bars multiplied by 20, represented by black.
The clor codes and line width can be modified.

Market Order Risk CalculatorObviously the Long/Short Position tool does this, but when you are scalping, 10 - 15 seconds matters. What matters more than that is defined risk, you dont want your losses being scattered, 300 here 145 there, you want consistent risk to have consistent data.
What this does is when you are framing a trade, it provides a hands off tool that tells you exactly how many contracts to enter with, that way if you have bracket orders on, your stop will be exactly where you want it to be without going over your defined risk.

Information Flow Analysis[b🔄 Information Flow Analysis: Systematic Multi-Component Market Analysis Framework
SYSTEM OVERVIEW AND ANALYTICAL FOUNDATION
The Information Flow Kernel - Hybrid combines established technical analysis methods into a unified analytical framework. This indicator systematically processes three distinct data streams - directional price momentum, volume-weighted pressure dynamics, and intrabar development patterns - integrating them through weighted mathematical fusion to produce statistically normalized market flow measurements.
COMPREHENSIVE MATHEMATICAL FRAMEWORK
Component 1: Directional Flow Analysis
The directional component analyzes price momentum through three mathematical vectors:
Price Vector: p = C - O (intrabar directional bias)
Momentum Vector: m = C_t - C_{t-1} (bar-to-bar velocity)
Acceleration Vector: a = m_t - m_{t-1} (momentum rate of change)
Directional Signal Integration:
S_d = \text{sgn}(p) \cdot |p| + \text{sgn}(m) \cdot |m| \cdot 0.6 + \text{sgn}(a) \cdot |a| \cdot 0.3
The signum function preserves directional information while absolute values provide magnitude weighting. Coefficients create a hierarchy emphasizing intrabar movement (100%), momentum (60%), and acceleration (30%).
Final Directional Output: K_1 = S_d \cdot w_d where w_d is the directional weight parameter.
Component 2: Volume-Weighted Pressure Analysis
Volume Normalization: r_v = \frac{V_t}{\overline{V_n}} where \overline{V_n} represents the n-period simple moving average of volume.
Base Pressure Calculation: P_{base} = \Delta C \cdot r_v \cdot w_v where \Delta C = C_t - C_{t-1} and w_v is the velocity weighting factor.
Volume Confirmation Function:
f(r_v) = \begin{cases}
1.4 & \text{if } r_v > 1.2 \
0.7 & \text{if } r_v < 0.8 \
1.0 & \text{otherwise}
\end{cases}
Final Pressure Output: K_2 = P_{base} \cdot f(r_v)
Component 3: Intrabar Development Analysis
Bar Position Calculation: B = \frac{C - L}{H - L} when H - L > 0 , else B = 0.5
Development Signal Function:
S_{dev} = \begin{cases}
2(B - 0.5) & \text{if } B > 0.6 \text{ or } B < 0.4 \
0 & \text{if } 0.4 \leq B \leq 0.6
\end{cases}
Final Development Output: K_3 = S_{dev} \cdot 0.4
Master Integration and Statistical Normalization
Weighted Component Fusion: F_{raw} = 0.5K_1 + 0.35K_2 + 0.15K_3
Sensitivity Scaling: F_{master} = F_{raw} \cdot s where s is the sensitivity parameter.
Statistical Normalization Process:
Rolling Mean: \mu_F = \frac{1}{n}\sum_{i=0}^{n-1} F_{master,t-i}
Rolling Standard Deviation: \sigma_F = \sqrt{\frac{1}{n}\sum_{i=0}^{n-1} (F_{master,t-i} - \mu_F)^2}
Z-Score Computation: z = \frac{F_{master} - \mu_F}{\sigma_F}
Boundary Enforcement: z_{bounded} = \max(-3, \min(3, z))
Final Normalization: N = \frac{z_{bounded}}{3}
Flow Metrics Calculation:
Intensity: I = |z|
Strength Percentage: S = \min(100, I \times 33.33)
Extreme Detection: \text{Extreme} = I > 2.0
DETAILED INPUT PARAMETER SPECIFICATIONS
Sensitivity (0.1 - 3.0, Default: 1.0)
Global amplification multiplier applied to the master flow calculation. Functions as: F_{master} = F_{raw} \cdot s
Low Settings (0.1 - 0.5): Enhanced precision for subtle market movements. Optimal for low-volatility environments, scalping strategies, and early detection of minor directional shifts. Increases responsiveness but may amplify noise.
Moderate Settings (0.6 - 1.2): Balanced sensitivity for standard market conditions across multiple timeframes.
High Settings (1.3 - 3.0): Reduced sensitivity to minor fluctuations while emphasizing significant flow changes. Ideal for high-volatility assets, trending markets, and longer timeframes.
Directional Weighting (0.1 - 1.0, Default: 0.7)
Controls emphasis on price direction versus volume and positioning factors. Applied as: K_{1,weighted} = K_1 \times w_d
Lower Values (0.1 - 0.4): Reduces directional bias, favoring volume-confirmed moves. Optimal for ranging markets where momentum may generate false signals.
Higher Values (0.7 - 1.0): Amplifies directional signals from price vectors and acceleration. Ideal for trending conditions where directional momentum drives price action.
Velocity Weighting (0.1 - 1.0, Default: 0.6)
Scales volume-confirmed price change impact. Applied in: P_{base} = \Delta C \times r_v \times w_v
Lower Values (0.1 - 0.4): Dampens volume spike influence, focusing on sustained pressure patterns. Suitable for illiquid assets or news-sensitive markets.
Higher Values (0.8 - 1.0): Amplifies high-volume directional moves. Optimal for liquid markets where volume provides reliable confirmation.
Volume Length (3 - 20, Default: 5)
Defines lookback period for volume averaging: \overline{V_n} = \frac{1}{n}\sum_{i=0}^{n-1} V_{t-i}
Short Periods (3 - 7): Responsive to recent volume shifts, excellent for intraday analysis.
Long Periods (13 - 20): Smoother averaging, better for swing trading and higher timeframes.
DASHBOARD SYSTEM
Primary Flow Gauge
Bilaterally symmetric visualization displaying normalized flow direction and intensity:
Segment Calculation: n_{active} = \lfloor |N| \times 15 \rfloor
Left Fill: Bearish flow when N < -0.01
Right Fill: Bullish flow when N > 0.01
Neutral Display: Empty segments when |N| \leq 0.01
Visual Style Options:
Matrix: Digital blocks (▰/▱) for quantitative precision
Wave: Progressive patterns (▁▂▃▄▅▆▇█) showing flow buildup
Dots: LED-style indicators (●/○) with intensity scaling
Blocks: Modern squares (■/□) for professional appearance
Pulse: Progressive markers (⎯ to █) emphasizing intensity buildup
Flow Intensity Visualization
30-segment horizontal bar graph with mathematical fill logic:
Segment Fill: For i \in : filled if \frac{i}{29} \leq \frac{S}{100}
Color Coding System:
Orange (S > 66%): High intensity, strong directional conviction
Cyan (33% ≤ S ≤ 66%): Moderate intensity, developing bias
White (S < 33%): Low intensity, neutral conditions
Extreme Detection Indicators
Circular markers flanking the gauge with state-dependent illumination:
Activation: I > 2.0 \land |N| > 0.3
Bright Yellow: Active extreme conditions
Dim Yellow: Normal conditions
Metrics Display
Balance Value: Raw master flow output ( F_{master} ) showing absolute directional pressure
Z-Score Value: Statistical deviation ( z_{bounded} ) indicating historical context
Dynamic Narrative System
Context-sensitive interpretation based on mathematical thresholds:
Extreme Flow: I > 2.0 \land |N| > 0.6
Moderate Flow: 0.3 < |N| \leq 0.6
High Volatility: S > 50 \land |N| \leq 0.3
Neutral State: S \leq 50 \land |N| \leq 0.3
ALERT SYSTEM SPECIFICATIONS
Mathematical Trigger Conditions:
Extreme Bullish: I > 2.0 \land N > 0.6
Extreme Bearish: I > 2.0 \land N < -0.6
High Intensity: S > 80
Bullish Shift: N_t > 0.3 \land N_{t-1} \leq 0.3
Bearish Shift: N_t < -0.3 \land N_{t-1} \geq -0.3
TECHNICAL IMPLEMENTATION AND PERFORMANCE
Computational Architecture
The system employs efficient calculation methods minimizing processing overhead:
Single-pass mathematical operations for all components
Conditional visual rendering (executed only on final bar)
Optimized array operations using direct calculations
Real-Time Processing
The indicator updates continuously during bar formation, providing immediate feedback on changing market conditions. Statistical normalization ensures consistent interpretation across varying market regimes.
Market Applicability
Optimal performance in liquid markets with consistent volume patterns. May require parameter adjustment for:
Low-volume or after-hours sessions
News-driven market conditions
Highly volatile cryptocurrency markets
Ranging versus trending market environments
PRACTICAL APPLICATION FRAMEWORK
Market State Classification
This indicator functions as a comprehensive market condition assessment tool providing:
Trend Analysis: High intensity readings ( S > 66% ) with sustained directional bias indicate strong trending conditions suitable for momentum strategies.
Reversal Detection: Extreme readings ( I > 2.0 ) at key technical levels may signal potential trend exhaustion or reversal points.
Range Identification: Low intensity with neutral flow ( S < 33%, |N| < 0.3 ) suggests ranging market conditions suitable for mean reversion strategies.
Volatility Assessment: High intensity without clear directional bias indicates elevated volatility with conflicting pressures.
Integration with Trading Systems
The normalized output range facilitates integration with automated trading systems and position sizing algorithms. The statistical basis provides consistent interpretation across different market conditions and asset classes.
LIMITATIONS AND CONSIDERATIONS
This indicator combines established technical analysis methods and processes historical data without predicting future price movements. The system performs optimally in liquid markets with consistent volume patterns and may produce false signals in thin trading conditions or during news-driven market events. This indicator is provided for educational and analytical purposes only and does not constitute financial advice. Users should combine this analysis with proper risk management, position sizing, and additional confirmation methods before making any trading decisions. Past performance does not guarantee future results.
Note: The term "kernel" in this context refers to modular calculation components rather than mathematical kernel functions in the formal computational sense.
As quantitative analyst Ralph Vince noted: "The essence of successful trading lies not in predicting market direction, but in the systematic processing of market information and the disciplined management of probability distributions."
— Dskyz, Trade with insight. Trade with anticipation.

ORB + SMA + EMA + BUY/SELL by yuvaraj ORB (Opening Range Breakout)
Meaning:
ORB stands for Opening Range Breakout.
It is a trading strategy where you watch the price movement for the first few minutes after the market opens (for example, 9:15 – 9:30 AM in India).
You mark the high and low during this period.
If price goes above the high, it signals a possible buy (long trade).
If price goes below the low, it signals a possible sell (short trade).
Why traders use it:
First few minutes decide the market direction.
Helps catch early momentum trades.
Very popular for intraday traders (Nifty, BankNifty, Crude Oil, etc.).
Example:
Market opens at 9:15.
First 5 minutes: High = 100, Low = 95.
If price moves above 100 → Buy.
If price moves below 95 → Sell.
📌 SMA (Simple Moving Average)
Meaning:
SMA stands for Simple Moving Average.
It is the average closing price of a stock over a certain number of candles.
Example:
SMA 9 → Average price of last 9 candles.
SMA 50 → Average price of last 50 candles.
Why traders use it:
Shows trend direction.
SMA going up → Uptrend, SMA going down → Downtrend.
You can use multiple SMAs (for example SMA 9 and SMA 50):
If SMA 9 crosses above SMA 50 → Buy signal.
If SMA 9 crosses below SMA 50 → Sell signal.
🔑 Key Difference:
Feature ORB SMA
Type Strategy (price breakout) Indicator (average price)
Use Entry trigger for trades Identifies trend direction
Works Best Intraday (first minutes) Any timeframe (intraday or swing)
Plots ORB High/Low lines for the first few minutes
Plots SMA 9/50/180 & EMA 20
Plots trailing stopline + Buy/Sell arrows
Optional bar color / background color toggle
Alert conditions for Buy/Sell
ORB high/low lines
SMA 9/50/180 + EMA 20
Buy/Sell arrows + trailing stopline

Hull UT Bot Strategy - UT Main + Hull ConfirmThis strategy merges the strengths of the Hull Moving Average (HMA) Suite and the UT Bot Alerts indicator to create a trend-following system with reduced signal noise. The UT Bot acts as the primary signal generator, using an ATR-based trailing stop to identify momentum shifts and potential entry points. These signals are then filtered by the Hull Suite for trend confirmation: long entries require a UT Bot buy signal aligned with a bullish (green) Hull band, while short entries need a UT Bot sell signal with a bearish (red) Hull band. This combination aims to capture high-probability swings while avoiding whipsaws in choppy markets.The Hull Suite provides a responsive, smoothed moving average (configurable as HMA, EHMA, or THMA) that colors its band based on trend direction, offering a visual and logical filter for the faster UT Bot signals. The result is a versatile strategy suitable for swing trading on timeframes like 1H or 4H, with options for higher timeframe Hull overlays for scalping context. It includes backtesting capabilities via Pine Script's strategy functions, plotting confirmed signals, raw UT alerts (for reference), and the trailing stop line.Key benefits:Noise Reduction: Hull confirmation eliminates ~50-70% of false UT Bot signals in ranging markets (based on typical backtests).
Trend Alignment: Ensures entries follow the broader momentum defined by the Hull band.
Customization: Adjustable sensitivity for different assets (e.g., forex, stocks, crypto).
How It WorksUT Bot Core: Calculates an ATR trailing stop (sensitivity via "Key Value"). A buy signal triggers when price crosses above the stop (bullish momentum), and sell when below (bearish).
Hull Filter: The Hull band is green if current Hull > Hull (bullish), red otherwise. Signals only fire on alignment.
Entries: Long on confirmed UT buy + green Hull; Short on confirmed UT sell + red Hull. No explicit exits—relies on opposite signals for reversal.
Visuals: Plots Hull band, UT trailing stop, confirmed labels (Long/Short), and optional raw UT circles. Bar colors reflect UT position, tinted by confirmation.
Alerts: Triggers on confirmed long/short for automated notifications.
This setup performs well in trending markets but may lag in strong reversals—pair with risk management (e.g., 1-2% per trade).Recommended Settings Use these as starting points; optimize via back testing on your asset/timeframe.
-Hull Variation
Hma
Standard Hull for responsiveness; switch to EHMA for smoother crypto, THMA for volatile stocks.
-Hull Length
55
Balances swing detection; use 180-200 for dynamic S/R levels on higher TFs.
-Hull Length Multiplier
1.0
Keep at 1 for native TF; >1 for HTF straight bands (e.g., 2 for 2x smoothing).
-Show Hull from HTF
False
Enable for scalping (e.g., 1m chart with 15m Hull); set HTF to "15" or "240".
-Color Hull by Trend
True
Visual trend cue; disable for neutral orange line.
-Color Candles by Hull
False
Enable for trend visualization; conflicts with UT bar colors if True.
-Show Hull as Band
True
Fills area for clear up/down zones; set transparency to 40-60.
-Hull Line Thickness
1-2
Thinner for clean charts; 2+ for emphasis.
-UT Bot Key Value
1
Default sensitivity (ATR multiple); 0.5 for aggressive signals, 2 for conservative.
-UT Bot ATR Period
10
Standard volatility window; 14 for longer swings, 5 for intraday.
-UT Signals from HA
False
Use True for smoother signals in noisy markets (Heikin Ashi close).
Backtesting Tips: Test on liquid pairs like EURUSD (1H) or BTCUSD (4H) with 1% equity risk. Expect win rates ~45-60% in trends, with 1.5-2:1 reward:risk. Adjust Key Value down for more trades, Hull Length up for fewer.

Trend-Strong Candle - 3 EMAs with Filters# Trend-Strong Candle - Professional Trading Indicator
## 📊 What It Does
Identifies high-probability entries by combining triple EMA trend analysis with strong candle detection. Only signals when all conditions align for maximum accuracy.
## 🎯 Core Features
- Triple EMA System: Fast (20) / Medium (50) / Slow (200) for trend confirmation
- Strong Candle Filter: ATR-based sizing ensures genuine momentum
- Advanced Filters: EMA close validation + trend stability checks
- Live Alerts: Instant notifications for real-time signals
- Session Filter: Trade only during active EU/US market hours
## ⚡ Quick Setup
Scalping (1-5min): Default settings + enable session filter
Day Trading (15-60min): Default settings work perfectly
Swing Trading (4H+): Increase ATR multiplier to 0.8-1.0
## 📈 Trading Rules
Long Signals: Green triangle below candle
- Strong bullish candle during confirmed uptrend
- All EMAs properly aligned (Fast > Medium > Slow)
Short Signals: Red triangle above candle
- Strong bearish candle during confirmed downtrend
- All EMAs properly aligned (Fast < Medium < Slow)
## ⚠️ Critical Success Factors
1. Always Verify the Trend Yourself
The indicator helps identify signals, but YOU must confirm the larger trend context. Check higher timeframes and overall market structure before entering.
2. Understand the "Big Players"
Strong candles in trend direction usually come from institutional money (banks, funds, algorithms). These create the momentum that retail traders can follow. The indicator catches these institutional moves.
3. Distance to Next Value Level
NEVER enter if price is too close to major resistance/support levels:
- Check distance to round numbers (1.1000, 1.1050, etc.)
- Ensure at least 20-30 pips room to next key level
- You need space for profit - tight levels = limited upside
4. Risk Management
- Stop Loss: 1-2 ATR from entry
- Take Profit: 2-3 ATR target (minimum 1:2 R/R)
- Position Size: Risk max 1-2% per trade
## 💡 Pro Tips
- Best Sessions: London open (8-12 UTC) and NY open (13-17 UTC)
- Avoid: Major news, low liquidity periods, choppy markets
- Multiple Timeframes: Confirm signals on higher timeframe
- Value Levels: Always check daily/weekly support/resistance before entering
## 🎯 Success Formula
Trend Confirmation + Strong Institutional Candle + Distance to Value Levels = High Probability Trade
*
Remember: The indicator finds the signals, but successful trading requires your analysis of trend context and value level positioning. Trade smart, not just frequent.

Bias + VWAP Pullback — v4 (PA + BOS/CHOCH)Simple idea: I identify the trend (bias) from the larger timeframe, and only trade pullbacks to the VWAP/EMA during liquidity (London/New York). When the trend is clear, gold moves strongly, and its pullbacks to the balance lines provide clear opportunities.
Timeframe and Sessions (Cairo Time)
Analysis: H1 to determine the trend.
Implementation: 5m (or 1m if professional).
Trading window:
London Opening: 10:00–12:30
New York Opening: 16:30–19:00
(avoid the rest of the day unless there is exceptional traffic).
Direction determination (BIAS)
On H1:
If the price is above the 200 EMA and the daily VWAP is bullish and the price is above it → uptrend (long-only).
If the price is below the 200 EMA and the daily VWAP is bearish and the price is below it → bearish trend (short-only).
Determine your levels: yesterday's high/low (PDH/PDL) + approximate Asia range (03:00–09:30).
Entry Rules (Setup A: Trend Continuation)
Asia range breakout towards Bias during liquidity window.
Wait for a withdrawal to:
Daily VWAP, or
EMA50 on 5m frame (best if both cross).
Confirmation: Confirmation low/high on 5m (HL buy/LH sell) + clear impulse candle (Body is greater than average of last 10 candles).
Entry:
Buy: When the price returns above VWAP/EMA50 with a confirmation candle close.
Sell: The exact opposite.
Stop Loss (SL): Below/above the last confirmation low/high or ATR(14, 5m) x 1.5 (largest).
Objectives:
TP1 = 1R (Close 50% and move the rest Break-even).
TP2 = 2.5R to 3R or at an important HTF level (PDH/PDL/Bid/Demand Zone).
Entry Rules (Setup B: Reversion to VWAP – “Mean Reversion”)
Use with extreme caution, once daily maximum:
Price deviation from VWAP by more than ~1.5 x ATR(14, 5m) with rejection candles appearing near PDH/PDL.
Reverse entry towards the return of VWAP.
SL small behind rejection top/bottom.
Main target: VWAP. (Don't get greedy — this scenario is for extended periods only.)
News Filtering and Risk Management
Avoid trading 15–30 minutes before/after strong US news (CPI, NFP, FOMC).
Maximum daily loss: 1.5–2% of account balance.
Risk per trade: 0.25–0.5% (if you are learning) or 0.5–1% (if you are experienced).
Do not exceed two consecutive losing trades per day.
Don't chase the market after the opportunity has passed — wait for the next pullback.
Smart Deal Management
After TP1: Move stop to entry point + trail the rest with EMA20 on 5m or ATR Trailing = ATR(14)×1.0.
If the price touches a strong daily level (PDH/PDL) and fails to break, consider taking additional profit.
If VWAP starts to flatten and breaks against the trend on H1, stop trading for the day.
Quick Checklist (Before Entry)
H1 trend is clear and consistent with 200EMA + VWAP.
Penetrating the Asia range towards Bias.
Clean pull to VWAP/EMA50 on 5m.
Confirmation candle and real push.
SL is logical (behind swing/ATR×1.5) and R :R ≥ 1:2.
No red news coming soon.
Example of "ready-made" settings
EMA: 20, 50, 200 on 5m, 200 only on H1.
VWAP: Daily (reset daily).
ATR: 14 on 5m.
Levels: PDH/PDL + Asia Band (03:00–09:30 Cairo).
Gold Notes
Gold is fast and sharp at the open; don't get in early — wait for the draw.
Fakeouts are common before news: it is best to call with the trend after the price returns above/below VWAP.
Don't expect 80% consistent wins every day — the advantage comes from discipline, filtering out bad days, and only withdrawing when you're on the right track.
تعتبر شركة الماسة الألمانية أحد المؤسسات العاملة بالمملكة العربية السعودية ولها تاريخ طويل من الخدمات الكثيرة والمتنوعة التى مازالت تقدمها للكثير من العملاء داخل جميع مدن وأحياء المملكة حيث نقدم أفضل ما لدينا من خلال مجموعة الشركات التالية والتي من خلالها ستتلقي كل ما تحتاج إلية في كل المجال المختلفة فنحن نعمل منذ عام 2015 ولنا سابقات اعمال فى مختلف المجالات الحيوية التى نخدم من خلالها عملائنا ونوفر لهم أرخص الأسعار وبأعلى جودة من الممكن توفرها فى المجالات التالية :-
خدمات تنظيف المنازل والفلل والشقق
خدمات عزل الخزانات تنظيف غسيل صيانة اصلاح
خدمات جلي البلاط والرخام والسيراميك
خدمات نقل العفش عمالة فلبينية مدربة
خدمات مكافحة الحشرات بجدة
كل هذة الخدمات وأكثر نوفرها لكل المتعاقدين بأفضل الطرق مع توفير خطط وبرامج متنوعة لأتمام العمل المسنود إلينا بأفضل وأحدث الطرق الحديثة والعصرية سواء فى شركات النظافة بجدة ومكة المكرمة أو شركات نقل العفش بجدة عمالة فلبينية وباقى الخدمات مثل جلي وتلميع الرخام بمكة وجدة ولا ننسي شركة مكافحة حشرات بجدة التى ساعدت آلاف المواطنين على تنظيف منازلهم من الحشرات بأفضل مبيدات حشرية.

Post 9/21 EMA Cross — Paint X Bars v2.0
# **Post 9/21 EMA Cross — Time Blocks & Session Colors**
This indicator highlights candles after a **9/21 EMA crossover**, but with extra controls that let you focus only on the sessions and time windows that matter to you.
---
## 🔑 What It Does
1. **EMA Cross Trigger**
* Bullish trigger: 9 EMA crosses above 21 EMA.
* Bearish trigger: 9 EMA crosses below 21 EMA.
2. **Bar Painting**
* After a valid cross, the indicator paints a set number of bars (you choose how many).
* You can require the **2nd bar to confirm momentum** (“displacement” filter) so weak signals are ignored.
3. **Time Block Control**
* Define up to **four custom time blocks** (like `08:00–09:30` or `12:00–13:00`).
* Painting only occurs inside those blocks if you enable the filter.
4. **Session-Aware Colors**
* Use one set of bullish/bearish colors for **regular hours**, another set for **pre-market**, and another for **post-market**.
* That way you can instantly see *when* the signal occurred.
---
## 🎨 Visuals
* Candles recolored in your chosen bull/bear colors.
* Optional EMA lines plotted on the chart for reference.
* Different colors for RTH, pre-market, and post-market activity.
---
## ⚙️ Inputs
* **EMA lengths (fast & slow)**
* **Number of bars to paint after a cross**
* **Displacement filter (loose or strict)**
* **Show/hide EMA lines**
* **Up to four custom time blocks** (on/off toggles + start/end times)
* **Bull/bear colors for RTH, Pre, Post**
---
## 📈 Why Use It
* **Clarity** – Only shows cross signals in the hours you actually trade.
* **Focus** – Different colors remind you at a glance whether the move was in pre-market, RTH, or post-market.
* **Discipline** – The optional 2nd-bar displacement filter prevents false starts by requiring real momentum.
---
## 🚨 Practical Use
* Treat the painted window as a **momentum phase**: enter on confirmation, manage risk while bars are painted, and stand aside once painting ends.
* Restrict painting to time blocks that match your personal trading routine (e.g., open drive 09:30–10:00, or late-day momentum 15:00–16:00).
* Use session colors to keep pre/post-market action separate from regular session strategies.

ATR Future Movement Range Projection
The "ATR Future Movement Range Projection" is a custom TradingView Pine Script indicator designed to forecast potential price ranges for a stock (or any asset) over short-term (1-month) and medium-term (3-month) horizons. It leverages the Average True Range (ATR) as a measure of volatility to estimate how far the price might move, while incorporating recent momentum bias based on the proportion of bullish (green) vs. bearish (red) candles. This creates asymmetric projections: in bullish periods, the upside range is larger than the downside, and vice versa.
The indicator is overlaid on the chart, plotting horizontal lines for the projected high and low prices for both timeframes. Additionally, it displays a small table in the top-right corner summarizing the projected prices and the percentage change required from the current close to reach them. This makes it useful for traders assessing potential targets, risk-reward ratios, or option strategies, as it combines volatility forecasting with directional sentiment.
Key features:
- **Volatility Basis**: Uses weekly ATR to derive a stable daily volatility estimate, avoiding noise from shorter timeframes.
- **Momentum Adjustment**: Analyzes recent candle colors to tilt projections toward the prevailing trend (e.g., more upside if more green candles).
- **Time Horizons**: Fixed at 1 month (21 trading days) and 3 months (63 trading days), assuming ~21 trading days per month (excluding weekends/holidays).
- **User Adjustable**: The ATR length/lookback (default 50) can be tweaked via inputs.
- **Visuals**: Green/lime lines for highs, red/orange for lows; a semi-transparent table for quick reference.
- **Limitations**: This is a probabilistic projection based on historical volatility and momentum—it doesn't predict direction with certainty and assumes volatility persists. It ignores external factors like news, earnings, or market regimes. Best used on daily charts for stocks/ETFs.
The indicator doesn't generate buy/sell signals but helps visualize "expected" ranges, similar to how implied volatility informs option pricing.
### How It Works Step-by-Step
The script executes on each bar update (typically daily timeframe) and follows this logic:
1. **Input Configuration**:
- ATR Length (Lookback): Default 50 bars. This controls both the ATR calculation period and the candle count window. You can adjust it in the indicator settings.
2. **Calculate Weekly ATR**:
- Fetches the ATR from the weekly timeframe using `request.security` with a length of 50 weeks.
- ATR measures average price range (high-low, adjusted for gaps), representing volatility.
3. **Derive Daily ATR**:
- Divides the weekly ATR by 5 (approximating 5 trading days per week) to get an equivalent daily volatility estimate.
- Example: If weekly ATR is $5, daily ATR ≈ $1.
4. **Define Projection Periods**:
- 1 Month: 21 trading days.
- 3 Months: 63 trading days (21 × 3).
- These are hardcoded but based on standard trading calendar assumptions.
5. **Compute Base Projections**:
- Base projection = Daily ATR × Days in period.
- This gives the total expected movement (range) without direction: e.g., for 3 months, $1 daily ATR × 63 = $63 total range.
6. **Analyze Candle Momentum (Win Rate)**:
- Counts green candles (close > open) and red candles (close < open) over the last 50 bars (ignores dojis where close == open).
- Total colored candles = green + red.
- Win rate = green / total colored (as a fraction, e.g., 0.7 for 70%). Defaults to 0.5 if no colored candles.
- This acts as a simple momentum proxy: higher win rate implies bullish bias.
7. **Adjust Projections Asymmetrically**:
- Upside projection = Base projection × Win rate.
- Downside projection = Base projection × (1 - Win rate).
- This skews the range: e.g., 70% win rate means 70% of the total range allocated to upside, 30% to downside.
8. **Calculate Projected Prices**:
- High = Current close + Upside projection.
- Low = Current close - Downside projection.
- Done separately for 1M and 3M.
9. **Plot Lines**:
- 3M High: Solid green line.
- 3M Low: Solid red line.
- 1M High: Dashed lime line.
- 1M Low: Dashed orange line.
- Lines extend horizontally from the current bar onward.
10. **Display Table**:
- A 3-column table (Projection, Price, % Change) in the top-right.
- Rows for 1M High/Low and 3M High/Low, color-coded.
- % Change = ((Projected price - Close) / Close) × 100.
- Updates dynamically with new data.
The entire process repeats on each new bar, so projections evolve as volatility and momentum change.
### Examples
Here are two hypothetical examples using the indicator on a daily chart. Assume it's applied to a stock like AAPL, but with made-up data for illustration. (In TradingView, you'd add the script to see real outputs.)
#### Example 1: Bullish Scenario (High Win Rate)
- Current Close: $150.
- Weekly ATR (50 periods): $10 → Daily ATR: $10 / 5 = $2.
- Last 50 Candles: 35 green, 15 red → Total colored: 50 → Win Rate: 35/50 = 0.7 (70%).
- Base Projections:
- 1M: $2 × 21 = $42.
- 3M: $2 × 63 = $126.
- Adjusted Projections:
- 1M Upside: $42 × 0.7 = $29.4 → High: $150 + $29.4 = $179.4 (+19.6%).
- 1M Downside: $42 × 0.3 = $12.6 → Low: $150 - $12.6 = $137.4 (-8.4%).
- 3M Upside: $126 × 0.7 = $88.2 → High: $150 + $88.2 = $238.2 (+58.8%).
- 3M Downside: $126 × 0.3 = $37.8 → Low: $150 - $37.8 = $112.2 (-25.2%).
- On the Chart: Green/lime lines skewed higher; table shows bullish % changes (e.g., +58.8% for 3M high).
- Interpretation: Suggests stronger potential upside due to recent bullish momentum; useful for call options or long positions.
#### Example 2: Bearish Scenario (Low Win Rate)
- Current Close: $50.
- Weekly ATR (50 periods): $3 → Daily ATR: $3 / 5 = $0.6.
- Last 50 Candles: 20 green, 30 red → Total colored: 50 → Win Rate: 20/50 = 0.4 (40%).
- Base Projections:
- 1M: $0.6 × 21 = $12.6.
- 3M: $0.6 × 63 = $37.8.
- Adjusted Projections:
- 1M Upside: $12.6 × 0.4 = $5.04 → High: $50 + $5.04 = $55.04 (+10.1%).
- 1M Downside: $12.6 × 0.6 = $7.56 → Low: $50 - $7.56 = $42.44 (-15.1%).
- 3M Upside: $37.8 × 0.4 = $15.12 → High: $50 + $15.12 = $65.12 (+30.2%).
- 3M Downside: $37.8 × 0.6 = $22.68 → Low: $50 - $22.68 = $27.32 (-45.4%).
- On the Chart: Red/orange lines skewed lower; table highlights larger downside % (e.g., -45.4% for 3M low).
- Interpretation: Indicates bearish risk; might prompt protective puts or short strategies.
#### Example 3: Neutral Scenario (Balanced Win Rate)
- Current Close: $100.
- Weekly ATR: $5 → Daily ATR: $1.
- Last 50 Candles: 25 green, 25 red → Win Rate: 0.5 (50%).
- Projections become symmetric:
- 1M: Base $21 → Upside/Downside $10.5 each → High $110.5 (+10.5%), Low $89.5 (-10.5%).
- 3M: Base $63 → Upside/Downside $31.5 each → High $131.5 (+31.5%), Low $68.5 (-31.5%).
- Interpretation: Pure volatility-based range, no directional bias—ideal for straddle options or range trading.
In real use, test on historical data: e.g., if past projections captured actual moves ~68% of the time (1 standard deviation for ATR), it validates the volatility assumption. Adjust the lookback for different assets (shorter for volatile cryptos, longer for stable blue-chips).

Hilly's Reversal Scalping Strategy - 5 Min CandlesHow to Use
Copy the Code: Copy the script above.
Paste in TradingView: Open TradingView, go to the Pine Editor (bottom of the chart), paste the code, and click “Add to Chart.”
Set Timeframe: Ensure the chart is set to 5-minute candles (TradingView: right-click chart > Timeframe > 5 Minutes).
Check for Errors: Verify no errors appear in the Pine Editor console.
Apply to Chart: Use a liquid crypto pair (e.g., BTC/USDT, ETH/USDT on Binance or Coinbase).
Verify Signals:
Green “BUY” labels and triangle-up arrows for bullish reversals (e.g., bullish engulfing, hammer, doji, morning star, three white soldiers, double bottom in a downtrend).
Red “SELL” labels and triangle-down arrows for bearish reversals (e.g., bearish engulfing, shooting star, doji, evening star, three black crows, double top in an uptrend).
Green/red background highlights for signal candles.
Backtest: Use TradingView’s Strategy Tester to evaluate performance over 1–3 months, checking Net Profit, Win Rate, and Drawdown.
Demo Test: Run on a demo account to confirm signal visibility and performance before trading with real funds.
Troubleshooting
If Errors Occur: If any errors appear in TradingView’s Pine Editor console (e.g., “Syntax error” or “Invalid argument”), please share the exact error messages to diagnose environment-specific issues.
Signal Overload: If too many signals appear, increase patternLookback to 15 or set volFilter = volume > volMa * 2.0.
Missed Signals: If signals are too rare, set useVolumeFilter=false or reduce patternLookback to 5.
Additional Features: If you need alerts, other indicators (e.g., EMA, RSI), or dynamic arrow sizing, please specify. Note that dynamic sizing caused errors previously, so I’ve kept size=size.normal.

Complexity v3.2Complex Trend Analyzer v6.1 v3.2
Advanced multi-indicator trend analysis with dynamic timeframe adaptation!
Overview:
This sophisticated indicator combines multiple technical analysis tools for comprehensive trend analysis. It features EMA crossovers, RSI momentum, MACD signals, Bollinger Bands, volume analysis, divergence detection, and multi-timeframe analysis with dynamic parameter adaptation based on market volatility.
Key Features:
✅ Multi-Indicator Analysis - EMA, RSI, MACD, Bollinger Bands, Volume, ATR
✅ Divergence Detection - Bullish and bearish divergence with strength calculation
✅ Dynamic Timeframe Adaptation - Parameters adjust automatically based on timeframe
✅ Trend Tracking - Complete trend lifecycle with BUY/SELL/END signals
✅ Multi-Timeframe Analysis - M5, M15, M30 trend comparison
✅ Risk Management - Volatility filtering and warning system
✅ Visual Clarity - Clean labels, trend lines, and information table
How It Works:
The indicator uses a weighted scoring system:
• EMA (2.0) - Primary trend direction
• RSI (1.5) - Momentum confirmation
• MACD (1.5) - Trend momentum
• Bollinger Bands (1.0) - Volatility context
• Volume (1.0) - Volume confirmation
• Price Action (0.5 each) - Higher highs/lows
Signal Logic:
• BUY - Weighted score > threshold + filters passed
• SELL - Weighted score > threshold + filters passed
• END - Trend reversal conditions met
Visual Elements:
• 🟢 BUY - Green label with trend tracking
• 🔴 SELL - Red label with trend tracking
• ⚫ END - Gray label marking trend end
• × BUY - Green crosses for bullish divergence
• × SELL - Red crosses for bearish divergence
• ⚠️ - Warning signals for trend reversals
Information Table:
Real-time display showing:
• ATR volatility with signal (HIGH/MED/LOW/NORMAL VOL)
• Divergence status with strength percentage
• BUY/SELL signal count and overall signal
• Multi-Timeframe analysis (M5, M15, M30)
• Current trend with strength percentage
• Detailed trend strength analysis
Dynamic Adaptation:
Parameters automatically adjust based on timeframe:
• M1 - Fastest reaction (1.5-7.5 bars)
• M3 - Quick response (2-10 bars)
• M5 - Standard setting (3-15 bars)
• M15 - Slower, more reliable (4-20 bars)
Settings:
• EMA - Fast (9), Slow (21), Trend (50)
• RSI - Length (14), Overbought (70), Oversold (30)
• MACD - Fast (12), Slow (26), Signal (9)
• Bollinger Bands - Length (20), Multiplier (2.0)
• ATR - Length (14) for volatility measurement
• Volume Threshold - 1.5x average volume
Best Practices:
🎯 Works best in trending markets
📊 Use as overlay on main chart
⚡ Combine with price action analysis
🛡️ Always use proper risk management
🔍 Watch for divergence signals
⚠️ Pay attention to warning signals
Pro Tips:
• Green background = Strong uptrend, Red background = Strong downtrend
• Orange background = Risk zone (high volatility/RSI extremes)
• × marks indicate divergence opportunities
• ⚠️ warnings signal potential trend reversals
• Use multi-timeframe analysis for confirmation
• Monitor the information table for comprehensive market view
Alerts:
• BUY Alert - "BUY signal detected"
• SELL Alert - "SELL signal detected"
• Divergence Alert - "Divergence detected"
• Warning Alert - "Trend warning"
Version 3.2 Improvements:
• Enhanced multi-indicator analysis
• Improved divergence detection with strength calculation
• Advanced dynamic timeframe adaptation
• Comprehensive risk management system
• Professional visual presentation
• Weighted scoring system for better accuracy
Created with ❤️ for the trading community
This indicator is free to use for both commercial and non-commercial purposes.

Multiplied and Divided Moving Average ### Multiplied and Divided Moving Average Indicator
**Description**:
The "Multiplied and Divided Moving Average" indicator is a customizable tool for TradingView users, designed to create dynamic bands around a user-selected moving average (MA). It calculates a moving average (SMA, EMA, WMA, VWMA, or RMA) and generates a user-defined number of lines above and below it by multiplying and dividing the MA by linearly spaced factors. These bands serve as potential support and resistance levels, aiding in trend identification, mean reversion strategies, or breakout detection. Optional Buy/Sell labels appear when the price crosses below the divided MAs (Buy) or above the multiplied MAs (Sell), providing clear visual cues for trading opportunities.
**Key Features**:
- **Flexible MA Types**: Choose from Simple (SMA), Exponential (EMA), Weighted (WMA), Volume-Weighted (VWMA), or Running (RMA) moving averages.
- **Customizable Bands**: Set the number of lines (0–10) above and below the MA, allowing tailored analysis for any market or timeframe.
- **Dynamic Factors**: Bands are created using factors that scale linearly from 1 to a user-defined maximum (default: 5.0), creating intuitive overbought/oversold zones.
- **Buy/Sell Signals**: Optional labels highlight potential entry (Buy) and exit (Sell) points when the price crosses the bands.
- **Clear Visuals**: The main MA is plotted in blue, with green (multiplied) and red (divided) lines using graduated transparency for easy differentiation.
**Inputs**:
- **MA Type**: Select the moving average type (default: SMA).
- **MA Length**: Set the MA period (default: 14).
- **Number of Lines Above/Below**: Choose how many bands to plot above and below the MA (default: 4, range: 0–10).
- **Max Factor**: Define the largest multiplier/divisor for the outermost bands (default: 5.0).
- **Source**: Select the price data for the MA (default: close).
- **Show Buy/Sell Labels**: Enable or disable Buy/Sell labels (default: true).
**How It Works**:
1. Calculates the chosen moving average based on user inputs.
2. Creates up to 10 lines above the MA (e.g., MA × 2, ×3, ×4, ×5 for `numLines=4`, `maxFactor=5`) and 10 below (e.g., MA ÷ 2, ÷3, ÷4, ÷5).
3. Plots the main MA in blue, multiplied lines in green, and divided lines in red, with transparency increasing for outer bands.
4. If enabled, displays "Buy" labels when the price crosses below any divided MA and "Sell" labels when it crosses above any multiplied MA, positioned at the outermost band.
**Use Cases**:
- **Trend Analysis**: Use the bands as dynamic support/resistance to confirm trend direction or reversals.
- **Mean Reversion**: Identify overbought (near multiplied MAs) or oversold (near divided MAs) conditions.
- **Breakout Trading**: Monitor price crossovers of the outermost bands for potential breakout signals.
- **Signal Confirmation**: Use Buy/Sell labels for swing trading or to complement other indicators.
**How to Use**:
1. Copy the script into TradingView’s Pine Editor.
2. Compile and apply it to your chart (e.g., stocks, forex, crypto).
3. Adjust inputs like `numLines`, `maxFactor`, or `maType` to fit your strategy.
4. Enable `Show Buy/Sell Labels` to visualize trading signals.
5. Test on various timeframes (e.g., 1H, 4H, 1D) and assets to optimize settings.
**Example Settings**:
- **Swing Trading**: Use `numLines=3`, `maxFactor=4`, `maType=EMA`, `maLength=20` on a 4-hour chart.
- **Intraday**: Try `numLines=2`, `maxFactor=3`, `maType=SMA`, `maLength=10` on a 15-minute chart.
**Notes**:
- **Performance**: Supports up to 20 bands (10 above, 10 below), staying within TradingView’s 64-plot limit.
- **False Signals**: In choppy markets, frequent crossovers may occur. Combine with trend filters (e.g., ADX, higher-timeframe MA) to reduce noise.
- **Enhancements**: Add alerts via TradingView’s alert system for Buy/Sell signals, or experiment with different `maxFactor` values for volatility.
**Limitations**:
- Bands are reactive, as they’re based on a moving average, so confirm signals with other indicators.
- High `numLines` values may clutter the chart; use 2–4 for clarity.
- Signals may lag in fast-moving markets due to the MA’s smoothing effect.
This indicator is perfect for traders seeking a customizable, visually clear tool to enhance technical analysis on TradingView. For support, feature requests (e.g., alerts, custom colors), or community discussion, visit TradingView’s forums or contact the script author.

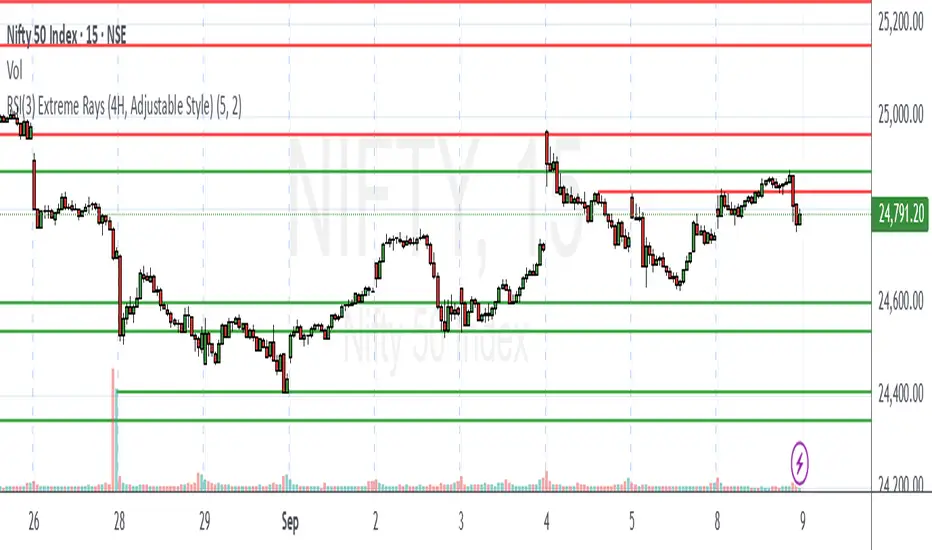
Chanpreet RSI(3) Extreme Rays (4H, Adjustable Style)Chanpreet RSI(3) Extreme Rays (4H)
This indicator applies a short-length RSI (3) on the 4-hour timeframe and highlights momentum extremes directly on the chart.
🔎 What it does
Detects when RSI(3) moves into overbought (>80) or oversold (<20) territory.
Groups consecutive candles inside these zones into one “event” instead of marking each bar individually.
For each event:
• In overbought → records the highest high of the stretch and marks it with a horizontal ray.
• In oversold → records the lowest low of the stretch and marks it with a horizontal ray.
Keeps only the most recent N rays (default 5, adjustable).
⚙️ Inputs
Max Rays to Keep → how many unique events are kept visible.
Ray Thickness → adjust line thickness.
Overbought Ray Color → default red.
Oversold Ray Color → default green.
📈 How to use
Apply on any chart; RSI(3) values are always calculated from 4H data (via request.security).
Use rays as reference levels that highlight recent momentum extremes or exhaustion zones.
This is not a buy/sell signal by itself — combine with your own analysis, confirmation tools, and risk management.
Best Recommended time frame is 5 mins, 10 mins & 15 mins for intraday trading.
🧩 Unique features
Groups multiple bars into a single clean ray, reducing clutter.
Uses 4H RSI(3) regardless of the chart’s active timeframe.
Fully customizable appearance (colors, thickness, max events).
⚠️ Disclaimer
This script is provided for educational and informational purposes only.
It does not constitute financial advice or guarantee performance.
Always test thoroughly and use proper risk management before trading live.
Custom Time Range HighlightThis indicator highlights specific time ranges on your TradingView chart with customizable background colors and labels, making it easier to identify key trading sessions and ICT (Inner Circle Trader) Killzones. It is designed for traders who want to mark important market hours, such as major sessions (Asia, New York, London) or high-volatility Killzones, with full control over activation, timing, colors, and transparency.
Features
Customizable Time Ranges: Define up to 9 different time ranges, including one custom range, three major market sessions (Asia, New York, London), and five ICT Killzones (Asia, NY Open, NY Close, London Open, London Close).
Individual Activation: Enable or disable each time range independently via checkboxes in the settings. By default, only the ICT Killzones are active.
Custom Colors and Transparency: Set unique background and label colors for each range, with adjustable transparency for both.
Labeled Time Ranges: Each active range is marked with a customizable label at the start of the period, displayed above the chart for easy identification.
Priority Handling: If multiple ranges overlap, the range with the higher number (e.g., Asia Killzone over Custom Range) determines the background color.
CET Time Zone: Time ranges are based on Central European Time (CET, Europe/Vienna). Adjust the hours and minutes to match your trading needs.
Settings
The indicator settings are organized into three groups for clarity:
Custom Range: A flexible range (default: 15:30–18:00 CET) for user-defined periods.
Session - Asia, NY, London: Major market sessions (Asia: 01:00–10:00, New York: 14:00–23:00, London: 09:00–18:00 CET).
ICT Killzones - Asia, NY, London: High-volatility periods (NY Open: 13:00–16:00, NY Close: 20:00–23:00, London Open: 08:00–11:00, London Close: 16:00–18:00, Asia: 02:00–05:00 CET).
For each range, you can:
Toggle activation (default: only ICT Killzones enabled).
Adjust start and end times (hours and minutes).
Customize the label text.
Choose background and label colors with transparency levels (0–100).
How to Use
Add the indicator to your chart.
Open the settings to enable/disable specific ranges, adjust their times, or customize colors and labels.
The chart will highlight active time ranges with the selected background colors and display labels at the start of each range.
Use it to focus on key trading periods, such as ICT Killzones for high-probability setups or major sessions for market analysis.
Notes
Ensure your time ranges align with your trading instrument’s session times.
Overlapping ranges prioritize higher-numbered ranges (e.g., Asia Killzone overrides London Session).
Ideal for day traders, scalpers, or ICT strategy followers who need clear visual cues for specific market hours.
Feedback
If you have suggestions for improvements or need help with customization, feel free to leave a comment or contact the author!

Relative Volume (RVOL) + Average Volume [AZ]The script helps you instantly see whether today’s volume is unusual compared to the past (relative volume). It’s built for breakout/fakeout filters, like the 15-minute ORB strategy you’re running.
Multi-AVWAP - Anchored - Gold -V1This script uses multi-day anchored VWAP.
What it does
This study plots multiple Anchored VWAP (AVWAP) lines from recent session starts (1, 2, 3, 4, 5, 10, 15, 20, 30, 90).
from the anchor forward. Each line shows a live label with the line’s current value and the current price for quick distance checks.
Best practices
Use on intraday timeframes for session-anchored lines.
Ensure the chart has enough history loaded for the longest lookback (e.g., 90 days).
For crypto or 24×7 markets, set session to a 24h window (e.g., 0000-2359) and turn off the exclude-ETH toggle if you want full-time anchoring.
Limitations
Different exchanges/markets use different RTH windows—pick the one that matches your venue.
Corporate actions/volume adjustments can make small discrepancies across platforms.
If no RTH exists on the exact calendar day (holidays), the 90d line anchors to the most recent available RTH open before that date.
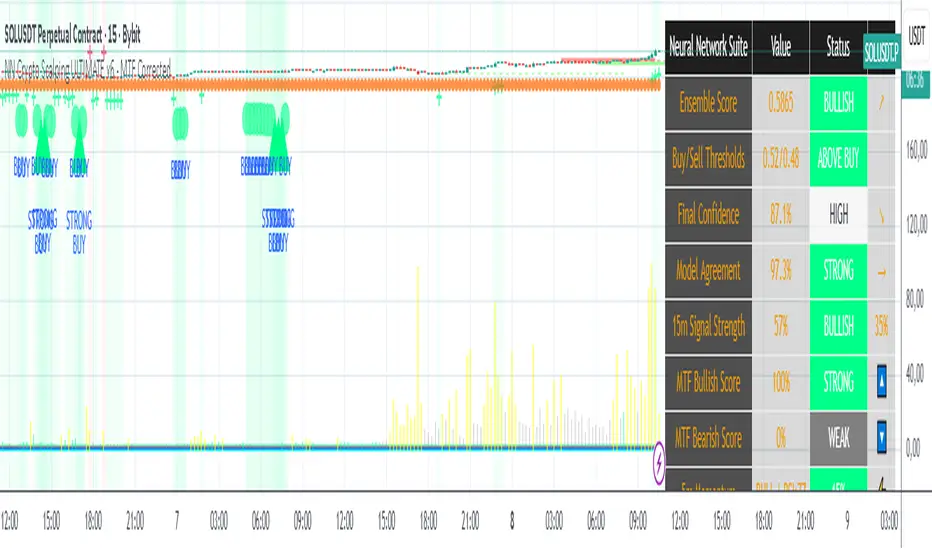
NN Crypto Scalping ULTIMATE v6 - MTF mapercivNeural Network Crypto Trading System v6.1
Complete Technical Documentation
Author
: Neural Network Ensemble Trading System
Version
: 6.1 - MTF Corrected & Bias Fixed
Date
: January 2025
Platform
: TradingView PineScript v6
Executive Summary
The
Neural Network Crypto Trading System v6.1
is an advanced algorithmic trading system that combines three specialized neural networks into an intelligent ensemble to generate cryptocurrency trading signals. The system integrates multi-timeframe analysis, crypto-specific optimizations, dynamic risk management, and continuous learning to maximize performance in highly volatile markets.
Key Features:
Ensemble of 3 specialized Neural Networks
(Primary, Momentum, Volatility)
Multi-Timeframe Analysis
with 5 timeframes (5m, 15m, 1h, 4h, 1D)
22 Advanced Features
for each model
Anti-repainting
guaranteed with confirmed data
8 Market Regime
automatic detections
6 Signal Levels
(Strong/Moderate/Weak Buy/Sell)
Professional dashboard
with 15+ real-time metrics
Intelligent alert system
with webhook integration
Volumatic Fair Value Gaps [BigBeluga]🔵 OVERVIEW
The Volumatic Fair Value Gaps indicator detects and plots size-filtered Fair Value Gaps (FVGs) and immediately analyzes the bullish vs. bearish volume composition inside each gap. When an FVG forms, the tool samples volume from a 10× lower timeframe , splits it into Buy and Sell components, and overlays two compact bars whose percentages always sum to 100%. Each gap also shows its total traded volume . A live dashboard (top-right) summarizes how many bullish and bearish FVGs are currently active and their cumulative volumes—offering a quick read on directional participation and trend pressure.
🔵 CONCEPTS
FVGs (Fair Value Gaps) : Imbalance zones between three consecutive candles where price “skips” trading. The script plots bullish and bearish gaps and extends them until mitigated.
Size Filtering : Only significant gaps (by relative size percentile) are drawn, reducing noise and emphasizing meaningful imbalances.
// Gap Filters
float diff = close > open ? (low - high ) / low * 100 : (low - high) / high *100
float sizeFVG = diff / ta.percentile_nearest_rank(diff, 1000, 100) * 100
bool filterFVG = sizeFVG > 15
Volume Decomposition : For each FVG, the indicator inspects a 10× lower timeframe and aggregates volume of bullish vs. bearish candles inside the gap’s span.
100% Split Bars : Two inline bars per FVG display the % Bull and % Bear shares; their total is always 100%.
Total Gap Volume : A numeric label at the right edge of the FVG shows the total traded volume associated with that gap.
Mitigation Logic : Gaps are removed when price closes through (or touches via high/low—user-selectable) the opposite boundary.
Dashboard Summary : Counts and sums the active bullish/bearish FVGs and their total volumes to gauge directional dominance.
🔵 FEATURES
Bullish & Bearish FVG plotting with independent color controls and visibility toggles.
Adaptive size filter (percentile-based) to keep only impactful gaps.
Lower-TF volume sampling at 10× faster resolution for more granular Buy/Sell breakdown.
Per-FVG volume bars : two horizontal bars showing Bull % and Bear % (sum = 100%).
Per-FVG total volume label displayed at the right end of the gap’s body.
Mitigation source option : choose close or high/low for removing/invalidating gaps.
Overlap control : older overlapped gaps are cleaned to avoid clutter.
Auto-extension : active gaps extend right until mitigated.
Dashboard : shows count of bullish/bearish gaps on chart and cumulative volume totals for each side.
Performance safeguards : caps the number of active FVG boxes to maintain responsiveness.
🔵 HOW TO USE
Turn on/off FVG types : Enable Bullish FVG and/or Bearish FVG depending on your focus.
Tune the filter : The script already filters by relative size; if you need fewer (stronger) signals, increase the percentile threshold in code or reduce the number of displayed boxes.
Choose mitigation source :
close — stricter; gap is removed when a closing price crosses the boundary.
high/low — more sensitive; a wick through the boundary mitigates the gap.
Read the per-FVG bars :
A higher Bull % inside a bullish gap suggests constructive demand backing the imbalance.
A higher Bear % inside a bearish gap suggests supply is enforcing the imbalance.
Use total gap volume : Larger totals imply more meaningful interest at that imbalance; confluence with structure/HTF levels increases relevance.
Watch the dashboard : If bullish counts and cumulative volume exceed bearish, market pressure is likely skewed upward (and vice versa). Combine with trend tools or market structure for entries/exits.
Optional: hide volume bars : Disable Volume Bars when you want a cleaner FVG map while keeping total volume labels and the dashboard.
🔵 CONCLUSION
Volumatic Fair Value Gaps blends precise FVG detection with lower-timeframe volume analytics to show not only where imbalances exist but also who powers them. The per-gap Bull/Bear % bars, total volume labels, and the cumulative dashboard together provide a fast, high-signal read on directional participation. Use the tool to prioritize higher-quality gaps, align with trend bias, and time mitigations or continuations with greater confidence.

Futures Key LevelsKey Levels — Sessions, Previous Ranges & Opens (Chicago-aligned sessions)
What it does
This indicator plots commonly used reference levels across multiple timeframes to help you frame the day and find confluence:
Sessions (Chicago TZ): London, New York, and Asia session high/low ranges.
Previous Period Ranges: Previous Day / Week / Month / Quarter / Year High/Low and optional Mid.
Opens: Current Daily / Weekly / Monthly / Quarterly / Yearly opens.
Intraday (4H): Previous 4-Hour High/Low + optional Mid.
Monday Range: Captures Monday’s High/Low (and optional Mid) to use as a weekly reference.
Price-scale markers: Optional markers that track key levels on the price scale without adding extra lines.
How it works (concepts & calculations)
Higher-timeframe values are retrieved using request.security() and update when a new period begins (e.g., previous day’s H/L become fixed at the start of the new day).
Session ranges are built from bar data within session windows using time(session, "America/Chicago"):
London: 02:00–05:00 CT
New York: 08:30–15:00 CT
Asia: 20:00–00:00 CT
“Mid” levels are simple midpoints between each period’s High and Low.
Merge Levels: when different levels land at the same price, their labels are merged to reduce clutter (e.g., “PDH / PWH”).
Why this version is useful / original bits
All-white baseline for clean charts; session colors stand out by design: London = Yellow, New York = Aquatic Blue, Asia = Red.
Right-anchored mode lets you park levels to the right side of the chart with a configurable anchor distance.
Label merging keeps the display minimal when multiple levels coincide.
Price-scale-only markers available when you prefer fewer lines on the chart.
Inputs & customization
Display Style: Standard or Right Anchored (+ distance controls).
Levels toggles: enable/disable each period (Daily/Weekly/Monthly/Quarterly/Yearly), Monday range, 4H range, and session ranges.
Text: optional shorthand labels (e.g., PDH/PDL, PWH/PWL).
Colors: global white theme, with session highlights; you can override in the Inputs.
Price-scale markers: on/off toggle.
How to use it
Use previous High/Low as liquidity pools and areas to watch for sweeps, breaks, or retests.
The Monday range often frames the rest of the week; breaks or rejections around Monday H/L can be informative.
The 4H previous range gives intraday context—great for mean-reversion vs. continuation reads.
Session ranges help you see where the active session expanded price and where liquidity may remain.
Notes & limitations
Sessions are computed in America/Chicago; higher-TF levels use the symbol’s exchange timezone.
This is an indicator, not a strategy; it does not place trades or claim performance.
Always combine levels with your own execution rules (structure, momentum, risk).
Credit: inspired by spacemanBTC; this version adds the all-white styling, Chicago-aligned sessions, right-anchoring, label merging, and price-scale markers.
Also my mentor to tell me about the levels
Disclaimer
This tool is for educational purposes only and is not financial advice. Markets involve risk; do your own research and manage risk appropriately.

ICT Sweep + FVG Entry (v6) • Pro Pack 📌 ICT Sweep + FVG Entry Pro Pack
This indicator combines key ICT price action concepts with practical execution tools to help traders spot high-probability setups faster and more objectively. It’s designed for scalpers and intraday traders who want to keep their chart clean but never miss critical market structure events.
🔑 Features
Liquidity Pools (HTF)
• Auto-detects recent swing highs/lows from higher timeframes (5m/15m).
• Draws both lines and optional rectangles/zones for clear liquidity areas.
Liquidity Sweeps (BSL/SSL)
• Identifies when price sweeps above/below liquidity pools and rejects back.
• Optional Grade-A sweep filter (wick size + strong re-entry).
Fair Value Gaps (FVGs)
• Highlights bullish/bearish imbalances.
• Optional midline (50%) entry for precision.
• Auto-invalidation when price fully closes inside the gap.
Killzones (New York)
• Highlights AM (9:30–11:30) and PM (14:00–15:30) killzones.
• Option to block signals outside killzones for higher strike rate.
Bias Badge (DR50)
• Displays if price is trading in a Bull, Bear, or Range context based on displacement range midpoint.
SMT Assist (NQ vs ES)
• Detects simple divergences between indices:
Bearish SMT → NQ makes HH while ES doesn’t.
Bullish SMT → NQ makes LL while ES doesn’t.
SL/TP Helper & R:R Label
• Automatically draws stop loss (at sweep extreme) and target (opposite pool or recent swing).
• Displays expected Risk:Reward ratio and blocks entries if below your chosen minimum.
Filters
• ATR filter ensures signals only appear in sufficient volatility.
• Sweep quality filter avoids weak wicks and fake-outs.
🎯 How to Use
Start on HTF (5m/15m) → Identify liquidity zones and bias.
Drop to LTF (1m) → Wait for a liquidity sweep confirmation.
Check for FVG in the sweep’s direction → Look for retest entry.
Use the SL/TP helper to validate your risk/reward before taking the trade.
Focus entries during NY Killzones for maximum effectiveness.
✅ Why this helps
This tool reduces screen time and hesitation by automating repetitive ICT concepts:
Liquidity pools, sweeps, and FVGs are marked automatically.
Killzone timing and SMT divergence are simplified.
Clear visual signals for entries with built-in RR filter help keep your trading mechanical.
⚠️ Disclaimer: This script is for educational purposes only. It does not provide financial advice or guarantee results. Always use proper risk management.

ICT SIlver Bullet Trading Windows UK times🎯 Purpose of the Indicator
It’s designed to highlight key ICT “macro” and “micro” windows of opportunity, i.e., time ranges where liquidity grabs and algorithmic setups are most likely to occur. The ICT Silver Bullet concept is built on the idea that institutions execute in recurring intraday windows, and these often produce high-probability setups.
🕰️ Windows
London Macro Window
10:00 – 11:00 UK time
This aligns with a major liquidity window after the London equities open settles and London + EU traders reposition.
You’re looking for setups like liquidity sweeps, MSS (market structure shift), and FVG entries here.
New York Macro Window
15:00 – 16:00 UK time (10:00 – 11:00 NY time)
This is right after the NY equities open, a key ICT window for volatility and liquidity grabs.
Power Hour
Usually 20:00 – 21:00 UK time (3pm–4pm NY time), the last trading hour of NY equities.
ICT often refers to this as another manipulation window where setups can form before the daily close.
🔍 What the Indicator Does
Draws session boxes or shading: so you can visually see the London/NY/Power Hour windows directly on your chart.
Macro vs. Micro time frames:
Macro windows → The ones you set (London & NY) are the major daily algo execution windows.
Micro windows → Within those boxes, ICT expects smaller intraday setups (like a Silver Bullet entry from a sweep + FVG).
Guides your trade selection: it tells you when not to hunt trades everywhere, but instead to wait for price action confirmation inside those boxes.
🧩 How This Fits ICT Silver Bullet Trading
The ICT Silver Bullet strategy says:
Wait for one of the macro windows (London or NY).
Look for liquidity sweep → market structure shift → FVG.
Enter with defined risk inside that hour.
This indicator essentially does step 1 for you: it makes those high-probability windows visually obvious, so you don’t waste time trading random hours where algos aren’t active.
