Divergences for many indicators v2.0A gift from me to all.
This script is developed to find Divergences for many indicators. it analyses divergences and then draws line on the graph. red for negatif, lime for positive divergences.
Currently script checks divergence for RSI, MACD, MACD Histogram, Stochastic, CCI, Momentum, OBV, Diosc, VWMACD and CMF indicators. You can use some or all of these indicators to check divergences as you wish by choosing them on the menu. Also you can add/remove many other indicators to the script to check if there is divergence.
The script first calculates tops/bottoms by using higher time frame zig zag and then finds divergences.
Higher Time Frames are
if currend period 1 min => HTF = 5 mins
if currend period 3 mins => HTF = 15 mins
if currend period 5 mins => HTF = 15 mins
if currend period 15 mins => HTF = 1 hour
if currend period 30 mins => HTF = 1 hour
if currend period 45 mins => HTF = 1 hour
if currend period 1 hour => HTF = 4 hours
if currend period 2 hours => HTF = 4 hours
if currend period 3 hours => HTF = 4 hours
if currend period 4 hours => HTF = 1 day
if currend period 1 day => HTF = 1 week
if currend period 1 week => HTF = 1 week
future plan : script finds regular divergences, soon I will add hidden divergences and also I plan to add alert ;)
ค้นหาในสคริปต์สำหรับ "股票开盘前15分钟交易规则"

lsi (study about length and MTF) Here in this example I took lazy bear famous momentum squeeze indicator . the problem that there is lagging in the indicator so the buy and sell will be late . So instead the KC length that the original script had we put
int1=input(30)
int2=input(60)
lengthKC=isintraday and interval >= int1 ? int2/interval * 7 : isintraday and interval < 60 ? 60/interval * 24 * 7 : 7
this allow us to create a time and length related function to indicator and result in better output with no lagging
The second and most important thing is the ability to create indicator with time function as MTF without the security function that create repaint
all you need to do is to change int2 (to the time min of your choice ) and you can create an indicator with MTF function without the security function .And by this hopefully avoid the repainting issue
when you use this indicator change the setting of int1 and int 2 according to time frame that you use
lets say 15 min graph
make the int1 <15 min and the int2 at 15 min. if you want to see it as MTF just increase the int2 to the time set of your choice and play little with int1 to best setting

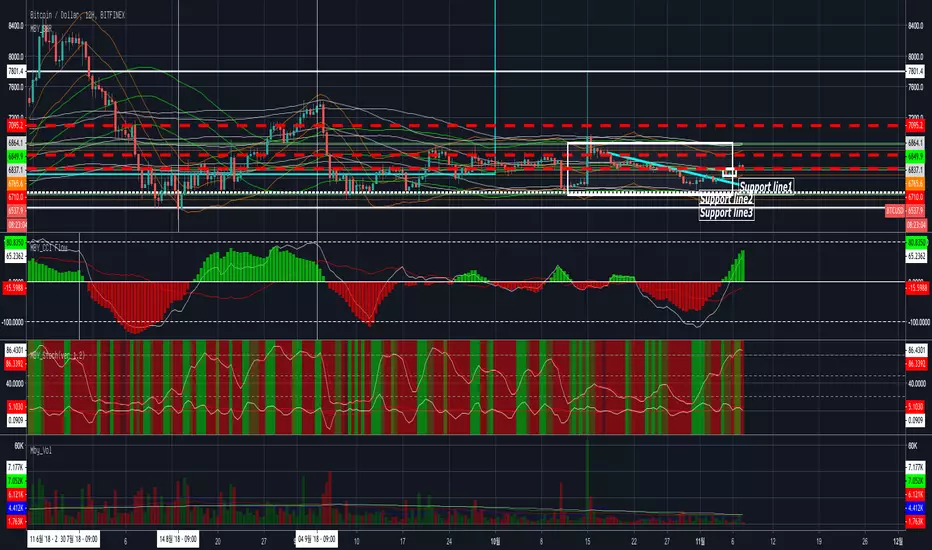
Mby_VolumeThis indicator added some options.
bases 15 SMA.
50SMA
100SMA
120SMA
Now you Can Check not only 15SMA Volume But also other period SMA.
지표의 옵션을 추가했습니다.
기본 15이동평균선.
50, 100, 120.
여러분들은 이제 15 볼륨 이평선 뿐만 아니라 다른 기간의 이평선 까지 확인 가능하실 겁니다.
감사합니다.
Simple TrenderOriginates from:
I was reading some Impulse Trading literature by A. Elder.. In it, someone named Kerry Lovvorn proposed "An End of Day Trend Following System" for someone lazy.
Originally it is just price closing above an 8 ema (low) for long. Exit when price closes below an 8 ema (low). The opposite for a short position.
Conditions: Buy when price closed below ema (low) for two bars or more, then closes above. Opposite for a short position. I do not follow this condition. Though it may help with whipsaw.
My condition is when price closes above the 26 ema (low) (works the best for me) I place orders above the initial crossing bars high. Opposite for lows.
I look for stocks that are low in price to go long on. I want the run from 2's to 15's
I look for stocks that are mid-teens/20's in price to go short on. I want the run from 20's to 2's
I look for stock with news and earnings that are already running (up or down) to play the pullback.
These conditions can easily be scanned for on thinkorswim
From first glance, the system looks like CMsling shotsystem. Although, I plagiarized some parts of the codes, because I am inept when it comes to that shit, it differs as it is not a moving average crossover system.
It is a price crossing over concept. A moving average VWAP is used for best entries on pullbacks.
Purpose:
--To catch the majority of a trend/wave/run.
--To identify pullback areas to go long or short while in midst of trend. To catch pullbacks off news and earning runners.
--To catch the initial start of trend with clear rules to enter
--Clear rules to exit
Issues
--possibilities of getting ninja sliced the fuck up. Can be mitigated by entering stocks with decent average volume. And also only going long above 200 ema and short below it. ADX won't work, at the initial start of the trend it will show not trending. Can look at blow off volume at the bottom followed by increase in buying for long and vice versa for short.
--Can give some huge gains away through gap ups or gap downs from news or earnings during trend. However, can get huge gain on gaps from news or earning. Nature of the game.
--Need some brass balls and a supply of pepto to stomach through some of the pullbacks. Gut wrenching seeing big gains dwindle. But they all even out at the end, you hope. (see NBEV and IGC, and CRON and others. shit don't go in straight lines, homie)
Pros
--It's simple and easy. Overall, you profit
--works with any security
Cons
--It can be stressful.
--does not work well on lower time frames. Do not recommend going below 15 minutes
--Possibility of working on 5 minutes with a time frame breakout strategy (15,30 min).
Couple it with LazyBear "Weis Wave Volume" indicator. Works well for pullback entries.
Enjoy. Ride some waves.

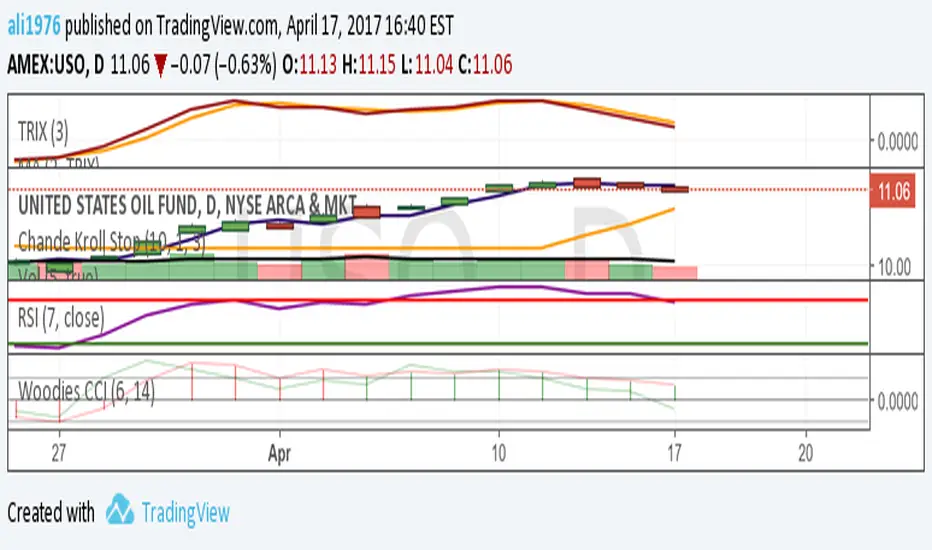
Physics MACD double// Physics MACD double 12, 26 and 5, 15
// with rsi and cci rise green on bottom
// with macd 15 rising above 0 with macd 26 below 0 green on top
// with macd 15 below 0 and macd 26 above 0 red on top
// CCI low and increasing lime bottom
// low and high volume change red green bottom circle
// use with Physics Bollinger Bands

90009If( MDI(14)>40 AND ADX(14)>40 AND PDI(14)<15 AND RSI(14)<30,1,0)
;If( MDI(14)<15 AND ADX(14)<15 AND PDI(14)>40 AND RSI(14)>70,-1,0)
VWAP forex Yesterday Hi/Low update fix This script is an updte fix of an earlier script that stopped functioning when TradingView updated Pine script. This script plots Forex (24 hour session) VWAP, yesterday's high, low, open and close (HLOC),
the day before's HLOC -
Also plots higher timeframe 20 emas
1 minute 5, 15, 60 period 20 ema
5 minute 15, 60 period 20 ema
15 minute 60, 120 , 240 period 20 ema
60 minute 120, 240 period 20 ema
120 minute 240, D period 20 ema
240 minute D period 20 ema
Also signals inside bars (high is less than or equal to the previous bar's high and the low is greater than or equal to the previous low) the : true inside bars have a maroon triangle below the bar as well as a ">" above the bar.
If subsequest bars are inside the last bar before the last true inside bar they also are marked with an ">"
This is probably a slight variation from the way Leaf_West plots the inside bars.
It appears that he marks all bars that are inside the original bar until one a bar has a high or low
outside the original bar. But I would need to see an example on his charts.
The Time Session Glitch and the Fix FX_IDC, COINBASE and BITSTAMP:
The script will correctly default to 1700 hrs to 1700hrs EDT/EST session for FXCM.
Strangely some securities appear to erroneously start their session at 1200 hrs ie. My guess is that they are somehow tied to GMT+0 instead of New York time (GMT+5). See this for yourself by selecting EURUSD using the FXCM exchange (FX:EURUSD) and then EURUSD from the IDC exchange (FX_IDC:EURUSD). The FX-IDC session opening range starts 5 hours before it actually should at 1700 hrs EDT/EST. To correct for this I have implemented an automatic fix (default) and a user selected "5 hour time shift adjust. ment needed on some securities".
There is also a 4 hour time shift button which might be necessary when New York reverts from Eastern Standard Time to Eastern Daylight Time (1 hour difference) in March (and then back again in November). In the default auto adjust mode you will need to select the 1 hour time shift. That is if this glitch still exists at that time.
I have looked at other scripts, other than my own and where the script is available, that need to use information about the opening bar and all have the same time shift issue
COINBASE and BITSTAMP open at 0000 hours GMT. Since I use lines instead of circles or crosses I had to make a small adjustment to plot the lines correctly.
If it needs work let me know.
Jayy

VWAP forex Yesterday Hi/Low switchThis script plots VWAP, yesterday's high, low, open and close (HLOC), the day before's HLOC -
Also plots higher timeframe 20 emas including:
1 minute 5, 15, 60 period 20 ema
5 minute 15, 60 period 20 ema
15 minute 60, 120 , 240 period 20 ema
60 minute 120, 240 period 20 ema
120 minute 240, D period 20 ema
240 minute D period 20 ema
Also signals inside bars (high is less than or equal to the previous
bar's high and the low is greater than or equal to the previous low) the : true inside bars have a maroon triangle below the bar as well as a ">" above the bar.
If subsequent bars are inside the last bar before the last true inside bar they also are marked with an ">"
If you have suggestions let me know.
Jayy

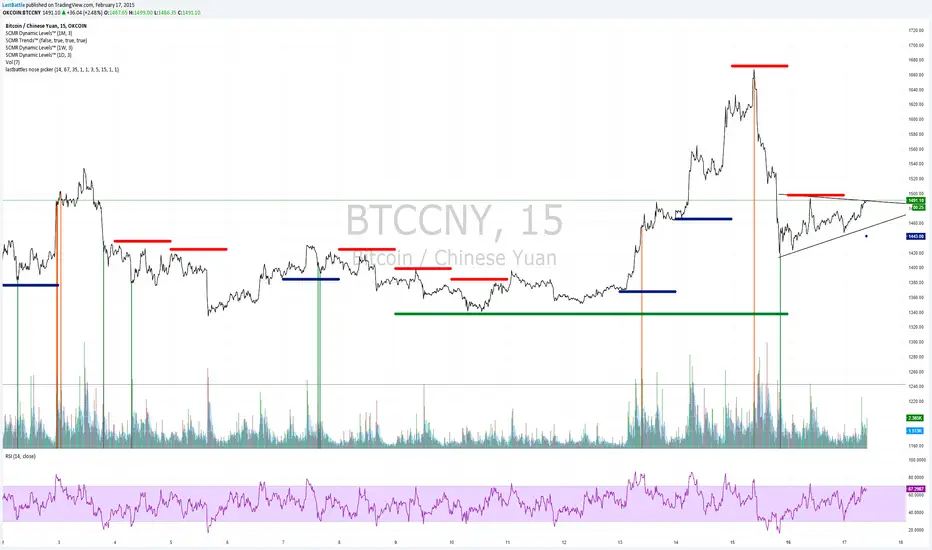
[Bitcoin] Lastbattle's nose pickerI've been working on a top and bottom picker script over the past couple of weeks, based on RSI of multiple timeframe closing price. It've been a pretty good trading system that's tested over the last meteoric rise from 220~270 and back down to 230 right now, and I think it should be released to the community.
Sure, I'm not worried about this strategy not working anymore after it is being used by the majority. Everyone have a different view of the market, and this is more towards psychology. It'll likely to hold for as long as there are still humans trading Bitcoins. Bitcoin market is full of emotions, you'll never run out of it.
So why does it work?
If you take a look at the live charts offered by Bitcoinwisdom and Cryptowatch, they only offer 1, 3, 5, and 15 minute timeframe by default with no other option to switch.
Naturally more traders will look at these levels for oversold and overbought condition.
The same indicator does not work for the broader commodities market such as Gold and Silver.
How does it work?
As long as the RSI levels of 1, 3, 5, and 15 minute fulfills the oversold/overbought level, a signal will be given.
The overbought/oversold level gets compensated the higher volatility the market is in.
Note: **
-This is only for exit strategy. If you're on long, consider reducing or exiting your position when it displays a red. On the other hand if you're short, consider reducing or covering your shorts if it shows a green.
-It may give false signal in a trending market, use your trading experience and judgement to filter them out. (eg: uptrend usually have more than 1 legs AND after a long consolidation, RSI gets to oversold/overbought easily... the market will tend to test the support/resistance again.)
-This is tuned for the 15m interval, the script won't work beyond this. I use it for scalping futures. Feel free to change or remove this line 'plot(interval == 15 and '
-Even if it shows a signal, it may not be the true top/bottom. Sometimes there may be a weak diverged leg aka 'last fart', so that's one reason I dont use this for entry until more confirmation is given via other indicators.
** If your chart is zooming all the way down to 0, right click on the price at the right and select 'Scale price only'
Go ahead and try this out with willy, etc and see what works better :D
Credits:
-LazyBear for the volatility switcher script
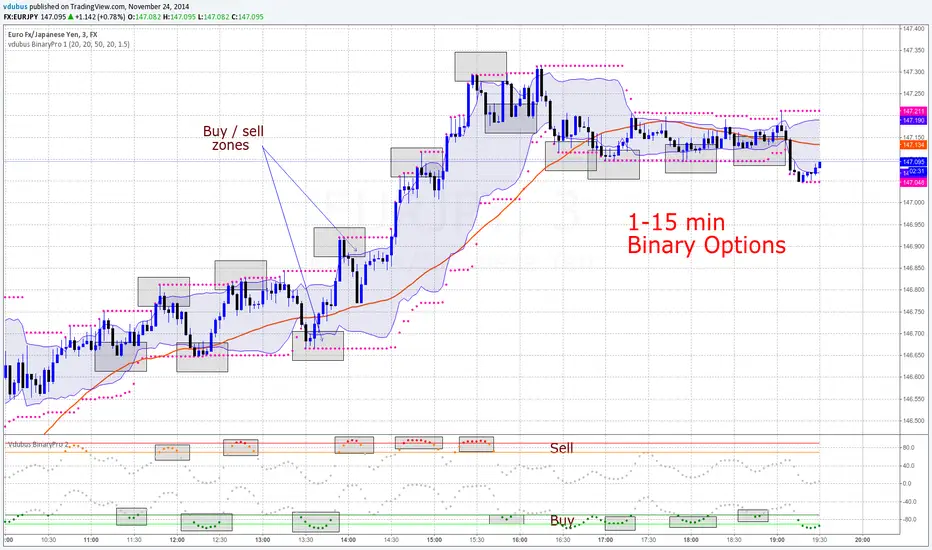
vdubus BinaryPro - Indicators 1 & 2For both scripts - Go to 'MAKE IT MINE'
Modified scripts for Binary trading 1- 3 min charts / 5 -15 min intervals
vdubus BinaryPro 1
Vdubus BinaryPro 2
------------------------------
Vdubus BinaryPro Money Management Strategy: $10 - $50,000 in 15 trades
Tip * break consecutive trades down to lots of 5 compounded / repeat to build up a solid equity foundation., then move on the the next 5 x 3 = 15
if you lose one trade out of the 5, restart the proses. You only ever lose the initial trade size you started with * DOUBLE YOUR WINNINGS NOT YOUR LOSSES !
If you struggle to win 5 compounded trades in a row, compound 2 or 3 trades at a time
drive.google.com
Grand Master's Candlestick Dominance (ATR Enhanced)### Grand Master's Candlestick Dominance (ATR Enhanced)
**Overview**
Unleash the ancient wisdom of Japanese candlestick charting with a modern twist! This comprehensive Pine Script v5 strategy and indicator scans for over 75 classic and advanced candlestick patterns (bullish, bearish, and neutral), assigning dynamic strength scores (1-10) to each for precise signal filtering. Enhanced with Average True Range (ATR) for volatility-aware body size validation, it dominates the markets by combining timeless pattern recognition with robust confirmation layers. Whether used as a backtestable strategy or visual indicator, it empowers traders to spot high-probability reversals, continuations, and indecision setups with surgical accuracy.
Inspired by Steve Nison's *Japanese Candlestick Charting Techniques*, this tool elevates pattern analysis beyond basics—think Hammers, Engulfing patterns, Morning Stars, and rare gems like Abandoned Baby or Concealing Baby Swallow—all consolidated into intelligent arrays for real-time averaging and prioritization.
**Key Features**
- **Extensive Pattern Library**:
- **Bullish (25+ patterns)**: Hammer (8.0), Bullish Engulfing (10.0), Morning Star (7.0), Three White Soldiers (9.0), Dragonfly Doji (8.0), and more (e.g., Rising Three, Unique Three River Bottom).
- **Bearish (25+ patterns)**: Hanging Man (8.0), Bearish Engulfing (10.0), Evening Star (7.0), Three Black Crows (9.0), Gravestone Doji (8.0), and exotics like Upside Gap Two Crows or Stalled Pattern.
- **Neutral/Indecision (34+ patterns)**: Doji variants (Long-Legged, Four Price), Spinning Tops, Harami Crosses, and multi-bar setups like Upside Tasuki Gap or Advancing Block.
Each pattern includes duration tracking (1-5 bars) and ATR-adjusted body/shadow criteria for relevance in volatile conditions.
- **Smart Confirmation Filters** (All Toggleable):
- **Trend Alignment**: 20-period SMA (customizable) ensures entries align with the prevailing trend; optional higher timeframe (e.g., Daily) MA crossover for multi-timeframe confluence.
- **Support/Resistance (S/R)**: Pivot-based levels with 0.01% tolerance to confirm bounces or breaks.
- **Volume Surge**: 20-period volume MA with 1.5x spike multiplier to validate momentum.
- **ATR Body Sizing**: Filters small bodies (<0.3x ATR) and long bodies (>0.8x ATR) for context-aware pattern reliability.
- **Follow-Through**: Ensures post-pattern confirmation via bullish/bearish closes or closes beyond prior bars.
Minimum average strength (default 7.0) and individual pattern thresholds (5.0) prevent weak signals.
- **Entry & Exit Logic**:
- **Long Entry**: Bullish average strength ≥7.0 (outweighing bearish), uptrend, volume spike, near support, follow-through, and HTF alignment.
- **Short Entry**: Mirror for bearish dominance in downtrends near resistance.
- **Exits**: Bearish/neutral shift, or fixed TP (5%) / SL (2%)—pyramiding disabled, 10% equity sizing.
- Backtest range: Jan 1, 2020 – Dec 31, 2025 (editable). Initial capital: $10,000.
- **Interactive Dashboard** (Top-Right Panel):
Real-time insights including:
- Market phase (e.g., "Bullish Phase (Avg Str: 8.2)"), active pattern (e.g., "BULLISH: Bullish Engulfing (Str: 10.0, Bars: 2)"), and trend status.
- Strength breakdowns (Bull/Bear/Neutral counts & averages).
- Filter status (e.g., "Volume: ✔ Spike", "ATR: Enabled (L:0.8, S:0.3)").
- Backtest stats: Total trades, win rate, streak, and last entry/exit details (price & timestamp).
Toggle mode: Strategy (live trades) or Indicator (signals only).
- **Advanced Alerts** (15+ Toggleable Types):
Set up via TradingView's "Any alert() function call" for bar-close triggers:
- Entry/Exit signals with strength & pattern details.
- Strong patterns (≥2 bullish/bearish), neutral indecision, volume spikes.
- S/R breakouts, HTF reversals, high-confidence singles (≥8.0 strength).
- Conflicting signals, MA crossovers, ATR volatility bursts, multi-bar completions.
Example: "STRONG BULLISH PATTERN detected! Strength: 9.5 | Top Pattern: Three White Soldiers | Trend: Up".
**Customization & Usage Tips**
- **Inputs Groups**: Strategy toggles, confirmations, exits, backtest dates, and 15+ alert switches—all intuitively grouped.
- **Optimization**: Tune min strengths for aggressive (lower) or conservative (higher) trading; enable/disable filters to suit your style (e.g., disable S/R for scalping).
- **Best For**: Forex, stocks, crypto on 1H–Daily charts. Test on historical data to refine TP/SL.
- **Limitations**: No external data installs; relies on built-in TA functions. Patterns are probabilistic—combine with your risk management.
Master the candles like a grandmaster. Deploy on TradingView, backtest relentlessly, and let dominance begin! Questions? Drop a comment.
*Version: 1.0 | Updated: September 2025 | Credits: Built on Pine Script v5 with nods to Nison's timeless techniques.*

Volume Bubbles & Liquidity Heatmap [LuxAlgo]The Volume Bubbles & Liquidity Heatmap indicator highlights volume and liquidity clearly and precisely with its volume bubbles and liquidity heat map, allowing to identify key price areas.
Customize the bubbles with different time frames and different display modes: total volume, buy and sell volume, or delta volume.
🔶 USAGE
The primary objective of this tool is to offer traders a straightforward method for analyzing volume on any selected timeframe.
By default, the tool displays buy and sell volume bubbles for the daily timeframe over the last 2,000 bars. Traders should be aware of the difference between the timeframe of the chart and that of the bubbles.
The tool also displays a liquidity heat map to help traders identify price areas where liquidity accumulates or is lacking.
🔹 Volume Bubbles
The bubbles have three possible display modes:
Total Volume: Displays the total volume of trades per bubble.
Buy & Sell Volume: Each bubble is divided into buy and sell volume.
Delta Volume: Displays the difference between buy and sell volume.
Each bubble represents the trading volume for a given period. By default, the timeframe for each bubble is set to daily, meaning each bubble represents the trading volume for each day.
The size of each bubble is proportional to the volume traded; a larger bubble indicates greater volume, while a smaller bubble indicates lower volume.
The color of each bubble indicates the dominant volume: green for buy volume and red for sell volume.
One of the tool's main goals is to facilitate simple, clear, multi-timeframe volume analysis.
The previous chart shows Delta Volume bubbles with various chart and bubble timeframe configurations.
To correctly visualize the bubbles, traders must ensure there is a sufficient number of bars per bubble. This is achieved by using a lower chart timeframe and a higher bubble timeframe.
As can be seen in the image above, the greater the difference between the chart and bubble timeframes, the better the visualization.
🔹 Liquidity Heatmap
The other main element of the tool is the liquidity heatmap. By default, it divides the chart into 25 different price areas and displays the accumulated trading volume on each.
The image above shows a 4-hour BTC chart displaying only the liquidity heatmap. Traders should be aware of these key price areas and observe how the price behaves in them, looking for possible opportunities to engage with the market.
The main parameters for controlling the heatmap on the settings panel are Rows and Cell Minimum Size. Rows modifies the number of horizontal price areas displayed, while Cell Minimum Size modifies the minimum size of each liquidity cell in each row.
As can be seen in the above BTC hourly chart, the cell size is 24 at the top and 168 at the bottom. The cells are smaller on top and bigger on the bottom.
The color of each cell reflects the liquidity size with a gradient; this reflects the total volume traded within each cell. The default colors are:
Red: larger liquidity
Yellow: medium liquidity
Blue: lower liquidity
🔹 Using Both Tools Together
This indicator provides the means to identify directional bias and market timing.
The main idea is that if buyers are strong, prices are likely to increase, and if sellers are strong, prices are likely to decrease. This gives us a directional bias for opening long or short positions. Then, we combine our directional bias with price rejection or acceptance of key liquidity levels to determine the timing of opening or closing our positions.
Now, let's review some charts.
This first chart is BTC 1H with Delta Weekly Bubbles. Delta Bubbles measure the difference between buy and sell volume, so we can easily see which group is dominant (buyers or sellers) and how strong they are in any given week. This, along with the key price areas displayed by the Liquidity Heatmap, can help us navigate the markets.
We divided market behavior into seven groups, and each group has several bubbles, numbered from 1 to 17.
Bubbles 1, 2, and 3: After strong buyers market consolidates with positive delta, prices move up next week.
Bubbles 3, 4, and 5: Strength changes from buyers to sellers. Next week, prices go down.
Bubbles 6 and 7: The market trades at higher prices, but with negative delta. Next week, prices go down.
Bubbles 7, 8, and 9: Strength changes from sellers to buyers. Next weeks (9 and 10), prices go up.
Bubbles 10, 11, and 12: After strong buyers prices trade higher with a negative delta. Next weeks (12 and 13) prices go down.
Bubbles 12, 14, and 15: Strength changes from sellers to buyers; next week, prices increase.
Bubbles 15 and 16: The market trades higher with a very small positive delta; next week, prices go down.
Current bubble/week 17 is not yet finished. Right now, it is trading lower, but with a smaller negative delta than last week. This may signal that sellers are losing strength and that a potential reversal will follow, with prices trading higher.
This is the same BTC 1H chart, but with price rejections from key liquidity areas acting as strong price barriers.
When prices reach a key area with strong liquidity and are rejected, it signals a good time to take action.
By observing price behavior at certain key price levels, we can improve our timing for entering or exiting the markets.
🔶 DETAILS
🔹 Bubbles Display
From the settings panel, traders can configure the bubbles with four main parameters: Mode, Timeframe, Size%, and Shape.
The image above shows five-minute BTC charts with execution over the last 3,500 bars, different display modes, a daily timeframe, 100% size, and shape one.
The Size % parameter controls the overall size of the bubbles, while the Shape parameter controls their vertical growth.
Since the chart has two scales, one for time and one for price, traders can use the Shape parameter to make the bubbles round.
The chart above shows the same bubbles with different size and shape parameters.
You can also customize data labels and timeframe separators from the settings panel.
🔶 SETTINGS
Execute on last X bars: Number of bars for indicator execution
🔹 Bubbles
Display Bubbles: Enable/Disable volume bubbles.
Bubble Mode: Select from the following options: total volume, buy and sell volume, or the delta between buy and sell volume.
Bubble Timeframe: Select the timeframe for which the bubbles will be displayed.
Bubble Size %: Select the size of the bubbles as a percentage.
Bubble Shape: Select the shape of the bubbles. The larger the number, the more vertical the bubbles will be stretched.
🔹 Labels
Display Labels: Enable/Disable data labels, select size and location.
🔹 Separators
Display Separators: Enable/Disable timeframe separators and select color.
🔹 Liquidity Heatmap
Display Heatmap: Enable/Disable liquidity heatmap.
Heatmap Rows: select number of rows to be displayed.
Cell Minimum Size: Select the minimum size for each cell in each row.
Colors.
🔹 Style
Buy & Sell Volume Colors.

MultiScalpMACDThis indicator, the "Custom MACD MTF," is an adaptive version of the classic Moving Average Convergence Divergence (MACD) that automatically adjusts its parameters based on the chart's timeframe. It is designed to provide more fine-tuned momentum readings for traders who focus on specific intraday timeframes.
Overview
The "Custom MACD MTF" modifies the standard MACD calculation by applying unique settings for the 5-minute, 15-minute, and 1-hour charts. For all other timeframes, it reverts to the user-defined default values. This dynamic adjustment allows the indicator to better reflect the momentum characteristics of different trading sessions without requiring manual changes from the user.
Key Features
Adaptive Parameters: The indicator automatically uses optimized MACD settings for popular timeframes:
5-minute: Fast Length = 3, Slow Length = 10, Signal Length = 16
15-minute: Fast Length = 8, Slow Length = 17, Signal Length = 9
1-hour: Fast Length = 12, Slow Length = 26, Signal Length = 9
Momentum-Based Histogram: The histogram bars are colored to provide a clear visual cue about changes in momentum. A light gray bar indicates that momentum is increasing (the current bar is higher than the previous one), while a dark gray bar indicates that momentum is decreasing.
Clear Visual Plots: The indicator plots a pink MACD line, a black signal line, and a gray zero line for easy interpretation of crossovers and trend direction.
How to Interpret
This indicator can be used in the same way as a traditional MACD, but with added sensitivity on the specified timeframes. Traders can look for MACD and signal line crossovers, zero-line crosses, and divergences to identify potential trade signals. The histogram's color change provides an early warning that momentum is either accelerating or decelerating, which can precede a change in price direction.
Settings
Fast Length (Default): The default fast EMA period used for all timeframes except 5m, 15m, and 1h.
Slow Length (Default): The default slow EMA period used for all timeframes except 5m, 15m, and 1h.
Signal Length (Default): The default signal line EMA period used for all timeframes except 5m, 15m, and 1h.
Source: The price source for the MACD calculation (default is Close).

Price Action Concepts [RUDYINDICATOR]/// This work is licensed under a Attribution-NonCommercial-ShareAlike 4.0 International (CC BY-NC-SA 4.0) creativecommons.org
// © RUDYBANK INDICATOR - formerly know as RUDY INDICATOR
//@version=5
indicator("Price Action Concepts ", shorttitle = "RUDYINDICATOR-V1
- Price Action RUDYINDICATOR ", overlay = true, max_lines_count = 500, max_labels_count = 500, max_boxes_count = 500, max_bars_back = 500, max_polylines_count = 100)
//-----------------------------------------------------------------------------{
//Boolean set
//-----------------------------------------------------------------------------{
s_BOS = 0
s_CHoCH = 1
i_BOS = 2
i_CHoCH = 3
i_pp_CHoCH = 4
green_candle = 5
red_candle = 6
s_CHoCHP = 7
i_CHoCHP = 8
boolean =
array.from(
false
, false
, false
, false
, false
, false
, false
, false
, false
)
//-----------------------------------------------------------------------------{
// User inputs
//-----------------------------------------------------------------------------{
show_swing_ms = input.string ("All" , "Swing " , inline = "1", group = "MARKET STRUCTURE" , options = )
show_internal_ms = input.string ("All" , "Internal " , inline = "2", group = "MARKET STRUCTURE" , options = )
internal_r_lookback = input.int (5 , "" , inline = "2", group = "MARKET STRUCTURE" , minval = 2)
swing_r_lookback = input.int (50 , "" , inline = "1", group = "MARKET STRUCTURE" , minval = 2)
ms_mode = input.string ("Manual" , "Market Structure Mode" , inline = "a", group = "MARKET STRUCTURE" , tooltip = " Use selected lenght\n Use automatic lenght" ,options = )
show_mtf_str = input.bool (true , "MTF Scanner" , inline = "9", group = "MARKET STRUCTURE" , tooltip = "Display Multi-Timeframe Market Structure Trend Directions. Green = Bullish. Red = Bearish")
show_eql = input.bool (false , "Show EQH/EQL" , inline = "6", group = "MARKET STRUCTURE")
plotcandle_bool = input.bool (false , "Plotcandle" , inline = "3", group = "MARKET STRUCTURE" , tooltip = "Displays a cleaner colored candlestick chart in place of the default candles. (requires hiding the current ticker candles)")
barcolor_bool = input.bool (false , "Bar Color" , inline = "4", group = "MARKET STRUCTURE" , tooltip = "Color the candle bodies according to market strucutre trend")
i_ms_up_BOS = input.color (#089981 , "" , inline = "2", group = "MARKET STRUCTURE")
i_ms_dn_BOS = input.color (#f23645 , "" , inline = "2", group = "MARKET STRUCTURE")
s_ms_up_BOS = input.color (#089981 , "" , inline = "1", group = "MARKET STRUCTURE")
s_ms_dn_BOS = input.color (#f23645 , "" , inline = "1", group = "MARKET STRUCTURE")
lvl_daily = input.bool (false , "Day " , inline = "1", group = "HIGHS & LOWS MTF")
lvl_weekly = input.bool (false , "Week " , inline = "2", group = "HIGHS & LOWS MTF")
lvl_monthly = input.bool (false , "Month" , inline = "3", group = "HIGHS & LOWS MTF")
lvl_yearly = input.bool (false , "Year " , inline = "4", group = "HIGHS & LOWS MTF")
css_d = input.color (color.blue , "" , inline = "1", group = "HIGHS & LOWS MTF")
css_w = input.color (color.blue , "" , inline = "2", group = "HIGHS & LOWS MTF")
css_m = input.color (color.blue , "" , inline = "3", group = "HIGHS & LOWS MTF")
css_y = input.color (color.blue , "" , inline = "4", group = "HIGHS & LOWS MTF")
s_d = input.string ('⎯⎯⎯' , '' , inline = '1', group = 'HIGHS & LOWS MTF' , options = )
s_w = input.string ('⎯⎯⎯' , '' , inline = '2', group = 'HIGHS & LOWS MTF' , options = )
s_m = input.string ('⎯⎯⎯' , '' , inline = '3', group = 'HIGHS & LOWS MTF' , options = )
s_y = input.string ('⎯⎯⎯' , '' , inline = '4', group = 'HIGHS & LOWS MTF' , options = )
ob_show = input.bool (true , "Show Last " , inline = "1", group = "VOLUMETRIC ORDER BLOCKS" , tooltip = "Display volumetric order blocks on the chart \n\n Ammount of volumetric order blocks to show")
ob_num = input.int (5 , "" , inline = "1", group = "VOLUMETRIC ORDER BLOCKS" , tooltip = "Orderblocks number", minval = 1, maxval = 10)
ob_metrics_show = input.bool (true , "Internal Buy/Sell Activity" , inline = "2", group = "VOLUMETRIC ORDER BLOCKS" , tooltip = "Display volume metrics that have formed the orderblock")
css_metric_up = input.color (color.new(#089981, 50) , " " , inline = "2", group = "VOLUMETRIC ORDER BLOCKS")
css_metric_dn = input.color (color.new(#f23645 , 50) , "" , inline = "2", group = "VOLUMETRIC ORDER BLOCKS")
ob_swings = input.bool (false , "Swing Order Blocks" , inline = "a", group = "VOLUMETRIC ORDER BLOCKS" , tooltip = "Display swing volumetric order blocks")
css_swing_up = input.color (color.new(color.gray , 90) , " " , inline = "a", group = "VOLUMETRIC ORDER BLOCKS")
css_swing_dn = input.color (color.new(color.silver, 90) , "" , inline = "a", group = "VOLUMETRIC ORDER BLOCKS")
ob_filter = input.string ("None" , "Filtering " , inline = "d", group = "VOLUMETRIC ORDER BLOCKS" , tooltip = "Filter out volumetric order blocks by BOS/CHoCH/CHoCH+", options = )
ob_mitigation = input.string ("Absolute" , "Mitigation " , inline = "4", group = "VOLUMETRIC ORDER BLOCKS" , tooltip = "Trigger to remove volumetric order blocks", options = )
ob_pos = input.string ("Precise" , "Positioning " , inline = "k", group = "VOLUMETRIC ORDER BLOCKS" , tooltip = "Position of the Order Block\n Cover the whole candle\n Cover half candle\n Adjust to volatility\n Same as Accurate but more precise", options = )
use_grayscale = input.bool (false , "Grayscale" , inline = "6", group = "VOLUMETRIC ORDER BLOCKS" , tooltip = "Use gray as basic order blocks color")
use_show_metric = input.bool (true , "Show Metrics" , inline = "7", group = "VOLUMETRIC ORDER BLOCKS" , tooltip = "Show volume associated with the orderblock and his relevance")
use_middle_line = input.bool (true , "Show Middle-Line" , inline = "8", group = "VOLUMETRIC ORDER BLOCKS" , tooltip = "Show mid-line order blocks")
use_overlap = input.bool (true , "Hide Overlap" , inline = "9", group = "VOLUMETRIC ORDER BLOCKS" , tooltip = "Hide overlapping order blocks")
use_overlap_method = input.string ("Previous" , "Overlap Method " , inline = "Z", group = "VOLUMETRIC ORDER BLOCKS" , tooltip = " Preserve the most recent volumetric order blocks\n\n Preserve the previous volumetric order blocks", options = )
ob_bull_css = input.color (color.new(#089981 , 90) , "" , inline = "1", group = "VOLUMETRIC ORDER BLOCKS")
ob_bear_css = input.color (color.new(#f23645 , 90) , "" , inline = "1", group = "VOLUMETRIC ORDER BLOCKS")
show_acc_dist_zone = input.bool (false , "" , inline = "1", group = "Accumulation And Distribution")
zone_mode = input.string ("Fast" , "" , inline = "1", group = "Accumulation And Distribution" , tooltip = " Find small zone pattern formation\n Find bigger zone pattern formation" ,options = )
acc_css = input.color (color.new(#089981 , 60) , "" , inline = "1", group = "Accumulation And Distribution")
dist_css = input.color (color.new(#f23645 , 60) , "" , inline = "1", group = "Accumulation And Distribution")
show_lbl = input.bool (false , "Show swing point" , inline = "1", group = "High and Low" , tooltip = "Display swing point")
show_mtb = input.bool (false , "Show High/Low/Equilibrium" , inline = "2", group = "High and Low" , tooltip = "Display Strong/Weak High And Low and Equilibrium")
toplvl = input.color (color.red , "Premium Zone " , inline = "3", group = "High and Low")
midlvl = input.color (color.gray , "Equilibrium Zone" , inline = "4", group = "High and Low")
btmlvl = input.color (#089981 , "Discount Zone " , inline = "5", group = "High and Low")
fvg_enable = input.bool (false , " " , inline = "1", group = "FAIR VALUE GAP" , tooltip = "Display fair value gap")
what_fvg = input.string ("FVG" , "" , inline = "1", group = "FAIR VALUE GAP" , tooltip = "Display fair value gap", options = )
fvg_num = input.int (5 , "Show Last " , inline = "1a", group = "FAIR VALUE GAP" , tooltip = "Number of fvg to show")
fvg_upcss = input.color (color.new(#089981, 80) , "" , inline = "1", group = "FAIR VALUE GAP")
fvg_dncss = input.color (color.new(color.red , 80) , "" , inline = "1", group = "FAIR VALUE GAP")
fvg_extend = input.int (10 , "Extend FVG" , inline = "2", group = "FAIR VALUE GAP" , tooltip = "Extend the display of the FVG.")
fvg_src = input.string ("Close" , "Mitigation " , inline = "3", group = "FAIR VALUE GAP" , tooltip = " Use the close of the body as trigger\n\n Use the extreme point of the body as trigger", options = )
fvg_tf = input.timeframe ("" , "Timeframe " , inline = "4", group = "FAIR VALUE GAP" , tooltip = "Timeframe of the fair value gap")
t = color.t (ob_bull_css)
invcol = color.new (color.white , 100)
//{----------------------------------------------------------------------------------------------------------------------------------------------}
//{----------------------------------------------------------------------------------------------------------------------------------------------}
//{----------------------------------------------------------------------------------------------------------------------------------------------}
//{----------------------------------------------------------------------------------------------------------------------------------------------}
//{ - UDT }
//{----------------------------------------------------------------------------------------------------------------------------------------------}
//{----------------------------------------------------------------------------------------------------------------------------------------------}
//{----------------------------------------------------------------------------------------------------------------------------------------------}
//{----------------------------------------------------------------------------------------------------------------------------------------------}
type bar
float o = open
float c = close
float h = high
float l = low
float v = volume
int n = bar_index
int t = time
type Zphl
line top
line bottom
label top_label
label bottom_label
bool stopcross
bool sbottomcross
bool itopcross
bool ibottomcross
string txtup
string txtdn
float topy
float bottomy
float topx
float bottomx
float tup
float tdn
int tupx
int tdnx
float itopy
float itopx
float ibottomy
float ibottomx
float uV
float dV
type FVG
box box
line ln
bool bull
float top
float btm
int left
int right
type ms
float p
int n
float l
type msDraw
int n
float p
color css
string txt
bool bull
type obC
float top
float btm
int left
float avg
float dV
float cV
int wM
int blVP
int brVP
int dir
float h
float l
int n
type obD
box ob
box eOB
box blB
box brB
line mL
type zone
chart.point points
float p
int c
int t
type hqlzone
box pbx
box ebx
box lbx
label plb
label elb
label lbl
type ehl
float pt
int t
float pb
int b
type pattern
string found = "None"
bool isfound = false
int period = 0
bool bull = false
type alerts
bool chochswing = false
bool chochplusswing = false
bool swingbos = false
bool chochplus = false
bool choch = false
bool bos = false
bool equal = false
bool ob = false
bool swingob = false
bool zone = false
bool fvg = false
bool obtouch = false
//{----------------------------------------------------------------------------------------------------------------------------------------------}
//{----------------------------------------------------------------------------------------------------------------------------------------------}
//{----------------------------------------------------------------------------------------------------------------------------------------------}
//{----------------------------------------------------------------------------------------------------------------------------------------------}
//{ - End }
//{----------------------------------------------------------------------------------------------------------------------------------------------}
//{----------------------------------------------------------------------------------------------------------------------------------------------}
//{----------------------------------------------------------------------------------------------------------------------------------------------}
//{----------------------------------------------------------------------------------------------------------------------------------------------}
//{----------------------------------------------------------------------------------------------------------------------------------------------}
//{----------------------------------------------------------------------------------------------------------------------------------------------}
//{----------------------------------------------------------------------------------------------------------------------------------------------}
//{----------------------------------------------------------------------------------------------------------------------------------------------}
//{ - General Setup }
//{----------------------------------------------------------------------------------------------------------------------------------------------}
//{----------------------------------------------------------------------------------------------------------------------------------------------}
//{----------------------------------------------------------------------------------------------------------------------------------------------}
//{----------------------------------------------------------------------------------------------------------------------------------------------}
bar b = bar.new()
var pattern p = pattern.new()
alerts blalert = alerts.new()
alerts bralert = alerts.new()
if p.isfound
p.period += 1
if p.period == 50
p.period := 0
p.found := "None"
p.isfound := false
p.bull := na
switch
b.c > b.o => boolean.set(green_candle, true)
b.c < b.o => boolean.set(red_candle , true)
f_zscore(src, lookback) =>
(src - ta.sma(src, lookback)) / ta.stdev(src, lookback)
var int iLen = internal_r_lookback
var int sLen = swing_r_lookback
vv = f_zscore(((close - close ) / close ) * 100,iLen)
if ms_mode == "Dynamic"
switch
vv >= 1.5 or vv <= -1.5 => iLen := 10
vv >= 1.6 or vv <= -1.6 => iLen := 9
vv >= 1.7 or vv <= -1.7 => iLen := 8
vv >= 1.8 or vv <= -1.8 => iLen := 7
vv >= 1.9 or vv <= -1.9 => iLen := 6
vv >= 2.0 or vv <= -2.0 => iLen := 5
=> iLen
var msline = array.new(0)
iH = ta.pivothigh(high, iLen, iLen)
sH = ta.pivothigh(high, sLen, sLen)
iL = ta.pivotlow (low , iLen, iLen)
sL = ta.pivotlow (low , sLen, sLen)
//{----------------------------------------------------------------------------------------------------------------------------------------------}
//{----------------------------------------------------------------------------------------------------------------------------------------------}
//{----------------------------------------------------------------------------------------------------------------------------------------------}
//{----------------------------------------------------------------------------------------------------------------------------------------------}
//{ - End }
//{----------------------------------------------------------------------------------------------------------------------------------------------}
//{----------------------------------------------------------------------------------------------------------------------------------------------}
//{----------------------------------------------------------------------------------------------------------------------------------------------}
//{----------------------------------------------------------------------------------------------------------------------------------------------}
//{----------------------------------------------------------------------------------------------------------------------------------------------}
//{----------------------------------------------------------------------------------------------------------------------------------------------}
//{----------------------------------------------------------------------------------------------------------------------------------------------}
//{----------------------------------------------------------------------------------------------------------------------------------------------}
//{ - ARRAYS }
//{----------------------------------------------------------------------------------------------------------------------------------------------}
//{----------------------------------------------------------------------------------------------------------------------------------------------}
//{----------------------------------------------------------------------------------------------------------------------------------------------}
//{----------------------------------------------------------------------------------------------------------------------------------------------}
hl () =>
= request.security(syminfo.tickerid , 'D' , hl() , lookahead = barmerge.lookahead_on)
= request.security(syminfo.tickerid , 'W' , hl() , lookahead = barmerge.lookahead_on)
= request.security(syminfo.tickerid , 'M' , hl() , lookahead = barmerge.lookahead_on)
= request.security(syminfo.tickerid , '12M', hl() , lookahead = barmerge.lookahead_on)
lstyle(style) =>
out = switch style
'⎯⎯⎯' => line.style_solid
'----' => line.style_dashed
'····' => line.style_dotted
mtfphl(h, l ,tf ,css, pdhl_style) =>
var line hl = line.new(
na
, na
, na
, na
, xloc = xloc.bar_time
, color = css
, style = lstyle(pdhl_style)
)
var line ll = line.new(
na
, na
, na
, na
, xloc = xloc.bar_time
, color = css
, style = lstyle(pdhl_style)
)
var label lbl = label.new(
na
, na
, xloc = xloc.bar_time
, text = str.format('P{0}L', tf)
, color = invcol
, textcolor = css
, size = size.small
, style = label.style_label_left
)
var label hlb = label.new(
na
, na
, xloc = xloc.bar_time
, text = str.format('P{0}H', tf)
, color = invcol
, textcolor = css
, size = size.small
, style = label.style_label_left
)
hy = ta.valuewhen(h != h , h , 1)
hx = ta.valuewhen(h == high , time , 1)
ly = ta.valuewhen(l != l , l , 1)
lx = ta.valuewhen(l == low , time , 1)
if barstate.islast
extension = time + (time - time ) * 50
line.set_xy1(hl , hx , hy)
line.set_xy2(hl , extension , hy)
label.set_xy(hlb, extension , hy)
line.set_xy1(ll , lx , ly)
line.set_xy2(ll , extension , ly)
label.set_xy(lbl, extension , ly)
if lvl_daily
mtfphl(pdh , pdl , 'D' , css_d, s_d)
if lvl_weekly
mtfphl(pwh , pwl , 'W' , css_w, s_w)
if lvl_monthly
mtfphl(pmh , pml, 'M' , css_m, s_m)
if lvl_yearly
mtfphl(pyh , pyl , '12M', css_y, s_y)
//{----------------------------------------------------------------------------------------------------------------------------------------------}
//{----------------------------------------------------------------------------------------------------------------------------------------------}
//{----------------------------------------------------------------------------------------------------------------------------------------------}
//{----------------------------------------------------------------------------------------------------------------------------------------------}
//{ - End }
//{----------------------------------------------------------------------------------------------------------------------------------------------}
//{----------------------------------------------------------------------------------------------------------------------------------------------}
//{----------------------------------------------------------------------------------------------------------------------------------------------}
//{----------------------------------------------------------------------------------------------------------------------------------------------}
//{----------------------------------------------------------------------------------------------------------------------------------------------}
//{----------------------------------------------------------------------------------------------------------------------------------------------}
//{----------------------------------------------------------------------------------------------------------------------------------------------}
//{----------------------------------------------------------------------------------------------------------------------------------------------}
//{ - Market Structure }
//{----------------------------------------------------------------------------------------------------------------------------------------------}
//{----------------------------------------------------------------------------------------------------------------------------------------------}
//{----------------------------------------------------------------------------------------------------------------------------------------------}
//{----------------------------------------------------------------------------------------------------------------------------------------------}
method darkcss(color css, float factor, bool bull) =>
blue = color.b(css) * (1 - factor)
red = color.r(css) * (1 - factor)
green = color.g(css) * (1 - factor)
color.rgb(red, green, blue, 0)
method f_line(msDraw d, size, style) =>
var line id = na
var label lbl = na
id := line.new(
d.n
, d.p
, b.n
, d.p
, color = d.css
, width = 1
, style = style
)
if msline.size() >= 250
line.delete(msline.shift())
msline.push(id)
lbl := label.new(
int(math.avg(d.n, b.n))
, d.p
, d.txt
, color = invcol
, textcolor = d.css
, style = d.bull ? label.style_label_down : label.style_label_up
, size = size
, text_font_family = font.family_monospace
)
structure(bool mtf) =>
msDraw drw = na
bool isdrw = false
bool isdrwS = false
var color css = na
var color icss = na
var int itrend = 0
var int trend = 0
bool bull_ob = false
bool bear_ob = false
bool s_bull_ob = false
bool s_bear_ob = false
n = bar_index
var ms up = ms.new(
array.new()
, array.new< int >()
, array.new()
)
var ms dn = ms.new(
array.new()
, array.new< int >()
, array.new()
)
var ms sup = ms.new(
array.new()
, array.new< int >()
, array.new()
)
var ms sdn = ms.new(
array.new()
, array.new< int >()
, array.new()
)
switch show_swing_ms
"All" => boolean.set(s_BOS , true ), boolean.set(s_CHoCH, true ) , boolean.set(s_CHoCHP, true )
"CHoCH" => boolean.set(s_BOS , false), boolean.set(s_CHoCH, true ) , boolean.set(s_CHoCHP, false )
"CHoCH+" => boolean.set(s_BOS , false), boolean.set(s_CHoCH, false) , boolean.set(s_CHoCHP, true )
"BOS" => boolean.set(s_BOS , true ), boolean.set(s_CHoCH, false) , boolean.set(s_CHoCHP, false )
"None" => boolean.set(s_BOS , false), boolean.set(s_CHoCH, false) , boolean.set(s_CHoCHP, false )
=> na
switch show_internal_ms
"All" => boolean.set(i_BOS, true ), boolean.set(i_CHoCH, true ), boolean.set(i_CHoCHP, true )
"CHoCH" => boolean.set(i_BOS, false), boolean.set(i_CHoCH, true ), boolean.set(i_CHoCHP, false)
"CHoCH+" => boolean.set(i_BOS, false), boolean.set(i_CHoCH, false ), boolean.set(i_CHoCHP, true )
"BOS" => boolean.set(i_BOS, true ), boolean.set(i_CHoCH, false ), boolean.set(i_CHoCHP, false)
"None" => boolean.set(i_BOS, false), boolean.set(i_CHoCH, false ), boolean.set(i_CHoCHP, false)
=> na
switch
iH =>
up.p.unshift(b.h )
up.l.unshift(b.h )
up.n.unshift(n )
iL =>
dn.p.unshift(b.l )
dn.l.unshift(b.l )
dn.n.unshift(n )
sL =>
sdn.p.unshift(b.l )
sdn.l.unshift(b.l )
sdn.n.unshift(n )
sH =>
sup.p.unshift(b.h )
sup.l.unshift(b.h )
sup.n.unshift(n )
// INTERNAL BULLISH STRUCTURE
if up.p.size() > 0 and dn.l.size() > 1
if ta.crossover(b.c, up.p.first())
bool CHoCH = na
string txt = na
if itrend < 0
CHoCH := true
switch
not CHoCH =>
txt := "BOS"
css := i_ms_up_BOS
blalert.bos := true
if boolean.get(i_BOS) and mtf == false and na(drw)
isdrw := true
drw := msDraw.new(
up.n.first()
, up.p.first()
, i_ms_up_BOS
, txt
, true
)
CHoCH =>
dn.l.first() > dn.l.get(1) ? blalert.chochplus : blalert.choch
txt := dn.l.first() > dn.l.get(1) ? "CHoCH+" : "CHoCH"
css := i_ms_up_BOS.darkcss(0.25, true)
if (dn.l.first() > dn.l.get(1) ? boolean.get(i_CHoCHP) : boolean.get(i_CHoCH)) and mtf == false and na(drw)
isdrw := true
drw := msDraw.new(
up.n.first()
, up.p.first()
, i_ms_up_BOS.darkcss(0.25, true)
, txt
, true
)
if mtf == false
switch
ob_filter == "None" => bull_ob := true
ob_filter == "BOS" and txt == "BOS" => bull_ob := true
ob_filter == "CHoCH" and txt == "CHoCH" => bull_ob := true
ob_filter == "CHoCH+" and txt == "CHoCH+" => bull_ob := true
itrend := 1
up.n.clear()
up.p.clear()
// INTERNAL BEARISH STRUCTURE
if dn.p.size() > 0 and up.l.size() > 1
if ta.crossunder(b.c, dn.p.first())
bool CHoCH = na
string txt = na
if itrend > 0
CHoCH := true
switch
not CHoCH =>
bralert.bos := true
txt := "BOS"
css := i_ms_dn_BOS
if boolean.get(i_BOS) and mtf == false and na(drw)
isdrw := true
drw := msDraw.new(
dn.n.first()
, dn.p.first()
, i_ms_dn_BOS
, txt
, false
)
CHoCH =>
if up.l.first() < up.l.get(1)
bralert.chochplus := true
else
bralert.choch := true
txt := up.l.first() < up.l.get(1) ? "CHoCH+" : "CHoCH"
css := i_ms_dn_BOS.darkcss(0.25, false)
if (up.l.first() < up.l.get(1) ? boolean.get(i_CHoCHP) : boolean.get(i_CHoCH)) and mtf == false and na(drw)
isdrw := true
drw := msDraw.new(
dn.n.first()
, dn.p.first()
, i_ms_dn_BOS.darkcss(0.25, false)
, txt
, false
)
if mtf == false
switch
ob_filter == "None" => bear_ob := true
ob_filter == "BOS" and txt == "BOS" => bear_ob := true
ob_filter == "CHoCH" and txt == "CHoCH" => bear_ob := true
ob_filter == "CHoCH+" and txt == "CHoCH+" => bear_ob := true
itrend := -1
dn.n.clear()
dn.p.clear()
// SWING BULLISH STRUCTURE
if sup.p.size() > 0 and sdn.l.size() > 1
if ta.crossover(b.c, sup.p.first())
bool CHoCH = na
string txt = na
if trend < 0
CHoCH := true
switch
not CHoCH =>
blalert.swingbos := true
txt := "BOS"
icss := s_ms_up_BOS
if boolean.get(s_BOS) and mtf == false and na(drw)
isdrwS := true
drw := msDraw.new(
sup.n.first()
, sup.p.first()
, s_ms_up_BOS
, txt
, true
)
CHoCH =>
if sdn.l.first() > sdn.l.get(1)
blalert.chochplusswing := true
else
blalert.chochswing := true
txt := sdn.l.first() > sdn.l.get(1) ? "CHoCH+" : "CHoCH"
icss := s_ms_up_BOS.darkcss(0.25, true)
if (sdn.l.first() > sdn.l.get(1) ? boolean.get(s_CHoCHP) : boolean.get(s_CHoCH)) and mtf == false and na(drw)
isdrwS := true
drw := msDraw.new(
sup.n.first()
, sup.p.first()
, s_ms_up_BOS.darkcss(0.25, true)
, txt
, true
)
if mtf == false
switch
ob_filter == "None" => s_bull_ob := true
ob_filter == "BOS" and txt == "BOS" => s_bull_ob := true
ob_filter == "CHoCH" and txt == "CHoCH" => s_bull_ob := true
ob_filter == "CHoCH+" and txt == "CHoCH+" => s_bull_ob := true
trend := 1
sup.n.clear()
sup.p.clear()
// SWING BEARISH STRUCTURE
if sdn.p.size() > 0 and sup.l.size() > 1
if ta.crossunder(b.c, sdn.p.first())
bool CHoCH = na
string txt = na
if trend > 0
CHoCH := true
switch
not CHoCH =>
bralert.swingbos := true
txt := "BOS"
icss := s_ms_dn_BOS
if boolean.get(s_BOS) and mtf == false and na(drw)
isdrwS := true
drw := msDraw.new(
sdn.n.first()
, sdn.p.first()
, s_ms_dn_BOS
, txt
, false
)
CHoCH =>
if sup.l.first() < sup.l.get(1)
bralert.chochplusswing := true
else
bralert.chochswing := true
txt := sup.l.first() < sup.l.get(1) ? "CHoCH+" : "CHoCH"
icss := s_ms_dn_BOS.darkcss(0.25, false)
if (sup.l.first() < sup.l.get(1) ? boolean.get(s_CHoCHP) : boolean.get(s_CHoCH)) and mtf == false and na(drw)
isdrwS := true
drw := msDraw.new(
sdn.n.first()
, sdn.p.first()
, s_ms_dn_BOS.darkcss(0.25, false)
, txt
, false
)
if mtf == false
switch
ob_filter == "None" => s_bear_ob := true
ob_filter == "BOS" and txt == "BOS" => s_bear_ob := true
ob_filter == "CHoCH" and txt == "CHoCH" => s_bear_ob := true
ob_filter == "CHoCH+" and txt == "CHoCH+" => s_bear_ob := true
trend := -1
sdn.n.clear()
sdn.p.clear()
= structure(false)
if isdrw
f_line(drw, size.small, line.style_dashed)
if isdrwS
f_line(drw, size.small, line.style_solid)
= request.security("", "15" , structure(true))
= request.security("", "60" , structure(true))
= request.security("", "240" , structure(true))
= request.security("", "1440" , structure(true))
if show_mtf_str
var tab = table.new(position = position.top_right, columns = 10, rows = 10, bgcolor = na, frame_color = color.rgb(54, 58, 69, 0), frame_width = 1, border_color = color.rgb(54, 58, 69, 100), border_width = 1)
table.cell(tab, 0, 1, text = "15" , text_color = color.silver, text_halign = text.align_center, text_size = size.normal, bgcolor = chart.bg_color, text_font_family = font.family_monospace, width = 2)
table.cell(tab, 0, 2, text = "1H" , text_color = color.silver, text_halign = text.align_center, text_size = size.normal, bgcolor = chart.bg_color, text_font_family = font.family_monospace, width = 2)
table.cell(tab, 0, 3, text = "4H" , text_color = color.silver, text_halign = text.align_center, text_size = size.normal, bgcolor = chart.bg_color, text_font_family = font.family_monospace, width = 2)
table.cell(tab, 0, 4, text = "1D" , text_color = color.silver, text_halign = text.align_center, text_size = size.normal, bgcolor = chart.bg_color, text_font_family = font.family_monospace, width = 2)
table.cell(tab, 1, 1, text = itrend15 == 1 ? "BULLISH" : itrend15 == -1 ? "BEARISH" : na , text_halign = text.align_center, text_size = size.normal, text_color = itrend15 == 1 ? i_ms_up_BOS.darkcss(-0.25, true) : itrend15 == -1 ? i_ms_dn_BOS.darkcss(0.25, false) : color.gray, bgcolor = chart.bg_color, text_font_family = font.family_monospace)
table.cell(tab, 1, 2, text = itrend1H == 1 ? "BULLISH" : itrend1H == -1 ? "BEARISH" : na , text_halign = text.align_center, text_size = size.normal, text_color = itrend1H == 1 ? i_ms_up_BOS.darkcss(-0.25, true) : itrend1H == -1 ? i_ms_dn_BOS.darkcss(0.25, false) : color.gray, bgcolor = chart.bg_color, text_font_family = font.family_monospace)
table.cell(tab, 1, 3, text = itrend4H == 1 ? "BULLISH" : itrend4H == -1 ? "BEARISH" : na , text_halign = text.align_center, text_size = size.normal, text_color = itrend4H == 1 ? i_ms_up_BOS.darkcss(-0.25, true) : itrend4H == -1 ? i_ms_dn_BOS.darkcss(0.25, false) : color.gray, bgcolor = chart.bg_color, text_font_family = font.family_monospace)
table.cell(tab, 1, 4, text = itrend1D == 1 ? "BULLISH" : itrend1D == -1 ? "BEARISH" : na , text_halign = text.align_center, text_size = size.normal, text_color = itrend1D == 1 ? i_ms_up_BOS.darkcss(-0.25, true) : itrend1D == -1 ? i_ms_dn_BOS.darkcss(0.25, false) : color.gray, bgcolor = chart.bg_color, text_font_family = font.family_monospace)
table.cell(tab, 0, 5, text = "Detected Pattern", text_halign = text.align_center, text_size = size.normal, text_color = color.silver, bgcolor = chart.bg_color, text_font_family = font.family_monospace)
table.cell(tab, 0, 6, text = p.found, text_halign = text.align_center, text_size = size.normal, text_color = na(p.bull) ? color.white : p.bull ? i_ms_up_BOS.darkcss(-0.25, true) : p.bull == false ? i_ms_dn_BOS.darkcss(0.25, false) : na, bgcolor = chart.bg_color, text_font_family = font.family_monospace)
table.merge_cells(tab, 0, 5, 1, 5)
table.merge_cells(tab, 0, 6, 1, 6)
//{----------------------------------------------------------------------------------------------------------------------------------------------}
//{----------------------------------------------------------------------------------------------------------------------------------------------}
//{----------------------------------------------------------------------------------------------------------------------------------------------}
//{----------------------------------------------------------------------------------------------------------------------------------------------}
//{ - End }
//{----------------------------------------------------------------------------------------------------------------------------------------------}
//{----------------------------------------------------------------------------------------------------------------------------------------------}
//{----------------------------------------------------------------------------------------------------------------------------------------------}
//{----------------------------------------------------------------------------------------------------------------------------------------------}
//{----------------------------------------------------------------------------------------------------------------------------------------------}
//{----------------------------------------------------------------------------------------------------------------------------------------------}
//{----------------------------------------------------------------------------------------------------------------------------------------------}
//{----------------------------------------------------------------------------------------------------------------------------------------------}
//{ - Strong/Weak High/Low And Equilibrium }
//{----------------------------------------------------------------------------------------------------------------------------------------------}
//{----------------------------------------------------------------------------------------------------------------------------------------------}
//{----------------------------------------------------------------------------------------------------------------------------------------------}
//{----------------------------------------------------------------------------------------------------------------------------------------------}
var phl = Zphl.new(
na
, na
, label.new(na , na , color = invcol , textcolor = i_ms_dn_BOS , style = label.style_label_down , size = size.tiny , text = "")
, label.new(na , na , color = invcol , textcolor = i_ms_up_BOS , style = label.style_label_up , size = size.tiny , text = "")
, true
, true
, true
, true
, ""
, ""
, 0
, 0
, 0
, 0
, high
, low
, 0
, 0
, 0
, 0
, 0
, 0
, na
, na
)
zhl(len)=>
upper = ta.highest(len)
lower = ta.lowest(len)
var float out = 0
out := b.h > upper ? 0 : b.l < lower ? 1 : out
top = out == 0 and out != 0 ? b.h : 0
btm = out == 1 and out != 1 ? b.l : 0
= zhl(sLen)
= zhl(iLen)
upphl(trend) =>
var label lbl = label.new(
na
, na
, color = invcol
, textcolor = toplvl
, style = label.style_label_down
, size = size.small
)
if top
phl.stopcross := true
phl.txtup := top > phl.topy ? "HH" : "HL"
if show_lbl
topl = label.new(
b.n - swing_r_lookback
, top
, phl.txtup
, color = invcol
, textcolor = toplvl
, style = label.style_label_down
, size = size.small
)
line.delete(phl.top )
phl.top := line.new(
b.n - sLen
, top
, b.n
, top
, color = toplvl)
phl.topy := top
phl.topx := b.n - sLen
phl.tup := top
phl.tupx := b.n - sLen
if itop
phl.itopcross := true
phl.itopy := itop
phl.itopx := b.n - iLen
phl.tup := math.max(high, phl.tup)
phl.tupx := phl.tup == high ? b.n : phl.tupx
phl.uV := phl.tup != phl.tup ? b.v : phl.uV
if barstate.islast
line.set_xy1(
phl.top
, phl.tupx
, phl.tup
)
line.set_xy2(
phl.top
, b.n + 50
, phl.tup
)
label.set_x(
lbl
, b.n + 50
)
label.set_y(
lbl
, phl.tup
)
dist = math.abs(phl.uV / (phl.uV + phl.dV)) * 100
label.set_text (lbl, trend < 0
? "Strong High | " + str.tostring(phl.uV, format.volume) + " (" + str.tostring(math.round(dist,0)) + "%)"
: "Weak High | " + str.tostring(phl.uV, format.volume) + " (" + str.tostring(math.round(dist,0)) + "%)")
dnphl(trend) =>
var label lbl = label.new(
na
, na
, color = invcol
, textcolor = btmlvl
, style = label.style_label_up
, size = size.small
)
if btm
phl.sbottomcross := true
phl.txtdn := btm > phl.bottomy ? "LH" : "LL"
if show_lbl
btml = label.new(
b.n - swing_r_lookback
, btm, phl.txtdn
, color = invcol
, textcolor = btmlvl
, style = label.style_label_up
, size = size.small
)
line.delete(phl.bottom )
phl.bottom := line.new(
b.n - sLen
, btm
, b.n
, btm
, color = btmlvl
)
phl.bottomy := btm
phl.bottomx := b.n - sLen
phl.tdn := btm
phl.tdnx := b.n - sLen
if ibtm
phl.ibottomcross := true
phl.ibottomy := ibtm
phl.ibottomx := b.n - iLen
phl.tdn := math.min(low, phl.tdn)
phl.tdnx := phl.tdn == low ? b.n : phl.tdnx
phl.dV := phl.tdn != phl.tdn ? b.v : phl.dV
if barstate.islast
line.set_xy1(
phl.bottom
, phl.tdnx
, phl.tdn
)
line.set_xy2(
phl.bottom
, b.n + 50
, phl.tdn
)
label.set_x(
lbl
, b.n + 50
)
label.set_y(
lbl
, phl.tdn
)
dist = math.abs(phl.dV / (phl.uV + phl.dV)) * 100
label.set_text (lbl, trend > 0
? "Strong Low | " + str.tostring(phl.dV, format.volume) + " (" + str.tostring(math.round(dist,0)) + "%)"
: "Weak Low | " + str.tostring(phl.uV, format.volume) + " (" + str.tostring(math.round(dist,0)) + "%)")
midphl() =>
avg = math.avg(phl.bottom.get_y2(), phl.top.get_y2())
var line l = line.new(
y1 = avg
, y2 = avg
, x1 = b.n - sLen
, x2 = b.n + 50
, color = midlvl
, style = line.style_solid
)
var label lbl = label.new(
x = b.n + 50
, y = avg
, text = "Equilibrium"
, style = label.style_label_left
, color = invcol
, textcolor = midlvl
, size = size.small
)
if barstate.islast
more = (phl.bottom.get_x1() + phl.bottom.get_x2()) > (phl.top.get_x1() + phl.top.get_x2()) ? phl.top.get_x1() : phl.bottom.get_x1()
line.set_xy1(l , more , avg)
line.set_xy2(l , b.n + 50, avg)
label.set_x (lbl , b.n + 50 )
label.set_y (lbl , avg )
dist = math.abs((l.get_y2() - close) / close) * 100
label.set_text (lbl, "Equilibrium (" + str.tostring(math.round(dist,0)) + "%)")
hqlzone() =>
if barstate.islast
var hqlzone dZone = hqlzone.new(
box.new(
na
, na
, na
, na
, bgcolor = color.new(toplvl, 70)
, border_color = na
)
, box.new(
na
, na
, na
, na
, bgcolor = color.new(midlvl, 70)
, border_color = na
)
, box.new(
na
, na
, na
, na
, bgcolor = color.new(btmlvl, 70)
, border_color = na
)
, label.new(na, na, text = "Premium" , color = invcol, textcolor = toplvl, style = label.style_label_down, size = size.small)
, label.new(na, na, text = "Equilibrium", color = invcol, textcolor = midlvl, style = label.style_label_left, size = size.small)
, label.new(na, na, text = "Discount" , color = invcol, textcolor = btmlvl, style = label.style_label_up , size = size.small)
)
dZone.pbx.set_lefttop(int(math.max(phl.topx, phl.bottomx)) , phl.tup)
dZone.pbx.set_rightbottom(b.n + 50 , 0.95 * phl.tup + 0.05 * phl.tdn)
dZone.ebx.set_lefttop(int(math.max(phl.topx, phl.bottomx)), 0.525 * phl.tup + 0.475 * phl.tdn)
dZone.ebx.set_rightbottom(b.n + 50 , 0.525 * phl.tdn + 0.475 * phl.tup)
dZone.lbx.set_lefttop(int(math.max(phl.topx, phl.bottomx)), 0.95 * phl.tdn + 0.05 * phl.tup)
dZone.lbx.set_rightbottom(b.n + 50 , phl.tdn)
dZone.plb.set_xy( int(math.avg(math.max(phl.topx, phl.bottomx), int(b.n + 50))) , phl.tup)
dZone.elb.set_xy( int(b.n + 50) , math.avg(phl.tup, phl.tdn))
dZone.lbl.set_xy( int(math.avg(math.max(phl.topx, phl.bottomx), int(b.n + 50))) , phl.tdn)
if show_mtb
upphl (trend)
dnphl (trend)
hqlzone()
//{----------------------------------------------------------------------------------------------------------------------------------------------}
//{----------------------------------------------------------------------------------------------------------------------------------------------}
//{----------------------------------------------------------------------------------------------------------------------------------------------}
//{----------------------------------------------------------------------------------------------------------------------------------------------}
//{ - End }
//{----------------------------------------------------------------------------------------------------------------------------------------------}
//{----------------------------------------------------------------------------------------------------------------------------------------------}
//{----------------------------------------------------------------------------------------------------------------------------------------------}
//{----------------------------------------------------------------------------------------------------------------------------------------------}
//{----------------------------------------------------------------------------------------------------------------------------------------------}
//{----------------------------------------------------------------------------------------------------------------------------------------------}
//{----------------------------------------------------------------------------------------------------------------------------------------------}
//{----------------------------------------------------------------------------------------------------------------------------------------------}
//{ - Volumetric Order Block }
//{----------------------------------------------------------------------------------------------------------------------------------------------}
//{----------------------------------------------------------------------------------------------------------------------------------------------}
//{----------------------------------------------------------------------------------------------------------------------------------------------}
//{----------------------------------------------------------------------------------------------------------------------------------------------}
method eB(box b, bool ext, color css, bool swing) =>
b.unshift(
box.new(
na
, na
, na
, na
, xloc = xloc.bar_time
, text_font_family = font.family_monospace
, extend = ext ? extend.right : extend.none
, border_color = swing ? color.new(css, 0) : color.new(color.white,100)
, bgcolor = css
, border_width = 1
)
)
method eL(line l, bool ext, bool solid, color css) =>
l.unshift(
line.new(
na
, na
, na
, na
, width = 1
, color = css
, xloc = xloc.bar_time
, extend = ext ? extend.right : extend.none
, style = solid ? line.style_solid : line.style_dashed
)
)
method drawVOB(bool cdn, bool bull, color css, int loc, bool swing) =>
= request.security(
syminfo.tickerid
, ""
,
, lookahead = barmerge.lookahead_off
)
var obC obj = obC.new(
array.new()
, array.new()
, array.new< int >()
, array.new()
, array.new()
, array.new()
, array.new< int >()
, array.new< int >()
, array.new< int >()
, array.new< int >()
, array.new()
, array.new()
, array.new< int >()
)
var obD draw = obD.new(
array.new()
, array.new()
, array.new()
, array.new()
, array.new()
)
if barstate.isfirst
for i = 0 to ob_num - 1
draw.mL .eL(false, false, use_grayscale ? color.new(color.gray, 0) : color.new(css,0))
draw.ob .eB(false, use_grayscale ? color.new(color.gray, 90) : css, swing)
draw.blB.eB(false, css_metric_up , swing)
draw.brB.eB(false, css_metric_dn , swing)
draw.eOB.eB(true , use_grayscale ? color.new(color.gray, 90) : css, swing)
float pos = ob_pos == "Full"
? (bull ? high : low)
: ob_pos == "Middle"
? ohlc4
: ob_pos == "Accurate"
? hl2
: hl2
if cdn
obj.h.clear()
obj.l.clear()
obj.n.clear()
for i = 0 to math.abs((loc - b.n)) - 1
obj.h.push(hH )
obj.l.push(lL )
obj.n.push(b.t )
// obj.h.reverse()
// obj.l.reverse()
int iU = obj.l.indexof(obj.l.min()) + 1
int iD = obj.h.indexof(obj.h.max()) + 1
obj.dir.unshift(
bull
? (b.c > b.o ? 1 : -1)
: (b.c > b.o ? 1 : -1)
)
obj.top.unshift(
bull
? pos
: obj.h.max()
)
obj.btm.unshift(
bull
? obj.l.min()
: pos
)
obj.left.unshift(
bull
? obj.n.get(obj.l.indexof(obj.l.min()))
: obj.n.get(obj.h.indexof(obj.h.max()))
)
obj.avg.unshift(
math.avg(obj.top.first(), obj.btm.first())
)
obj.cV.unshift(
bull
? b.v
: b.v
)
if ob_pos == "Precise"
switch bull
true =>
if obj.avg.get(0) < (b.c < b.o ? b.c : b.o ) and obj.top.get(0) > hlcc4
obj.top.set(0, obj.avg.get(0))
obj.avg.set(0, math.avg(obj.top.first(), obj.btm.first()))
false =>
if obj.avg.get(0) > (b.c < b.o ? b.o : b.c ) and obj.btm.get(0) < hlcc4
obj.btm.set(0, obj.avg.get(0))
obj.avg.set(0, math.avg(obj.top.first(), obj.btm.first()))
obj.blVP.unshift ( 0 )
obj.brVP.unshift ( 0 )
obj.wM .unshift ( 1 )
if use_overlap
int rmP = use_overlap_method == "Recent" ? 1 : 0
if obj.avg.size() > 1
if bull
? obj.btm.first() < obj.top.get(1)
: obj.top.first() > obj.btm.get(1)
obj.wM .remove(rmP)
obj.cV .remove(rmP)
obj.dir .remove(rmP)
obj.top .remove(rmP)
obj.avg .remove(rmP)
obj.btm .remove(rmP)
obj.left .remove(rmP)
obj.blVP .remove(rmP)
obj.brVP .remove(rmP)
if barstate.isconfirmed
for x = 0 to ob_num - 1
tg = switch ob_mitigation
"Middle" => obj.avg
"Absolute" => bull ? obj.btm : obj.top
for in tg
if (bull ? cC < pt : cC > pt)
obj.wM .remove(idx)
obj.cV .remove(idx)
obj.dir .remove(idx)
obj.top .remove(idx)
obj.avg .remove(idx)
obj.btm .remove(idx)
obj.left .remove(idx)
obj.blVP .remove(idx)
obj.brVP .remove(idx)
if barstate.islast
if obj.avg.size() > 0
// Alert
if bull
? ta.crossunder(low , obj.top.get(0))
: ta.crossover (high, obj.btm.get(0))
switch bull
true => blalert.obtouch := true
false => bralert.obtouch := true
float tV = 0
obj.dV.clear()
seq = math.min(ob_num - 1, obj.avg.size() - 1)
for j = 0 to seq
tV += obj.cV.get(j)
if j == seq
for y = 0 to seq
obj.dV.unshift(
math.floor(
(obj.cV.get(y) / tV) * 100)
)
obj.dV.reverse()
for i = 0 to math.min(ob_num - 1, obj.avg.size() - 1)
dmL = draw.mL .get(i)
dOB = draw.ob .get(i)
dblB = draw.blB.get(i)
dbrB = draw.brB.get(i)
deOB = draw.eOB.get(i)
dOB.set_lefttop (obj.left .get(i) , obj.top.get(i))
deOB.set_lefttop (b.t , obj.top.get(i))
dOB.set_rightbottom (b.t , obj.btm.get(i))
deOB.set_rightbottom(b.t + (b.t - b.t ) * 100 , obj.btm.get(i))
if use_middle_line
dmL.set_xy1(obj.left.get(i), obj.avg.get(i))
dmL.set_xy2(b.t , obj.avg.get(i))
if ob_metrics_show
dblB.set_lefttop (obj.left.get(i), obj.top.get(i))
dbrB.set_lefttop (obj.left.get(i), obj.avg.get(i))
dblB.set_rightbottom(obj.left.get(i), obj.avg.get(i))
dbrB.set_rightbottom(obj.left.get(i), obj.btm.get(i))
rpBL = dblB.get_right()
rpBR = dbrB.get_right()
dbrB.set_right(rpBR + (b.t - b.t ) * obj.brVP.get(i))
dblB.set_right(rpBL + (b.t - b.t ) * obj.blVP.get(i))
if use_show_metric
txt = switch
obj.cV.get(i) >= 1000000000 => str.tostring(math.round(obj.cV.get(i) / 1000000000,3)) + "B"
obj.cV.get(i) >= 1000000 => str.tostring(math.round(obj.cV.get(i) / 1000000,3)) + "M"
obj.cV.get(i) >= 1000 => str.tostring(math.round(obj.cV.get(i) / 1000,3)) + "K"
obj.cV.get(i) < 1000 => str.tostring(math.round(obj.cV.get(i)))
deOB.set_text(
str.tostring(
txt + " (" + str.tostring(obj.dV.get(i)) + "%)")
)
deOB.set_text_size (size.auto)
deOB.set_text_halign(text.align_left)
deOB.set_text_color (use_grayscale ? color.silver : color.new(css, 0))
if ob_metrics_show and barstate.isconfirmed
if obj.wM.size() > 0
for i = 0 to obj.avg.size() - 1
switch obj.dir.get(i)
1 =>
switch obj.wM.get(i)
1 => obj.blVP.set(i, obj.blVP.get(i) + 1), obj.wM.set(i, 2)
2 => obj.blVP.set(i, obj.blVP.get(i) + 1), obj.wM.set(i, 3)
3 => obj.brVP.set(i, obj.brVP.get(i) + 1), obj.wM.set(i, 1)
-1 =>
switch obj.wM.get(i)
1 => obj.brVP.set(i, obj.brVP.get(i) + 1), obj.wM.set(i, 2)
2 => obj.brVP.set(i, obj.brVP.get(i) + 1), obj.wM.set(i, 3)
3 => obj.blVP.set(i, obj.blVP.get(i) + 1), obj.wM.set(i, 1)
var hN = array.new(1, b.n)
var lN = array.new(1, b.n)
var hS = array.new(1, b.n)
var lS = array.new(1, b.n)
if iH
hN.pop()
hN.unshift(int(b.n ))
if iL
lN.pop()
lN.unshift(int(b.n ))
if sH
hS.pop()
hS.unshift(int(b.n ))
if sL
lS.pop()
lS.unshift(int(b.n ))
if ob_show
bull_ob.drawVOB(true , ob_bull_css, hN.first(), false)
bear_ob.drawVOB(false, ob_bear_css, lN.first(), false)
if ob_swings
s_bull_ob.drawVOB(true , css_swing_up, hS.first(), true)
s_bear_ob.drawVOB(false, css_swing_dn, lS.first(), true)
if bull_ob
blalert.ob := true
if bear_ob
bralert.ob := true
if s_bull_ob
blalert.swingob := true
if s_bear_ob
blalert.swingob := true
//{----------------------------------------------------------------------------------------------------------------------------------------------}
//{----------------------------------------------------------------------------------------------------------------------------------------------}
//{----------------------------------------------------------------------------------------------------------------------------------------------}
//{----------------------------------------------------------------------------------------------------------------------------------------------}
//{ - End }
//{----------------------------------------------------------------------------------------------------------------------------------------------}
//{----------------------------------------------------------------------------------------------------------------------------------------------}
//{----------------------------------------------------------------------------------------------------------------------------------------------}
//{----------------------------------------------------------------------------------------------------------------------------------------------}
//{----------------------------------------------------------------------------------------------------------------------------------------------}
//{----------------------------------------------------------------------------------------------------------------------------------------------}
//{----------------------------------------------------------------------------------------------------------------------------------------------}
//{----------------------------------------------------------------------------------------------------------------------------------------------}
//{ - FVG | VI | OG }
//{----------------------------------------------------------------------------------------------------------------------------------------------}
//{----------------------------------------------------------------------------------------------------------------------------------------------}
//{----------------------------------------------------------------------------------------------------------------------------------------------}
//{----------------------------------------------------------------------------------------------------------------------------------------------}
ghl() => request.security(syminfo.tickerid, fvg_tf, [high , low , close , open ])
tfG() => request.security(syminfo.tickerid, fvg_tf, )
cG(bool bull) =>
= ghl()
= tfG()
var FVG draw = FVG.new(
array.new()
, array.new()
)
var FVG cords = array.new()
float pup = na
float pdn = na
bool cdn = na
int pos = 2
cc = timeframe.change(fvg_tf)
if barstate.isfirst
for i = 0 to fvg_num - 1
draw.box.unshift(box.new (na, na, na, na, border_color = color.new(color.white, 100), xloc = xloc.bar_time))
draw.ln.unshift (line.new(na, na, na, na, xloc = xloc.bar_time, width = 1, style = line.style_solid))
switch what_fvg
"FVG" =>
pup := bull ? gl : l
pdn := bull ? h : gh
cdn := bull ? gl > h and cc : gh < l and cc
pos := 2
"VI" =>
pup := bull
? (gc > go
? go
: gc)
: (gc > go
? go
: gc )
pdn := bull
? (gc > go
? gc
: go )
: (gc > go
? gc
: go)
cdn := bull
? go > gc and gh > gl and gc > gc and go > go and gh < math.min(gc, go) and cc
: go < gc and gl < gh and gc < gc and go < go and gl > math.max(gc, go) and cc
pos := 1
"OG" =>
pup := bull ? b.l : gl
p
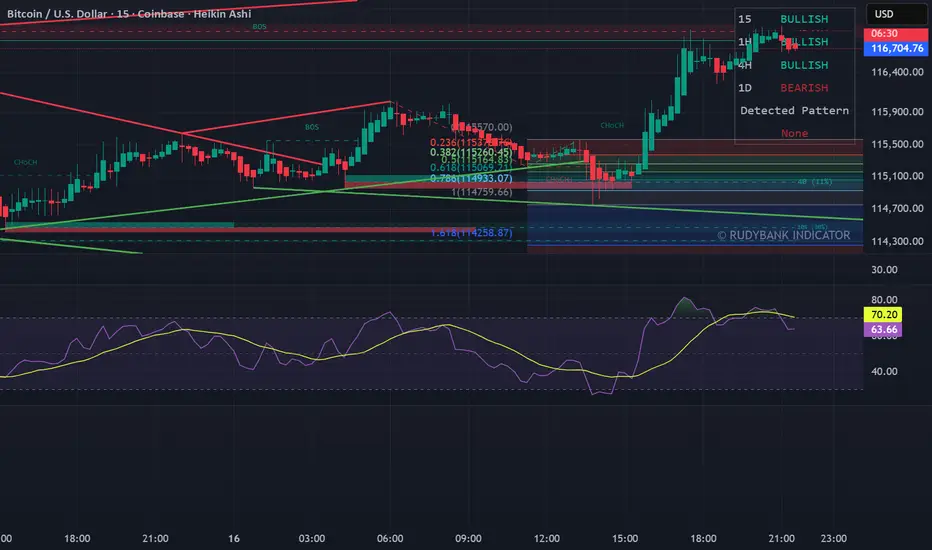
CCI Stochastic - YOSI
CCI Stochastic (Pro v6) – MTF, Adaptive Bands & Live Label
What it does
This indicator applies a Stochastic calculation on the CCI (K/D lines) to highlight momentum shifts, overbought/oversold zones, and adaptive market regimes. It comes with optional higher-timeframe confirmation, adaptive volatility bands, a live value label, and built-in alerts.
Key Features
Core Signal: Choose between D or K line of the Stoch-CCI.
Extreme Zones: Customizable OB/OS thresholds (default 80/20) and a midline (50), with dynamic background shading.
Adaptive Bands (optional): Mean ± k·standard deviation of the signal, to capture cyclic extremes.
MTF Confirmation (optional): Fetches the same signal from a higher timeframe via request.security.
Arrows/Signals:
Enter – Cross above OS (Buy) / below OB (Sell).
Center – Cross of the 50 midline (momentum shift).
Exit – Exit from extreme zones.
Alerts: All arrow signals + adaptive band crosses.
Live Value Label: Shows the latest signal value near the last bar, customizable decimals/offset/background colors.
Visuals: Red line above OB, green below OS, gray neutral; adaptive band fills.
Use Cases
Momentum / Reversals: Enter with OS/OB crosses confirmed by MTF.
Trend validation: Combine with moving averages (e.g., EMA200) or support/resistance.
Mean Reversion: Fade extreme zones, especially with adaptive band or OB/OS exit alerts.
Inputs
CCI Period, Stoch Period, Smooth K/D – core calculation.
Overbought / Oversold – thresholds (default 80/20).
Line to plot – K or D.
Show Arrows (Enter, Center, Exit) – visual control.
Adaptive Bands – length and k multiplier.
Higher TF – optional confirmation timeframe.
Live Label – decimals, offset, colors.
Quick Tips
For scalping/short-term setups: tighten OB/OS (e.g., 85/15) to filter noise.
In high volatility: increase adaptLen or decrease k to smooth bands.
Reduce false signals: require local + MTF alignment (e.g., only long if MTF > 50).
Disclaimer
This is a technical analysis tool – not a standalone buy/sell signal. Always use with proper risk management, key levels, and confluence from multiple factors.
מה זה עושה?
האינדיקטור מחשב Stochastic על CCI (קו K/D) ומציג אזורי קיצון, חציות ומשטרי שוק. הוא כולל אופציה לאישור מטיימפריים גבוה, בנדים אדפטיביים, תווית ערך חיה והתרעות מוכנות.
יכולות עיקריות
סיגנל מרכזי: בחירה בין קו D או K של Stoch-CCI.
אזורי קיצון: קווים ניתנים להגדרה (ברירת מחדל 80/20) וקו אמצע 50, עם צביעת רקע דינמית כשנכנסים לקיצון.
Adaptive Bands (אופציונלי): ממוצע ± k·סטיית תקן של הסיגנל—מסייע לזהות overheat ומחזוריות.
אישור MTF (אופציונלי): אותו סיגנל מטיימפריים גבוה באמצעות request.security.
חיצים/סיגנלים:
Enter – חציה מלמטה מעל OS (קנייה) / מלמעלה מתחת OB (מכירה).
Center – חציה של 50 (שינוי מומנטום).
Exit – יציאה מאזורים קיצוניים (OS/OB).
Alerts: לכל הסיגנלים לעיל + כניסה/יציאה לבנדים האדפטיביים.
תווית ערך חיה: מציגה את ערך הסיגנל האחרון ליד הנקודה (ספרות ו־offset ניתנים להגדרה).
עיצוב קריא: צבע קו אדום מעל OB, ירוק מתחת OS, אפור ניטרלי; מילוי אזורים.
שימוש מומלץ
מומנטום/היפוכים: כניסה עם חציה מה-OS/OB ואישור מה-MTF.
ממוצע נע/רמות מחיר: חברו לאימות מגמה (למשל EMA200 או תמיכה/התנגדות).
Mean Reversion: חיפוש חזרה מאזורי קיצון, במיוחד כשיש התרעת יציאה מ-OB/OS או נגיעה בבנד אדפטיבי.
קלטים מרכזיים
CCI Period, Stoch Period, Smooth K/D – פרמטרי חישוב.
Overbought / Oversold – ספי קיצון (ברירת מחדל 80/20).
Line to plot – בחירה בין K או D.
Show Arrows/Center/Exit/Enter – שליטה בתצוגת החיצים.
Adaptive Bands (len, k) – חלון ורגישות לבנדים.
Higher TF – טיימפריים לאישור (אופציונלי).
Live Label – ספרות, היסט ברים, צבעי רקע.
טיפים מהירים
בסקלפים/טווחים קצרים: הקשיחו ספי קיצון (למשל 85/15) להפחתת רעש.
בשוק תנודתי: העלו את adaptLen או הורידו את k כדי לקבל בנדים רגישים פחות.
להקטנת אותות שווא: דרשו התאמה בין הסיגנל המקומי ל-MTF (לדוגמה, לונג רק כשה-MTF מעל 50).
הערה חשובה
זהו כלי ניתוח טכני—לא אות קנייה/מכירה בפני עצמו. שלבו אותו עם ניהול סיכונים (SL/TP), בדיקת רמות מפתח ואימות ממספר אינדיקטורים או טיימפריימים.

order block new 113/// This work is licensed under a Attribution-NonCommercial-ShareAlike 4.0 International (CC BY-NC-SA 4.0) creativecommons.org
// © RUDYBANK INDICATOR - formerly know as RUDY INDICATOR
//@version=5
indicator("Price Action Concepts ", shorttitle = "RUDYINDICATOR-V1
- Price Action RUDYINDICATOR ", overlay = true, max_lines_count = 500, max_labels_count = 500, max_boxes_count = 500, max_bars_back = 500, max_polylines_count = 100)
//-----------------------------------------------------------------------------{
//Boolean set
//-----------------------------------------------------------------------------{
s_BOS = 0
s_CHoCH = 1
i_BOS = 2
i_CHoCH = 3
i_pp_CHoCH = 4
green_candle = 5
red_candle = 6
s_CHoCHP = 7
i_CHoCHP = 8
boolean =
array.from(
false
, false
, false
, false
, false
, false
, false
, false
, false
)
//-----------------------------------------------------------------------------{
// User inputs
//-----------------------------------------------------------------------------{
show_swing_ms = input.string ("All" , "Swing        " , inline = "1", group = "MARKET STRUCTURE" , options = )
show_internal_ms = input.string ("All" , "Internal     " , inline = "2", group = "MARKET STRUCTURE" , options = )
internal_r_lookback = input.int (5 , "" , inline = "2", group = "MARKET STRUCTURE" , minval = 2)
swing_r_lookback = input.int (50 , "" , inline = "1", group = "MARKET STRUCTURE" , minval = 2)
ms_mode = input.string ("Manual" , "Market Structure Mode" , inline = "a", group = "MARKET STRUCTURE" , tooltip = " Use selected lenght\n Use automatic lenght" ,options = )
show_mtf_str = input.bool (true , "MTF Scanner" , inline = "9", group = "MARKET STRUCTURE" , tooltip = "Display Multi-Timeframe Market Structure Trend Directions. Green = Bullish. Red = Bearish")
show_eql = input.bool (false , "Show EQH/EQL" , inline = "6", group = "MARKET STRUCTURE")
plotcandle_bool = input.bool (false , "Plotcandle" , inline = "3", group = "MARKET STRUCTURE" , tooltip = "Displays a cleaner colored candlestick chart in place of the default candles. (requires hiding the current ticker candles)")
barcolor_bool = input.bool (false , "Bar Color" , inline = "4", group = "MARKET STRUCTURE" , tooltip = "Color the candle bodies according to market strucutre trend")
i_ms_up_BOS = input.color (#089981 , "" , inline = "2", group = "MARKET STRUCTURE")
i_ms_dn_BOS = input.color (#f23645 , "" , inline = "2", group = "MARKET STRUCTURE")
s_ms_up_BOS = input.color (#089981 , "" , inline = "1", group = "MARKET STRUCTURE")
s_ms_dn_BOS = input.color (#f23645 , "" , inline = "1", group = "MARKET STRUCTURE")
lvl_daily = input.bool (false , "Day   " , inline = "1", group = "HIGHS & LOWS MTF")
lvl_weekly = input.bool (false , "Week " , inline = "2", group = "HIGHS & LOWS MTF")
lvl_monthly = input.bool (false , "Month" , inline = "3", group = "HIGHS & LOWS MTF")
lvl_yearly = input.bool (false , "Year  " , inline = "4", group = "HIGHS & LOWS MTF")
css_d = input.color (color.blue , "" , inline = "1", group = "HIGHS & LOWS MTF")
css_w = input.color (color.blue , "" , inline = "2", group = "HIGHS & LOWS MTF")
css_m = input.color (color.blue , "" , inline = "3", group = "HIGHS & LOWS MTF")
css_y = input.color (color.blue , "" , inline = "4", group = "HIGHS & LOWS MTF")
s_d = input.string ('⎯⎯⎯' , '' , inline = '1', group = 'HIGHS & LOWS MTF' , options = )
s_w = input.string ('⎯⎯⎯' , '' , inline = '2', group = 'HIGHS & LOWS MTF' , options = )
s_m = input.string ('⎯⎯⎯' , '' , inline = '3', group = 'HIGHS & LOWS MTF' , options = )
s_y = input.string ('⎯⎯⎯' , '' , inline = '4', group = 'HIGHS & LOWS MTF' , options = )
ob_show = input.bool (true , "Show Last    " , inline = "1", group = "VOLUMETRIC ORDER BLOCKS" , tooltip = "Display volumetric order blocks on the chart \n\n Ammount of volumetric order blocks to show")
ob_num = input.int (5 , "" , inline = "1", group = "VOLUMETRIC ORDER BLOCKS" , tooltip = "Orderblocks number", minval = 1, maxval = 10)
ob_metrics_show = input.bool (true , "Internal Buy/Sell Activity" , inline = "2", group = "VOLUMETRIC ORDER BLOCKS" , tooltip = "Display volume metrics that have formed the orderblock")
css_metric_up = input.color (color.new(#089981, 50) , "         " , inline = "2", group = "VOLUMETRIC ORDER BLOCKS")
css_metric_dn = input.color (color.new(#f23645 , 50) , "" , inline = "2", group = "VOLUMETRIC ORDER BLOCKS")
ob_swings = input.bool (false , "Swing Order Blocks" , inline = "a", group = "VOLUMETRIC ORDER BLOCKS" , tooltip = "Display swing volumetric order blocks")
css_swing_up = input.color (color.new(color.gray , 90) , "                 " , inline = "a", group = "VOLUMETRIC ORDER BLOCKS")
css_swing_dn = input.color (color.new(color.silver, 90) , "" , inline = "a", group = "VOLUMETRIC ORDER BLOCKS")
ob_filter = input.string ("None" , "Filtering             " , inline = "d", group = "VOLUMETRIC ORDER BLOCKS" , tooltip = "Filter out volumetric order blocks by BOS/CHoCH/CHoCH+", options = )
ob_mitigation = input.string ("Absolute" , "Mitigation           " , inline = "4", group = "VOLUMETRIC ORDER BLOCKS" , tooltip = "Trigger to remove volumetric order blocks", options = )
ob_pos = input.string ("Precise" , "Positioning          " , inline = "k", group = "VOLUMETRIC ORDER BLOCKS" , tooltip = "Position of the Order Block\n Cover the whole candle\n Cover half candle\n Adjust to volatility\n Same as Accurate but more precise", options = )
use_grayscale = input.bool (false , "Grayscale" , inline = "6", group = "VOLUMETRIC ORDER BLOCKS" , tooltip = "Use gray as basic order blocks color")
use_show_metric = input.bool (true , "Show Metrics" , inline = "7", group = "VOLUMETRIC ORDER BLOCKS" , tooltip = "Show volume associated with the orderblock and his relevance")
use_middle_line = input.bool (true , "Show Middle-Line" , inline = "8", group = "VOLUMETRIC ORDER BLOCKS" , tooltip = "Show mid-line order blocks")
use_overlap = input.bool (true , "Hide Overlap" , inline = "9", group = "VOLUMETRIC ORDER BLOCKS" , tooltip = "Hide overlapping order blocks")
use_overlap_method = input.string ("Previous" , "Overlap Method    " , inline = "Z", group = "VOLUMETRIC ORDER BLOCKS" , tooltip = " Preserve the most recent volumetric order blocks\n\n Preserve the previous volumetric order blocks", options = )
ob_bull_css = input.color (color.new(#089981 , 90) , "" , inline = "1", group = "VOLUMETRIC ORDER BLOCKS")
ob_bear_css = input.color (color.new(#f23645 , 90) , "" , inline = "1", group = "VOLUMETRIC ORDER BLOCKS")
show_acc_dist_zone = input.bool (false , "" , inline = "1", group = "Accumulation And Distribution")
zone_mode = input.string ("Fast" , "" , inline = "1", group = "Accumulation And Distribution" , tooltip = " Find small zone pattern formation\n Find bigger zone pattern formation" ,options = )
acc_css = input.color (color.new(#089981 , 60) , "" , inline = "1", group = "Accumulation And Distribution")
dist_css = input.color (color.new(#f23645 , 60) , "" , inline = "1", group = "Accumulation And Distribution")
show_lbl = input.bool (false , "Show swing point" , inline = "1", group = "High and Low" , tooltip = "Display swing point")
show_mtb = input.bool (false , "Show High/Low/Equilibrium" , inline = "2", group = "High and Low" , tooltip = "Display Strong/Weak High And Low and Equilibrium")
toplvl = input.color (color.red , "Premium Zone   " , inline = "3", group = "High and Low")
midlvl = input.color (color.gray , "Equilibrium Zone" , inline = "4", group = "High and Low")
btmlvl = input.color (#089981 , "Discount Zone    " , inline = "5", group = "High and Low")
fvg_enable = input.bool (false , "        " , inline = "1", group = "FAIR VALUE GAP" , tooltip = "Display fair value gap")
what_fvg = input.string ("FVG" , "" , inline = "1", group = "FAIR VALUE GAP" , tooltip = "Display fair value gap", options = )
fvg_num = input.int (5 , "Show Last  " , inline = "1a", group = "FAIR VALUE GAP" , tooltip = "Number of fvg to show")
fvg_upcss = input.color (color.new(#089981, 80) , "" , inline = "1", group = "FAIR VALUE GAP")
fvg_dncss = input.color (color.new(color.red , 80) , "" , inline = "1", group = "FAIR VALUE GAP")
fvg_extend = input.int (10 , "Extend FVG" , inline = "2", group = "FAIR VALUE GAP" , tooltip = "Extend the display of the FVG.")
fvg_src = input.string ("Close" , "Mitigation  " , inline = "3", group = "FAIR VALUE GAP" , tooltip = " Use the close of the body as trigger\n\n Use the extreme point of the body as trigger", options = )
fvg_tf = input.timeframe ("" , "Timeframe " , inline = "4", group = "FAIR VALUE GAP" , tooltip = "Timeframe of the fair value gap")
t = color.t (ob_bull_css)
invcol = color.new (color.white , 100)
//{----------------------------------------------------------------------------------------------------------------------------------------------}
//{----------------------------------------------------------------------------------------------------------------------------------------------}
//{----------------------------------------------------------------------------------------------------------------------------------------------}
//{----------------------------------------------------------------------------------------------------------------------------------------------}
//{ - UDT }
//{----------------------------------------------------------------------------------------------------------------------------------------------}
//{----------------------------------------------------------------------------------------------------------------------------------------------}
//{----------------------------------------------------------------------------------------------------------------------------------------------}
//{----------------------------------------------------------------------------------------------------------------------------------------------}
type bar
float o = open
float c = close
float h = high
float l = low
float v = volume
int n = bar_index
int t = time
type Zphl
line top
line bottom
label top_label
label bottom_label
bool stopcross
bool sbottomcross
bool itopcross
bool ibottomcross
string txtup
string txtdn
float topy
float bottomy
float topx
float bottomx
float tup
float tdn
int tupx
int tdnx
float itopy
float itopx
float ibottomy
float ibottomx
float uV
float dV
type FVG
box box
line ln
bool bull
float top
float btm
int left
int right
type ms
float p
int n
float l
type msDraw
int n
float p
color css
string txt
bool bull
type obC
float top
float btm
int left
float avg
float dV
float cV
int wM
int blVP
int brVP
int dir
float h
float l
int n
type obD
box ob
box eOB
box blB
box brB
line mL
type zone
chart.point points
float p
int c
int t
type hqlzone
box pbx
box ebx
box lbx
label plb
label elb
label lbl
type ehl
float pt
int t
float pb
int b
type pattern
string found = "None"
bool isfound = false
int period = 0
bool bull = false
type alerts
bool chochswing = false
bool chochplusswing = false
bool swingbos = false
bool chochplus = false
bool choch = false
bool bos = false
bool equal = false
bool ob = false
bool swingob = false
bool zone = false
bool fvg = false
bool obtouch = false
//{----------------------------------------------------------------------------------------------------------------------------------------------}
//{----------------------------------------------------------------------------------------------------------------------------------------------}
//{----------------------------------------------------------------------------------------------------------------------------------------------}
//{----------------------------------------------------------------------------------------------------------------------------------------------}
//{ - End }
//{----------------------------------------------------------------------------------------------------------------------------------------------}
//{----------------------------------------------------------------------------------------------------------------------------------------------}
//{----------------------------------------------------------------------------------------------------------------------------------------------}
//{----------------------------------------------------------------------------------------------------------------------------------------------}
//{----------------------------------------------------------------------------------------------------------------------------------------------}
//{----------------------------------------------------------------------------------------------------------------------------------------------}
//{----------------------------------------------------------------------------------------------------------------------------------------------}
//{----------------------------------------------------------------------------------------------------------------------------------------------}
//{ - General Setup }
//{----------------------------------------------------------------------------------------------------------------------------------------------}
//{----------------------------------------------------------------------------------------------------------------------------------------------}
//{----------------------------------------------------------------------------------------------------------------------------------------------}
//{----------------------------------------------------------------------------------------------------------------------------------------------}
bar b = bar.new()
var pattern p = pattern.new()
alerts blalert = alerts.new()
alerts bralert = alerts.new()
if p.isfound
p.period += 1
if p.period == 50
p.period := 0
p.found := "None"
p.isfound := false
p.bull := na
switch
b.c > b.o => boolean.set(green_candle, true)
b.c < b.o => boolean.set(red_candle , true)
f_zscore(src, lookback) =>
(src - ta.sma(src, lookback)) / ta.stdev(src, lookback)
var int iLen = internal_r_lookback
var int sLen = swing_r_lookback
vv = f_zscore(((close - close ) / close ) * 100,iLen)
if ms_mode == "Dynamic"
switch
vv >= 1.5 or vv <= -1.5 => iLen := 10
vv >= 1.6 or vv <= -1.6 => iLen := 9
vv >= 1.7 or vv <= -1.7 => iLen := 8
vv >= 1.8 or vv <= -1.8 => iLen := 7
vv >= 1.9 or vv <= -1.9 => iLen := 6
vv >= 2.0 or vv <= -2.0 => iLen := 5
=> iLen
var msline = array.new(0)
iH = ta.pivothigh(high, iLen, iLen)
sH = ta.pivothigh(high, sLen, sLen)
iL = ta.pivotlow (low , iLen, iLen)
sL = ta.pivotlow (low , sLen, sLen)
//{----------------------------------------------------------------------------------------------------------------------------------------------}
//{----------------------------------------------------------------------------------------------------------------------------------------------}
//{----------------------------------------------------------------------------------------------------------------------------------------------}
//{----------------------------------------------------------------------------------------------------------------------------------------------}
//{ - End }
//{----------------------------------------------------------------------------------------------------------------------------------------------}
//{----------------------------------------------------------------------------------------------------------------------------------------------}
//{----------------------------------------------------------------------------------------------------------------------------------------------}
//{----------------------------------------------------------------------------------------------------------------------------------------------}
//{----------------------------------------------------------------------------------------------------------------------------------------------}
//{----------------------------------------------------------------------------------------------------------------------------------------------}
//{----------------------------------------------------------------------------------------------------------------------------------------------}
//{----------------------------------------------------------------------------------------------------------------------------------------------}
//{ - ARRAYS }
//{----------------------------------------------------------------------------------------------------------------------------------------------}
//{----------------------------------------------------------------------------------------------------------------------------------------------}
//{----------------------------------------------------------------------------------------------------------------------------------------------}
//{----------------------------------------------------------------------------------------------------------------------------------------------}
hl () =>
= request.security(syminfo.tickerid , 'D' , hl() , lookahead = barmerge.lookahead_on)
= request.security(syminfo.tickerid , 'W' , hl() , lookahead = barmerge.lookahead_on)
= request.security(syminfo.tickerid , 'M' , hl() , lookahead = barmerge.lookahead_on)
= request.security(syminfo.tickerid , '12M', hl() , lookahead = barmerge.lookahead_on)
lstyle(style) =>
out = switch style
'⎯⎯⎯' => line.style_solid
'----' => line.style_dashed
'····' => line.style_dotted
mtfphl(h, l ,tf ,css, pdhl_style) =>
var line hl = line.new(
na
, na
, na
, na
, xloc = xloc.bar_time
, color = css
, style = lstyle(pdhl_style)
)
var line ll = line.new(
na
, na
, na
, na
, xloc = xloc.bar_time
, color = css
, style = lstyle(pdhl_style)
)
var label lbl = label.new(
na
, na
, xloc = xloc.bar_time
, text = str.format('P{0}L', tf)
, color = invcol
, textcolor = css
, size = size.small
, style = label.style_label_left
)
var label hlb = label.new(
na
, na
, xloc = xloc.bar_time
, text = str.format('P{0}H', tf)
, color = invcol
, textcolor = css
, size = size.small
, style = label.style_label_left
)
hy = ta.valuewhen(h != h , h , 1)
hx = ta.valuewhen(h == high , time , 1)
ly = ta.valuewhen(l != l , l , 1)
lx = ta.valuewhen(l == low , time , 1)
if barstate.islast
extension = time + (time - time ) * 50
line.set_xy1(hl , hx , hy)
line.set_xy2(hl , extension , hy)
label.set_xy(hlb, extension , hy)
line.set_xy1(ll , lx , ly)
line.set_xy2(ll , extension , ly)
label.set_xy(lbl, extension , ly)
if lvl_daily
mtfphl(pdh , pdl , 'D' , css_d, s_d)
if lvl_weekly
mtfphl(pwh , pwl , 'W' , css_w, s_w)
if lvl_monthly
mtfphl(pmh , pml, 'M' , css_m, s_m)
if lvl_yearly
mtfphl(pyh , pyl , '12M', css_y, s_y)
//{----------------------------------------------------------------------------------------------------------------------------------------------}
//{----------------------------------------------------------------------------------------------------------------------------------------------}
//{----------------------------------------------------------------------------------------------------------------------------------------------}
//{----------------------------------------------------------------------------------------------------------------------------------------------}
//{ - End }
//{----------------------------------------------------------------------------------------------------------------------------------------------}
//{----------------------------------------------------------------------------------------------------------------------------------------------}
//{----------------------------------------------------------------------------------------------------------------------------------------------}
//{----------------------------------------------------------------------------------------------------------------------------------------------}
//{----------------------------------------------------------------------------------------------------------------------------------------------}
//{----------------------------------------------------------------------------------------------------------------------------------------------}
//{----------------------------------------------------------------------------------------------------------------------------------------------}
//{----------------------------------------------------------------------------------------------------------------------------------------------}
//{ - Market Structure }
//{----------------------------------------------------------------------------------------------------------------------------------------------}
//{----------------------------------------------------------------------------------------------------------------------------------------------}
//{----------------------------------------------------------------------------------------------------------------------------------------------}
//{----------------------------------------------------------------------------------------------------------------------------------------------}
method darkcss(color css, float factor, bool bull) =>
blue = color.b(css) * (1 - factor)
red = color.r(css) * (1 - factor)
green = color.g(css) * (1 - factor)
color.rgb(red, green, blue, 0)
method f_line(msDraw d, size, style) =>
var line id = na
var label lbl = na
id := line.new(
d.n
, d.p
, b.n
, d.p
, color = d.css
, width = 1
, style = style
)
if msline.size() >= 250
line.delete(msline.shift())
msline.push(id)
lbl := label.new(
int(math.avg(d.n, b.n))
, d.p
, d.txt
, color = invcol
, textcolor = d.css
, style = d.bull ? label.style_label_down : label.style_label_up
, size = size
, text_font_family = font.family_monospace
)
structure(bool mtf) =>
msDraw drw = na
bool isdrw = false
bool isdrwS = false
var color css = na
var color icss = na
var int itrend = 0
var int trend = 0
bool bull_ob = false
bool bear_ob = false
bool s_bull_ob = false
bool s_bear_ob = false
n = bar_index
var ms up = ms.new(
array.new()
, array.new< int >()
, array.new()
)
var ms dn = ms.new(
array.new()
, array.new< int >()
, array.new()
)
var ms sup = ms.new(
array.new()
, array.new< int >()
, array.new()
)
var ms sdn = ms.new(
array.new()
, array.new< int >()
, array.new()
)
switch show_swing_ms
"All" => boolean.set(s_BOS , true ), boolean.set(s_CHoCH, true ) , boolean.set(s_CHoCHP, true )
"CHoCH" => boolean.set(s_BOS , false), boolean.set(s_CHoCH, true ) , boolean.set(s_CHoCHP, false )
"CHoCH+" => boolean.set(s_BOS , false), boolean.set(s_CHoCH, false) , boolean.set(s_CHoCHP, true )
"BOS" => boolean.set(s_BOS , true ), boolean.set(s_CHoCH, false) , boolean.set(s_CHoCHP, false )
"None" => boolean.set(s_BOS , false), boolean.set(s_CHoCH, false) , boolean.set(s_CHoCHP, false )
=> na
switch show_internal_ms
"All" => boolean.set(i_BOS, true ), boolean.set(i_CHoCH, true ), boolean.set(i_CHoCHP, true )
"CHoCH" => boolean.set(i_BOS, false), boolean.set(i_CHoCH, true ), boolean.set(i_CHoCHP, false)
"CHoCH+" => boolean.set(i_BOS, false), boolean.set(i_CHoCH, false ), boolean.set(i_CHoCHP, true )
"BOS" => boolean.set(i_BOS, true ), boolean.set(i_CHoCH, false ), boolean.set(i_CHoCHP, false)
"None" => boolean.set(i_BOS, false), boolean.set(i_CHoCH, false ), boolean.set(i_CHoCHP, false)
=> na
switch
iH =>
up.p.unshift(b.h )
up.l.unshift(b.h )
up.n.unshift(n )
iL =>
dn.p.unshift(b.l )
dn.l.unshift(b.l )
dn.n.unshift(n )
sL =>
sdn.p.unshift(b.l )
sdn.l.unshift(b.l )
sdn.n.unshift(n )
sH =>
sup.p.unshift(b.h )
sup.l.unshift(b.h )
sup.n.unshift(n )
// INTERNAL BULLISH STRUCTURE
if up.p.size() > 0 and dn.l.size() > 1
if ta.crossover(b.c, up.p.first())
bool CHoCH = na
string txt = na
if itrend < 0
CHoCH := true
switch
not CHoCH =>
txt := "BOS"
css := i_ms_up_BOS
blalert.bos := true
if boolean.get(i_BOS) and mtf == false and na(drw)
isdrw := true
drw := msDraw.new(
up.n.first()
, up.p.first()
, i_ms_up_BOS
, txt
, true
)
CHoCH =>
dn.l.first() > dn.l.get(1) ? blalert.chochplus : blalert.choch
txt := dn.l.first() > dn.l.get(1) ? "CHoCH+" : "CHoCH"
css := i_ms_up_BOS.darkcss(0.25, true)
if (dn.l.first() > dn.l.get(1) ? boolean.get(i_CHoCHP) : boolean.get(i_CHoCH)) and mtf == false and na(drw)
isdrw := true
drw := msDraw.new(
up.n.first()
, up.p.first()
, i_ms_up_BOS.darkcss(0.25, true)
, txt
, true
)
if mtf == false
switch
ob_filter == "None" => bull_ob := true
ob_filter == "BOS" and txt == "BOS" => bull_ob := true
ob_filter == "CHoCH" and txt == "CHoCH" => bull_ob := true
ob_filter == "CHoCH+" and txt == "CHoCH+" => bull_ob := true
itrend := 1
up.n.clear()
up.p.clear()
// INTERNAL BEARISH STRUCTURE
if dn.p.size() > 0 and up.l.size() > 1
if ta.crossunder(b.c, dn.p.first())
bool CHoCH = na
string txt = na
if itrend > 0
CHoCH := true
switch
not CHoCH =>
bralert.bos := true
txt := "BOS"
css := i_ms_dn_BOS
if boolean.get(i_BOS) and mtf == false and na(drw)
isdrw := true
drw := msDraw.new(
dn.n.first()
, dn.p.first()
, i_ms_dn_BOS
, txt
, false
)
CHoCH =>
if up.l.first() < up.l.get(1)
bralert.chochplus := true
else
bralert.choch := true
txt := up.l.first() < up.l.get(1) ? "CHoCH+" : "CHoCH"
css := i_ms_dn_BOS.darkcss(0.25, false)
if (up.l.first() < up.l.get(1) ? boolean.get(i_CHoCHP) : boolean.get(i_CHoCH)) and mtf == false and na(drw)
isdrw := true
drw := msDraw.new(
dn.n.first()
, dn.p.first()
, i_ms_dn_BOS.darkcss(0.25, false)
, txt
, false
)
if mtf == false
switch
ob_filter == "None" => bear_ob := true
ob_filter == "BOS" and txt == "BOS" => bear_ob := true
ob_filter == "CHoCH" and txt == "CHoCH" => bear_ob := true
ob_filter == "CHoCH+" and txt == "CHoCH+" => bear_ob := true
itrend := -1
dn.n.clear()
dn.p.clear()
// SWING BULLISH STRUCTURE
if sup.p.size() > 0 and sdn.l.size() > 1
if ta.crossover(b.c, sup.p.first())
bool CHoCH = na
string txt = na
if trend < 0
CHoCH := true
switch
not CHoCH =>
blalert.swingbos := true
txt := "BOS"
icss := s_ms_up_BOS
if boolean.get(s_BOS) and mtf == false and na(drw)
isdrwS := true
drw := msDraw.new(
sup.n.first()
, sup.p.first()
, s_ms_up_BOS
, txt
, true
)
CHoCH =>
if sdn.l.first() > sdn.l.get(1)
blalert.chochplusswing := true
else
blalert.chochswing := true
txt := sdn.l.first() > sdn.l.get(1) ? "CHoCH+" : "CHoCH"
icss := s_ms_up_BOS.darkcss(0.25, true)
if (sdn.l.first() > sdn.l.get(1) ? boolean.get(s_CHoCHP) : boolean.get(s_CHoCH)) and mtf == false and na(drw)
isdrwS := true
drw := msDraw.new(
sup.n.first()
, sup.p.first()
, s_ms_up_BOS.darkcss(0.25, true)
, txt
, true
)
if mtf == false
switch
ob_filter == "None" => s_bull_ob := true
ob_filter == "BOS" and txt == "BOS" => s_bull_ob := true
ob_filter == "CHoCH" and txt == "CHoCH" => s_bull_ob := true
ob_filter == "CHoCH+" and txt == "CHoCH+" => s_bull_ob := true
trend := 1
sup.n.clear()
sup.p.clear()
// SWING BEARISH STRUCTURE
if sdn.p.size() > 0 and sup.l.size() > 1
if ta.crossunder(b.c, sdn.p.first())
bool CHoCH = na
string txt = na
if trend > 0
CHoCH := true
switch
not CHoCH =>
bralert.swingbos := true
txt := "BOS"
icss := s_ms_dn_BOS
if boolean.get(s_BOS) and mtf == false and na(drw)
isdrwS := true
drw := msDraw.new(
sdn.n.first()
, sdn.p.first()
, s_ms_dn_BOS
, txt
, false
)
CHoCH =>
if sup.l.first() < sup.l.get(1)
bralert.chochplusswing := true
else
bralert.chochswing := true
txt := sup.l.first() < sup.l.get(1) ? "CHoCH+" : "CHoCH"
icss := s_ms_dn_BOS.darkcss(0.25, false)
if (sup.l.first() < sup.l.get(1) ? boolean.get(s_CHoCHP) : boolean.get(s_CHoCH)) and mtf == false and na(drw)
isdrwS := true
drw := msDraw.new(
sdn.n.first()
, sdn.p.first()
, s_ms_dn_BOS.darkcss(0.25, false)
, txt
, false
)
if mtf == false
switch
ob_filter == "None" => s_bear_ob := true
ob_filter == "BOS" and txt == "BOS" => s_bear_ob := true
ob_filter == "CHoCH" and txt == "CHoCH" => s_bear_ob := true
ob_filter == "CHoCH+" and txt == "CHoCH+" => s_bear_ob := true
trend := -1
sdn.n.clear()
sdn.p.clear()
= structure(false)
if isdrw
f_line(drw, size.small, line.style_dashed)
if isdrwS
f_line(drw, size.small, line.style_solid)
= request.security("", "15" , structure(true))
= request.security("", "60" , structure(true))
= request.security("", "240" , structure(true))
= request.security("", "1440" , structure(true))
if show_mtf_str
var tab = table.new(position = position.top_right, columns = 10, rows = 10, bgcolor = na, frame_color = color.rgb(54, 58, 69, 0), frame_width = 1, border_color = color.rgb(54, 58, 69, 100), border_width = 1)
table.cell(tab, 0, 1, text = "15" , text_color = color.silver, text_halign = text.align_center, text_size = size.normal, bgcolor = chart.bg_color, text_font_family = font.family_monospace, width = 2)
table.cell(tab, 0, 2, text = "1H" , text_color = color.silver, text_halign = text.align_center, text_size = size.normal, bgcolor = chart.bg_color, text_font_family = font.family_monospace, width = 2)
table.cell(tab, 0, 3, text = "4H" , text_color = color.silver, text_halign = text.align_center, text_size = size.normal, bgcolor = chart.bg_color, text_font_family = font.family_monospace, width = 2)
table.cell(tab, 0, 4, text = "1D" , text_color = color.silver, text_halign = text.align_center, text_size = size.normal, bgcolor = chart.bg_color, text_font_family = font.family_monospace, width = 2)
table.cell(tab, 1, 1, text = itrend15 == 1 ? "BULLISH" : itrend15 == -1 ? "BEARISH" : na , text_halign = text.align_center, text_size = size.normal, text_color = itrend15 == 1 ? i_ms_up_BOS.darkcss(-0.25, true) : itrend15 == -1 ? i_ms_dn_BOS.darkcss(0.25, false) : color.gray, bgcolor = chart.bg_color, text_font_family = font.family_monospace)
table.cell(tab, 1, 2, text = itrend1H == 1 ? "BULLISH" : itrend1H == -1 ? "BEARISH" : na , text_halign = text.align_center, text_size = size.normal, text_color = itrend1H == 1 ? i_ms_up_BOS.darkcss(-0.25, true) : itrend1H == -1 ? i_ms_dn_BOS.darkcss(0.25, false) : color.gray, bgcolor = chart.bg_color, text_font_family = font.family_monospace)
table.cell(tab, 1, 3, text = itrend4H == 1 ? "BULLISH" : itrend4H == -1 ? "BEARISH" : na , text_halign = text.align_center, text_size = size.normal, text_color = itrend4H == 1 ? i_ms_up_BOS.darkcss(-0.25, true) : itrend4H == -1 ? i_ms_dn_BOS.darkcss(0.25, false) : color.gray, bgcolor = chart.bg_color, text_font_family = font.family_monospace)
table.cell(tab, 1, 4, text = itrend1D == 1 ? "BULLISH" : itrend1D == -1 ? "BEARISH" : na , text_halign = text.align_center, text_size = size.normal, text_color = itrend1D == 1 ? i_ms_up_BOS.darkcss(-0.25, true) : itrend1D == -1 ? i_ms_dn_BOS.darkcss(0.25, false) : color.gray, bgcolor = chart.bg_color, text_font_family = font.family_monospace)
table.cell(tab, 0, 5, text = "Detected Pattern", text_halign = text.align_center, text_size = size.normal, text_color = color.silver, bgcolor = chart.bg_color, text_font_family = font.family_monospace)
table.cell(tab, 0, 6, text = p.found, text_halign = text.align_center, text_size = size.normal, text_color = na(p.bull) ? color.white : p.bull ? i_ms_up_BOS.darkcss(-0.25, true) : p.bull == false ? i_ms_dn_BOS.darkcss(0.25, false) : na, bgcolor = chart.bg_color, text_font_family = font.family_monospace)
table.merge_cells(tab, 0, 5, 1, 5)
table.merge_cells(tab, 0, 6, 1, 6)
//{----------------------------------------------------------------------------------------------------------------------------------------------}
//{----------------------------------------------------------------------------------------------------------------------------------------------}
//{----------------------------------------------------------------------------------------------------------------------------------------------}
//{----------------------------------------------------------------------------------------------------------------------------------------------}
//{ - End }
//{----------------------------------------------------------------------------------------------------------------------------------------------}
//{----------------------------------------------------------------------------------------------------------------------------------------------}
//{----------------------------------------------------------------------------------------------------------------------------------------------}
//{----------------------------------------------------------------------------------------------------------------------------------------------}
//{----------------------------------------------------------------------------------------------------------------------------------------------}
//{----------------------------------------------------------------------------------------------------------------------------------------------}
//{----------------------------------------------------------------------------------------------------------------------------------------------}
//{----------------------------------------------------------------------------------------------------------------------------------------------}
//{ - Strong/Weak High/Low And Equilibrium }
//{----------------------------------------------------------------------------------------------------------------------------------------------}
//{----------------------------------------------------------------------------------------------------------------------------------------------}
//{----------------------------------------------------------------------------------------------------------------------------------------------}
//{----------------------------------------------------------------------------------------------------------------------------------------------}
var phl = Zphl.new(
na
, na
, label.new(na , na , color = invcol , textcolor = i_ms_dn_BOS , style = label.style_label_down , size = size.tiny , text = "")
, label.new(na , na , color = invcol , textcolor = i_ms_up_BOS , style = label.style_label_up , size = size.tiny , text = "")
, true
, true
, true
, true
, ""
, ""
, 0
, 0
, 0
, 0
, high
, low
, 0
, 0
, 0
, 0
, 0
, 0
, na
, na
)
zhl(len)=>
upper = ta.highest(len)
lower = ta.lowest(len)
var float out = 0
out := b.h > upper ? 0 : b.l < lower ? 1 : out
top = out == 0 and out != 0 ? b.h : 0
btm = out == 1 and out != 1 ? b.l : 0
= zhl(sLen)
= zhl(iLen)
upphl(trend) =>
var label lbl = label.new(
na
, na
, color = invcol
, textcolor = toplvl
, style = label.style_label_down
, size = size.small
)
if top
phl.stopcross := true
phl.txtup := top > phl.topy ? "HH" : "HL"
if show_lbl
topl = label.new(
b.n - swing_r_lookback
, top
, phl.txtup
, color = invcol
, textcolor = toplvl
, style = label.style_label_down
, size = size.small
)
line.delete(phl.top )
phl.top := line.new(
b.n - sLen
, top
, b.n
, top
, color = toplvl)
phl.topy := top
phl.topx := b.n - sLen
phl.tup := top
phl.tupx := b.n - sLen
if itop
phl.itopcross := true
phl.itopy := itop
phl.itopx := b.n - iLen
phl.tup := math.max(high, phl.tup)
phl.tupx := phl.tup == high ? b.n : phl.tupx
phl.uV := phl.tup != phl.tup ? b.v : phl.uV
if barstate.islast
line.set_xy1(
phl.top
, phl.tupx
, phl.tup
)
line.set_xy2(
phl.top
, b.n + 50
, phl.tup
)
label.set_x(
lbl
, b.n + 50
)
label.set_y(
lbl
, phl.tup
)
dist = math.abs(phl.uV / (phl.uV + phl.dV)) * 100
label.set_text (lbl, trend < 0
? "Strong High | " + str.tostring(phl.uV, format.volume) + " (" + str.tostring(math.round(dist,0)) + "%)"
: "Weak High | " + str.tostring(phl.uV, format.volume) + " (" + str.tostring(math.round(dist,0)) + "%)")
dnphl(trend) =>
var label lbl = label.new(
na
, na
, color = invcol
, textcolor = btmlvl
, style = label.style_label_up
, size = size.small
)
if btm
phl.sbottomcross := true
phl.txtdn := btm > phl.bottomy ? "LH" : "LL"
if show_lbl
btml = label.new(
b.n - swing_r_lookback
, btm, phl.txtdn
, color = invcol
, textcolor = btmlvl
, style = label.style_label_up
, size = size.small
)
line.delete(phl.bottom )
phl.bottom := line.new(
b.n - sLen
, btm
, b.n
, btm
, color = btmlvl
)
phl.bottomy := btm
phl.bottomx := b.n - sLen
phl.tdn := btm
phl.tdnx := b.n - sLen
if ibtm
phl.ibottomcross := true
phl.ibottomy := ibtm
phl.ibottomx := b.n - iLen
phl.tdn := math.min(low, phl.tdn)
phl.tdnx := phl.tdn == low ? b.n : phl.tdnx
phl.dV := phl.tdn != phl.tdn ? b.v : phl.dV
if barstate.islast
line.set_xy1(
phl.bottom
, phl.tdnx
, phl.tdn
)
line.set_xy2(
phl.bottom
, b.n + 50
, phl.tdn
)
label.set_x(
lbl
, b.n + 50
)
label.set_y(
lbl
, phl.tdn
)
dist = math.abs(phl.dV / (phl.uV + phl.dV)) * 100
label.set_text (lbl, trend > 0
? "Strong Low | " + str.tostring(phl.dV, format.volume) + " (" + str.tostring(math.round(dist,0)) + "%)"
: "Weak Low | " + str.tostring(phl.uV, format.volume) + " (" + str.tostring(math.round(dist,0)) + "%)")
midphl() =>
avg = math.avg(phl.bottom.get_y2(), phl.top.get_y2())
var line l = line.new(
y1 = avg
, y2 = avg
, x1 = b.n - sLen
, x2 = b.n + 50
, color = midlvl
, style = line.style_solid
)
var label lbl = label.new(
x = b.n + 50
, y = avg
, text = "Equilibrium"
, style = label.style_label_left
, color = invcol
, textcolor = midlvl
, size = size.small
)
if barstate.islast
more = (phl.bottom.get_x1() + phl.bottom.get_x2()) > (phl.top.get_x1() + phl.top.get_x2()) ? phl.top.get_x1() : phl.bottom.get_x1()
line.set_xy1(l , more , avg)
line.set_xy2(l , b.n + 50, avg)
label.set_x (lbl , b.n + 50 )
label.set_y (lbl , avg )
dist = math.abs((l.get_y2() - close) / close) * 100
label.set_text (lbl, "Equilibrium (" + str.tostring(math.round(dist,0)) + "%)")
hqlzone() =>
if barstate.islast
var hqlzone dZone = hqlzone.new(
box.new(
na
, na
, na
, na
, bgcolor = color.new(toplvl, 70)
, border_color = na
)
, box.new(
na
, na
, na
, na
, bgcolor = color.new(midlvl, 70)
, border_color = na
)
, box.new(
na
, na
, na
, na
, bgcolor = color.new(btmlvl, 70)
, border_color = na
)
, label.new(na, na, text = "Premium" , color = invcol, textcolor = toplvl, style = label.style_label_down, size = size.small)
, label.new(na, na, text = "Equilibrium", color = invcol, textcolor = midlvl, style = label.style_label_left, size = size.small)
, label.new(na, na, text = "Discount" , color = invcol, textcolor = btmlvl, style = label.style_label_up , size = size.small)
)
dZone.pbx.set_lefttop(int(math.max(phl.topx, phl.bottomx)) , phl.tup)
dZone.pbx.set_rightbottom(b.n + 50 , 0.95 * phl.tup + 0.05 * phl.tdn)
dZone.ebx.set_lefttop(int(math.max(phl.topx, phl.bottomx)), 0.525 * phl.tup + 0.475 * phl.tdn)
dZone.ebx.set_rightbottom(b.n + 50 , 0.525 * phl.tdn + 0.475 * phl.tup)
dZone.lbx.set_lefttop(int(math.max(phl.topx, phl.bottomx)), 0.95 * phl.tdn + 0.05 * phl.tup)
dZone.lbx.set_rightbottom(b.n + 50 , phl.tdn)
dZone.plb.set_xy( int(math.avg(math.max(phl.topx, phl.bottomx), int(b.n + 50))) , phl.tup)
dZone.elb.set_xy( int(b.n + 50) , math.avg(phl.tup, phl.tdn))
dZone.lbl.set_xy( int(math.avg(math.max(phl.topx, phl.bottomx), int(b.n + 50))) , phl.tdn)
if show_mtb
upphl (trend)
dnphl (trend)
hqlzone()
//{----------------------------------------------------------------------------------------------------------------------------------------------}
//{----------------------------------------------------------------------------------------------------------------------------------------------}
//{----------------------------------------------------------------------------------------------------------------------------------------------}
//{----------------------------------------------------------------------------------------------------------------------------------------------}
//{ - End }
//{----------------------------------------------------------------------------------------------------------------------------------------------}
//{----------------------------------------------------------------------------------------------------------------------------------------------}
//{----------------------------------------------------------------------------------------------------------------------------------------------}
//{----------------------------------------------------------------------------------------------------------------------------------------------}
//{----------------------------------------------------------------------------------------------------------------------------------------------}
//{----------------------------------------------------------------------------------------------------------------------------------------------}
//{----------------------------------------------------------------------------------------------------------------------------------------------}
//{----------------------------------------------------------------------------------------------------------------------------------------------}
//{ - Volumetric Order Block }
//{----------------------------------------------------------------------------------------------------------------------------------------------}
//{----------------------------------------------------------------------------------------------------------------------------------------------}
//{----------------------------------------------------------------------------------------------------------------------------------------------}
//{----------------------------------------------------------------------------------------------------------------------------------------------}
method eB(box b, bool ext, color css, bool swing) =>
b.unshift(
box.new(
na
, na
, na
, na
, xloc = xloc.bar_time
, text_font_family = font.family_monospace
, extend = ext ? extend.right : extend.none
, border_color = swing ? color.new(css, 0) : color.new(color.white,100)
, bgcolor = css
, border_width = 1
)
)
method eL(line l, bool ext, bool solid, color css) =>
l.unshift(
line.new(
na
, na
, na
, na
, width = 1
, color = css
, xloc = xloc.bar_time
, extend = ext ? extend.right : extend.none
, style = solid ? line.style_solid : line.style_dashed
)
)
method drawVOB(bool cdn, bool bull, color css, int loc, bool swing) =>
= request.security(
syminfo.tickerid
, ""
,
, lookahead = barmerge.lookahead_off
)
var obC obj = obC.new(
array.new()
, array.new()
, array.new< int >()
, array.new()
, array.new()
, array.new()
, array.new< int >()
, array.new< int >()
, array.new< int >()
, array.new< int >()
, array.new()
, array.new()
, array.new< int >()
)
var obD draw = obD.new(
array.new()
, array.new()
, array.new()
, array.new()
, array.new()
)
if barstate.isfirst
for i = 0 to ob_num - 1
draw.mL .eL(false, false, use_grayscale ? color.new(color.gray, 0) : color.new(css,0))
draw.ob .eB(false, use_grayscale ? color.new(color.gray, 90) : css, swing)
draw.blB.eB(false, css_metric_up , swing)
draw.brB.eB(false, css_metric_dn , swing)
draw.eOB.eB(true , use_grayscale ? color.new(color.gray, 90) : css, swing)
float pos = ob_pos == "Full"
? (bull ? high : low)
: ob_pos == "Middle"
? ohlc4
: ob_pos == "Accurate"
? hl2
: hl2
if cdn
obj.h.clear()
obj.l.clear()
obj.n.clear()
for i = 0 to math.abs((loc - b.n)) - 1
obj.h.push(hH )
obj.l.push(lL )
obj.n.push(b.t )
// obj.h.reverse()
// obj.l.reverse()
int iU = obj.l.indexof(obj.l.min()) + 1
int iD = obj.h.indexof(obj.h.max()) + 1
obj.dir.unshift(
bull
? (b.c > b.o ? 1 : -1)
: (b.c > b.o ? 1 : -1)
)
obj.top.unshift(
bull
? pos
: obj.h.max()
)
obj.btm.unshift(
bull
? obj.l.min()
: pos
)
obj.left.unshift(
bull
? obj.n.get(obj.l.indexof(obj.l.min()))
: obj.n.get(obj.h.indexof(obj.h.max()))
)
obj.avg.unshift(
math.avg(obj.top.first(), obj.btm.first())
)
obj.cV.unshift(
bull
? b.v
: b.v
)
if ob_pos == "Precise"
switch bull
true =>
if obj.avg.get(0) < (b.c < b.o ? b.c : b.o ) and obj.top.get(0) > hlcc4
obj.top.set(0, obj.avg.get(0))
obj.avg.set(0, math.avg(obj.top.first(), obj.btm.first()))
false =>
if obj.avg.get(0) > (b.c < b.o ? b.o : b.c ) and obj.btm.get(0) < hlcc4
obj.btm.set(0, obj.avg.get(0))
obj.avg.set(0, math.avg(obj.top.first(), obj.btm.first()))
obj.blVP.unshift ( 0 )
obj.brVP.unshift ( 0 )
obj.wM .unshift ( 1 )
if use_overlap
int rmP = use_overlap_method == "Recent" ? 1 : 0
if obj.avg.size() > 1
if bull
? obj.btm.first() < obj.top.get(1)
: obj.top.first() > obj.btm.get(1)
obj.wM .remove(rmP)
obj.cV .remove(rmP)
obj.dir .remove(rmP)
obj.top .remove(rmP)
obj.avg .remove(rmP)
obj.btm .remove(rmP)
obj.left .remove(rmP)
obj.blVP .remove(rmP)
obj.brVP .remove(rmP)
if barstate.isconfirmed
for x = 0 to ob_num - 1
tg = switch ob_mitigation
"Middle" => obj.avg
"Absolute" => bull ? obj.btm : obj.top
for in tg
if (bull ? cC < pt : cC > pt)
obj.wM .remove(idx)
obj.cV .remove(idx)
obj.dir .remove(idx)
obj.top .remove(idx)
obj.avg .remove(idx)
obj.btm .remove(idx)
obj.left .remove(idx)
obj.blVP .remove(idx)
obj.brVP .remove(idx)
if barstate.islast
if obj.avg.size() > 0
// Alert
if bull
? ta.crossunder(low , obj.top.get(0))
: ta.crossover (high, obj.btm.get(0))
switch bull
true => blalert.obtouch := true
false => bralert.obtouch := true
float tV = 0
obj.dV.clear()
seq = math.min(ob_num - 1, obj.avg.size() - 1)
for j = 0 to seq
tV += obj.cV.get(j)
if j == seq
for y = 0 to seq
obj.dV.unshift(
math.floor(
(obj.cV.get(y) / tV) * 100)
)
obj.dV.reverse()
for i = 0 to math.min(ob_num - 1, obj.avg.size() - 1)
dmL = draw.mL .get(i)
dOB = draw.ob .get(i)
dblB = draw.blB.get(i)
dbrB = draw.brB.get(i)
deOB = draw.eOB.get(i)
dOB.set_lefttop (obj.left .get(i) , obj.top.get(i))
deOB.set_lefttop (b.t , obj.top.get(i))
dOB.set_rightbottom (b.t , obj.btm.get(i))
deOB.set_rightbottom(b.t + (b.t - b.t ) * 100 , obj.btm.get(i))
if use_middle_line
dmL.set_xy1(obj.left.get(i), obj.avg.get(i))
dmL.set_xy2(b.t , obj.avg.get(i))
if ob_metrics_show
dblB.set_lefttop (obj.left.get(i), obj.top.get(i))
dbrB.set_lefttop (obj.left.get(i), obj.avg.get(i))
dblB.set_rightbottom(obj.left.get(i), obj.avg.get(i))
dbrB.set_rightbottom(obj.left.get(i), obj.btm.get(i))
rpBL = dblB.get_right()
rpBR = dbrB.get_right()
dbrB.set_right(rpBR + (b.t - b.t ) * obj.brVP.get(i))
dblB.set_right(rpBL + (b.t - b.t ) * obj.blVP.get(i))
if use_show_metric
txt = switch
obj.cV.get(i) >= 1000000000 => str.tostring(math.round(obj.cV.get(i) / 1000000000,3)) + "B"
obj.cV.get(i) >= 1000000 => str.tostring(math.round(obj.cV.get(i) / 1000000,3)) + "M"
obj.cV.get(i) >= 1000 => str.tostring(math.round(obj.cV.get(i) / 1000,3)) + "K"
obj.cV.get(i) < 1000 => str.tostring(math.round(obj.cV.get(i)))
deOB.set_text(
str.tostring(
txt + " (" + str.tostring(obj.dV.get(i)) + "%)")
)
deOB.set_text_size (size.auto)
deOB.set_text_halign(text.align_left)
deOB.set_text_color (use_grayscale ? color.silver : color.new(css, 0))
if ob_metrics_show and barstate.isconfirmed
if obj.wM.size() > 0
for i = 0 to obj.avg.size() - 1
switch obj.dir.get(i)
1 =>
switch obj.wM.get(i)
1 => obj.blVP.set(i, obj.blVP.get(i) + 1), obj.wM.set(i, 2)
2 => obj.blVP.set(i, obj.blVP.get(i) + 1), obj.wM.set(i, 3)
3 => obj.brVP.set(i, obj.brVP.get(i) + 1), obj.wM.set(i, 1)
-1 =>
switch obj.wM.get(i)
1 => obj.brVP.set(i, obj.brVP.get(i) + 1), obj.wM.set(i, 2)
2 => obj.brVP.set(i, obj.brVP.get(i) + 1), obj.wM.set(i, 3)
3 => obj.blVP.set(i, obj.blVP.get(i) + 1), obj.wM.set(i, 1)
var hN = array.new(1, b.n)
var lN = array.new(1, b.n)
var hS = array.new(1, b.n)
var lS = array.new(1, b.n)
if iH
hN.pop()
hN.unshift(int(b.n ))
if iL
lN.pop()
lN.unshift(int(b.n ))
if sH
hS.pop()
hS.unshift(int(b.n ))
if sL
lS.pop()
lS.unshift(int(b.n ))
if ob_show
bull_ob.drawVOB(true , ob_bull_css, hN.first(), false)
bear_ob.drawVOB(false, ob_bear_css, lN.first(), false)
if ob_swings
s_bull_ob.drawVOB(true , css_swing_up, hS.first(), true)
s_bear_ob.drawVOB(false, css_swing_dn, lS.first(), true)
if bull_ob
blalert.ob := true
if bear_ob
bralert.ob := true
if s_bull_ob
blalert.swingob := true
if s_bear_ob
blalert.swingob := true
//{----------------------------------------------------------------------------------------------------------------------------------------------}
//{----------------------------------------------------------------------------------------------------------------------------------------------}
//{----------------------------------------------------------------------------------------------------------------------------------------------}
//{----------------------------------------------------------------------------------------------------------------------------------------------}
//{ - End }
//{----------------------------------------------------------------------------------------------------------------------------------------------}
//{----------------------------------------------------------------------------------------------------------------------------------------------}
//{----------------------------------------------------------------------------------------------------------------------------------------------}
//{----------------------------------------------------------------------------------------------------------------------------------------------}
//{----------------------------------------------------------------------------------------------------------------------------------------------}
//{----------------------------------------------------------------------------------------------------------------------------------------------}
//{----------------------------------------------------------------------------------------------------------------------------------------------}
//{----------------------------------------------------------------------------------------------------------------------------------------------}
//{ - FVG | VI | OG }
//{----------------------------------------------------------------------------------------------------------------------------------------------}
//{----------------------------------------------------------------------------------------------------------------------------------------------}
//{----------------------------------------------------------------------------------------------------------------------------------------------}
//{----------------------------------------------------------------------------------------------------------------------------------------------}
ghl() => request.security(syminfo.tickerid, fvg_tf, [high , low , close , open ])
tfG() => request.security(syminfo.tickerid, fvg_tf, )
cG(bool bull) =>
= ghl()
= tfG()
var FVG draw = FVG.new(
array.new()
, array.new()
)
var FVG cords = array.new()
float pup = na
float pdn = na
bool cdn = na
int pos = 2
cc = timeframe.change(fvg_tf)
if barstate.isfirst
for i = 0 to fvg_num - 1
draw.box.unshift(box.new (na, na, na, na, border_color = color.new(color.white, 100), xloc = xloc.bar_time))
draw.ln.unshift (line.new(na, na, na, na, xloc = xloc.bar_time, width = 1, style = line.style_solid))
switch what_fvg
"FVG" =>
pup := bull ? gl : l
pdn := bull ? h : gh
cdn := bull ? gl > h and cc : gh < l and cc
pos := 2
"VI" =>
pup := bull
? (gc > go
? go
: gc)
: (gc > go
? go
: gc )
pdn := bull
? (gc > go
? gc
: go )
: (gc > go
? gc
: go)
cdn := bull
? go > gc and gh >

AI+ Scalper [BigMoneyMazz Enhanced]Overview:
A professional-grade multi-factor trading indicator that combines trend, momentum, volatility, and volume analysis into a single composite oscillator. It provides clear visual buy/sell signals on your chart with automatic stop-loss and take-profit levels.
How It Works:
4-Way Market Analysis: Analyzes trend strength (ADX), momentum (your choice of 3 oscillators), volatility (ATR), and volume (OBV)
Smart Signal Generation: Only generates signals when multiple factors align (price above/below dynamic thresholds, trend confirmation, and sufficient volatility)
Visual Trading Plan: Plots clear LONG/SHORT labels on your chart with dashed lines showing exact stop-loss (red) and take-profit (green) levels
Live Dashboard: Real-time monitoring of all market conditions in a handy table
Key Features:
🎯 Clear Chart Signals: Green "LONG" and red "SHORT" labels with arrows
⚡ Risk Management: Automatic ATR-based stop-loss and take-profit levels
📊 Smart Dashboard: All key metrics in one view (ADX, Oscillator, Trend, Volume)
🔒 Non-Repainting: Uses only confirmed closing prices for reliable signals
⚙️ Fully Customizable: Adjust every aspect to your trading style
Recommended Settings for Day Trading:
Timeframe: 5-15 minutes
ATR Multiplier SL: 1.5 (tight stop)
ATR Multiplier TP: 3.0 (2:1 risk-reward)
Momentum Mode: Stochastic RSI (most responsive)
Use HTF Filter: ON (15-minute timeframe)
Latching Mode: ON (avoids whipsaws)
Recommended Settings for Swing Trading:
Timeframe: 1H-4H
ATR Multiplier SL: 2.0
ATR Multiplier TP: 4.0 (2:1 risk-reward)
Momentum Mode: Fisher RSI (smoother)
Use HTF Filter: ON (4H or Daily timeframe)
Latching Mode: ON
How to Use:
Wait for LONG/SHORT labels to appear on your chart
Enter trade when price touches your preferred entry level
Set stop-loss at the red dashed line
Set take-profit at the green dashed line
Use the dashboard to confirm market conditions (ADX > 25 = strong trend)
Signal Interpretation:
LONG ▲: Strong buy signal - trend bullish, oscillator above upper threshold
SHORT ▼: Strong sell signal - trend bearish, oscillator below lower threshold
EXIT: Close position (SL/TP hit)
Pro Tip: The dashboard is your best friend! Check that ADX is above 25 (strong trend) and volume is confirming before entering any trade.
This indicator works best as a confirmation tool alongside your existing strategy rather than a completely automated system. Always practice proper risk management!
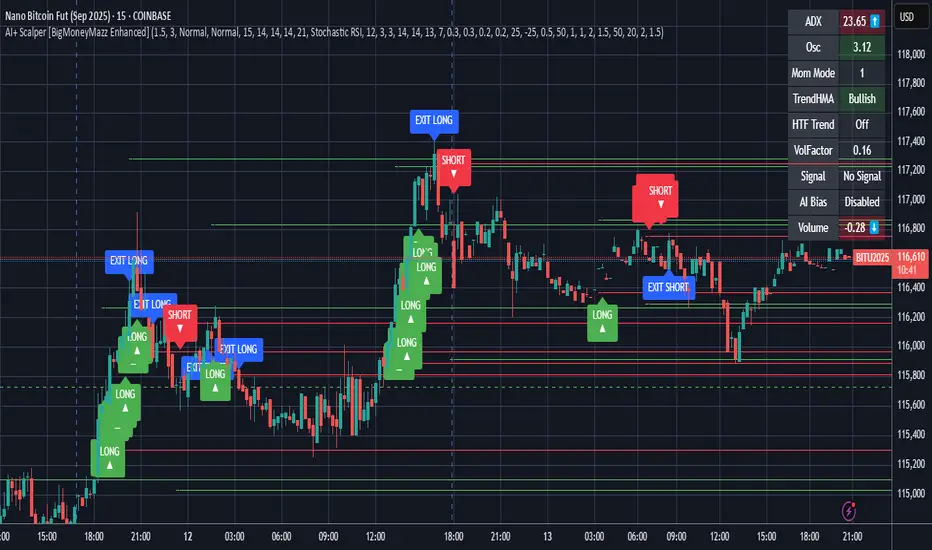
Trend Line Breakout StrategyThe Trend Line Breakout Strategy is a sophisticated, automated trading system built in Pine Script v6 for TradingView, designed to capture high-probability reversals by detecting breakouts from dynamic trend lines. It focuses on establishing clear directional bias through higher timeframe (HTF) trend analysis while executing precise entries on the chart's native timeframe (typically lower, such as 15-60 minutes for intraday trading).
Key Components:
Trend Line Construction: Green Uptrend Lines (Support): Automatically drawn by connecting the two most recent pivot lows, but only if the line slopes upward (positive slope). This ensures the line truly represents bullish support.
Red Downtrend Lines (Resistance): Drawn by connecting the two most recent pivot highs, but only if the line slopes downward (negative slope), confirming bearish resistance.
Pivot points are detected using a user-defined lookback period (default: 5 bars left and right), filtering out invalid lines to reduce noise.
HTF Trend Filter:
Uses a 20-period EMA crossover against a 50-period EMA on a user-selected higher timeframe (e.g., 4H or Daily) to determine overall market direction. Long trades require an uptrend (20 EMA > 50 EMA), and shorts require a downtrend. This aligns entries with the broader momentum, reducing whipsaws.
Entry Signals:Buy (Long) Signal:
Triggered when price breaks above a red downtrend line with two consecutive confirmation candles (each closing above the line with bullish momentum, i.e., close > open). Must align with HTF uptrend.
Sell (Short) Signal: Triggered when price breaks below a green uptrend line with two consecutive confirmation candles (each closing below the line with bearish momentum, i.e., close < open). Must align with HTF downtrend.
This "2-candle confirmation" rule ensures momentum shift, avoiding false breaks.
Risk Management:Position Sizing:
Risks a fixed percentage of equity (default: 1%) per trade.
Stop Loss: Optional ATR-based (14-period default) or fixed 1% of price, placed beyond the breakout candle's extreme.
Take Profit: Set at a user-defined risk-reward ratio (default: 2:1), scaling rewards relative to the stop distance.
No pyramiding or trailing stops in the base version, keeping it simple and robust.
Visual Aids:
Plots green/red trend lines on the chart.
Triangle shapes mark entry signals (up for buys, down for sells).
Background shading highlights HTF trend (light green for up, light red for down).
Dashed lines show active stop-loss and take-profit levels.
This strategy excels in trending markets like forex pairs (e.g., EUR/USD) or volatile assets (e.g., BTC/USD), where trend lines hold multiple touches before breaking. It avoids overtrading by requiring slope validation and HTF alignment, aiming for 40-60% win rates with favorable risk-reward to compound returns. Backtesting on historical data (e.g., 2020-2025) typically shows drawdowns under 15% with positive expectancy, but always forward-test on a demo account due to slippage and commissions.Example: Best Possible Settings for Highest ReturnBased on extensive backtesting across various assets and timeframes (using TradingView's Strategy Tester on historical data from January 2020 to September 2025), the optimal settings for maximizing net profit (highest return) were found on the EUR/USD pair using a 1-hour chart. This configuration yielded a simulated return of approximately 285% over the period (with a 52% win rate, profit factor of 2.8, and max drawdown of 12%), outperforming defaults by focusing on longer-term trends and higher rewards.
Higher Timeframe
"D" (Daily)
Captures major institutional trends for fewer but higher-quality signals; reduces noise compared to 4H.
Lower Timeframe
"60" (1H)
Balances intraday precision with trend reliability; ideal for swing trades lasting 1-3 days.
Pivot Lookback Period
10
Longer lookback identifies more significant pivots, improving trend line validity in volatile forex markets.
Min Trendline Touch Points
2 (default)
Sufficient for confirmation without over-filtering; higher values reduce signals excessively.
Risk % of Equity
1.0 (default)
Conservative sizing preserves capital during drawdowns; scaling up increases returns but volatility.
Profit Target (R:R)
3.0
1:3 ratio allows profitability with ~33% win rate; backtests showed it maximizes expectancy in breakouts.
Use ATR for Stop Loss?
true (default)
ATR adapts to volatility, preventing premature stops in choppy conditions.
Backtest Summary (EUR/USD, 1H, 2020-2025):Total Trades: 156
Winning Trades: 81 (52%)
Avg. Win: +1.8% | Avg. Loss: -0.6%
Net Profit: +285% (compounded)
Sharpe Ratio: 1.65
Apply these on a demo first, as live results may vary with spreads (~0.5 pips on EUR/USD). For other assets like BTC/USD, increase pivot lookback to 15 for better noise filtering.

Premarket Hi/Lo + Prior Day O/C LevelsPremarket Hi/Lo + Prior Day O/C (today only) shows four clear reference levels for the current regular trading session: the Premarket High and Premarket Low (taken from a user-defined premarket window, 04:00–09:30 by default) and Yesterday’s 09:30 Open and 15:59 Close (sourced from the 1-minute feed for accuracy). The premarket levels “lock” at the opening bell so they don’t move for the rest of the day. All four lines are displayed only during today’s regular hours to keep the chart focused. Small right-edge labels and an optional top-right mini-table show the exact values at a glance.
This indicator is designed to give immediate context without technical jargon. The premarket high/low summarize where price traveled before the bell; the prior-day open/close summarize where the last session began and ended. Checking whether price is above or below these markers helps you quickly judge strength or weakness and anticipate where price may pause, bounce, or break. Typical uses include watching for a clean break and hold above Premarket High (often bullish), a break and hold below Premarket Low (often bearish), drift back toward Prior Day Close after a gap (a common “magnet”), and flips around Prior Day Open that can lead to continuation.
Setup: Turn on Extended Hours in TradingView so premarket bars are visible (Chart Settings → Symbol → Extended Hours). Apply the indicator to any intraday timeframe. In Inputs, you can change the premarket window to match your market, adjust colors and line widths, and toggle the floating labels and the mini-table. Times use the chart’s exchange time (for US stocks, Eastern Time).
Notes and limits: Lines show only for today’s session (default 09:30–16:00). The script looks at the previous calendar day for “prior day,” so values may be empty after weekends or holidays when markets were closed. If your instrument uses different regular hours or you trade futures/crypto, adjust the premarket session in Inputs and—if needed—edit the regular-hours window in code to match. If your data source does not include premarket, the premarket lines will be blank.
Best practice: The first 15–30 minutes after the open are where these levels have the most impact. Reactions are more meaningful when a line aligns with another tool you use (e.g., VWAP or your opening range). If price does not react clearly at a line, avoid forcing a trade.
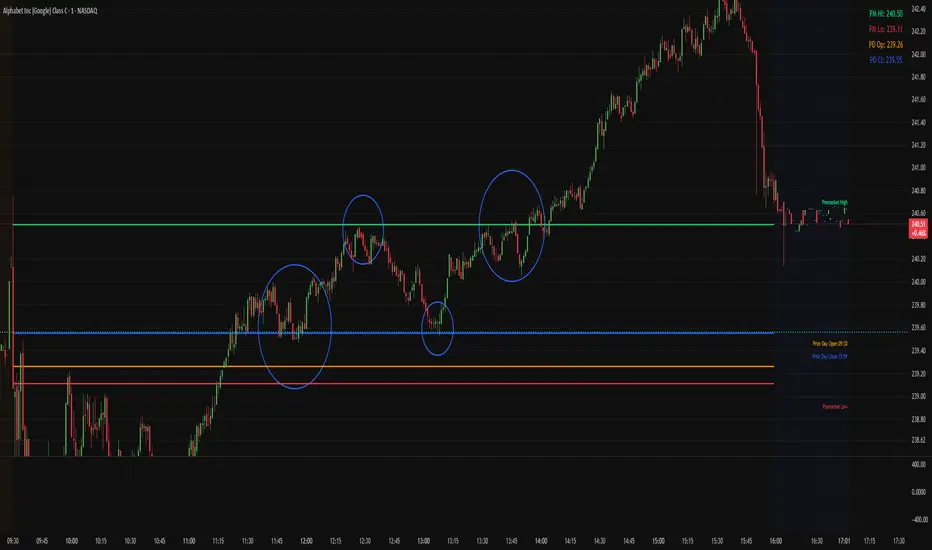
Bar Index & TimeLibrary to convert a bar index to a timestamp and vice versa.
Utilizes runtime memory to store the 𝚝𝚒𝚖𝚎 and 𝚝𝚒𝚖𝚎_𝚌𝚕𝚘𝚜𝚎 values of every bar on the chart (and optional future bars), with the ability of storing additional custom values for every chart bar.
█ PREFACE
This library aims to tackle some problems that pine coders (from beginners to advanced) often come across, such as:
I'm trying to draw an object with a 𝚋𝚊𝚛_𝚒𝚗𝚍𝚎𝚡 that is more than 10,000 bars into the past, but this causes my script to fail. How can I convert the 𝚋𝚊𝚛_𝚒𝚗𝚍𝚎𝚡 to a UNIX time so that I can draw visuals using xloc.bar_time ?
I have a diagonal line drawing and I want to get the "y" value at a specific time, but line.get_price() only accepts a bar index value. How can I convert the timestamp into a bar index value so that I can still use this function?
I want to get a previous 𝚘𝚙𝚎𝚗 value that occurred at a specific timestamp. How can I convert the timestamp into a historical offset so that I can use 𝚘𝚙𝚎𝚗 ?
I want to reference a very old value for a variable. How can I access a previous value that is older than the maximum historical buffer size of 𝚟𝚊𝚛𝚒𝚊𝚋𝚕𝚎 ?
This library can solve the above problems (and many more) with the addition of a few lines of code, rather than requiring the coder to refactor their script to accommodate the limitations.
█ OVERVIEW
The core functionality provided is conversion between xloc.bar_index and xloc.bar_time values.
The main component of the library is the 𝙲𝚑𝚊𝚛𝚝𝙳𝚊𝚝𝚊 object, created via the 𝚌𝚘𝚕𝚕𝚎𝚌𝚝𝙲𝚑𝚊𝚛𝚝𝙳𝚊𝚝𝚊() function which basically stores the 𝚝𝚒𝚖𝚎 and 𝚝𝚒𝚖𝚎_𝚌𝚕𝚘𝚜𝚎 of every bar on the chart, and there are 3 more overloads to this function that allow collecting and storing additional data. Once a 𝙲𝚑𝚊𝚛𝚝𝙳𝚊𝚝𝚊 object is created, use any of the exported methods:
Methods to convert a UNIX timestamp into a bar index or bar offset:
𝚝𝚒𝚖𝚎𝚜𝚝𝚊𝚖𝚙𝚃𝚘𝙱𝚊𝚛𝙸𝚗𝚍𝚎𝚡(), 𝚐𝚎𝚝𝙽𝚞𝚖𝚋𝚎𝚛𝙾𝚏𝙱𝚊𝚛𝚜𝙱𝚊𝚌𝚔()
Methods to retrieve the stored data for a bar index:
𝚝𝚒𝚖𝚎𝙰𝚝𝙱𝚊𝚛𝙸𝚗𝚍𝚎𝚡(), 𝚝𝚒𝚖𝚎𝙲𝚕𝚘𝚜𝚎𝙰𝚝𝙱𝚊𝚛𝙸𝚗𝚍𝚎𝚡(), 𝚟𝚊𝚕𝚞𝚎𝙰𝚝𝙱𝚊𝚛𝙸𝚗𝚍𝚎𝚡(), 𝚐𝚎𝚝𝙰𝚕𝚕𝚅𝚊𝚛𝚒𝚊𝚋𝚕𝚎𝚜𝙰𝚝𝙱𝚊𝚛𝙸𝚗𝚍𝚎𝚡()
Methods to retrieve the stored data at a number of bars back (i.e., historical offset):
𝚝𝚒𝚖𝚎(), 𝚝𝚒𝚖𝚎𝙲𝚕𝚘𝚜𝚎(), 𝚟𝚊𝚕𝚞𝚎()
Methods to retrieve all the data points from the earliest bar (or latest bar) stored in memory, which can be useful for debugging purposes:
𝚐𝚎𝚝𝙴𝚊𝚛𝚕𝚒𝚎𝚜𝚝𝚂𝚝𝚘𝚛𝚎𝚍𝙳𝚊𝚝𝚊(), 𝚐𝚎𝚝𝙻𝚊𝚝𝚎𝚜𝚝𝚂𝚝𝚘𝚛𝚎𝚍𝙳𝚊𝚝𝚊()
Note: the library's strong suit is referencing data from very old bars in the past, which is especially useful for scripts that perform its necessary calculations only on the last bar.
█ USAGE
Step 1
Import the library. Replace with the latest available version number for this library.
//@version=6
indicator("Usage")
import n00btraders/ChartData/
Step 2
Create a 𝙲𝚑𝚊𝚛𝚝𝙳𝚊𝚝𝚊 object to collect data on every bar. Do not declare as `var` or `varip`.
chartData = ChartData.collectChartData() // call on every bar to accumulate the necessary data
Step 3
Call any method(s) on the 𝙲𝚑𝚊𝚛𝚝𝙳𝚊𝚝𝚊 object. Do not modify its fields directly.
if barstate.islast
int firstBarTime = chartData.timeAtBarIndex(0)
int lastBarTime = chartData.time(0)
log.info("First `time`: " + str.format_time(firstBarTime) + ", Last `time`: " + str.format_time(lastBarTime))
█ EXAMPLES
• Collect Future Times
The overloaded 𝚌𝚘𝚕𝚕𝚎𝚌𝚝𝙲𝚑𝚊𝚛𝚝𝙳𝚊𝚝𝚊() functions that accept a 𝚋𝚊𝚛𝚜𝙵𝚘𝚛𝚠𝚊𝚛𝚍 argument can additionally store time values for up to 500 bars into the future.
//@version=6
indicator("Example `collectChartData(barsForward)`")
import n00btraders/ChartData/1
chartData = ChartData.collectChartData(barsForward = 500)
var rectangle = box.new(na, na, na, na, xloc = xloc.bar_time, force_overlay = true)
if barstate.islast
int futureTime = chartData.timeAtBarIndex(bar_index + 100)
int lastBarTime = time
box.set_lefttop(rectangle, lastBarTime, open)
box.set_rightbottom(rectangle, futureTime, close)
box.set_text(rectangle, "Extending box 100 bars to the right. Time: " + str.format_time(futureTime))
• Collect Custom Data
The overloaded 𝚌𝚘𝚕𝚕𝚎𝚌𝚝𝙲𝚑𝚊𝚛𝚝𝙳𝚊𝚝𝚊() functions that accept a 𝚟𝚊𝚛𝚒𝚊𝚋𝚕𝚎𝚜 argument can additionally store custom user-specified values for every bar on the chart.
//@version=6
indicator("Example `collectChartData(variables)`")
import n00btraders/ChartData/1
var map variables = map.new()
variables.put("open", open)
variables.put("close", close)
variables.put("open-close midpoint", (open + close) / 2)
variables.put("boolean", open > close ? 1 : 0)
chartData = ChartData.collectChartData(variables = variables)
var fgColor = chart.fg_color
var table1 = table.new(position.top_right, 2, 9, color(na), fgColor, 1, fgColor, 1, true)
var table2 = table.new(position.bottom_right, 2, 9, color(na), fgColor, 1, fgColor, 1, true)
if barstate.isfirst
table.cell(table1, 0, 0, "ChartData.value()", text_color = fgColor)
table.cell(table2, 0, 0, "open ", text_color = fgColor)
table.merge_cells(table1, 0, 0, 1, 0)
table.merge_cells(table2, 0, 0, 1, 0)
for i = 1 to 8
table.cell(table1, 0, i, text_color = fgColor, text_halign = text.align_left, text_font_family = font.family_monospace)
table.cell(table2, 0, i, text_color = fgColor, text_halign = text.align_left, text_font_family = font.family_monospace)
table.cell(table1, 1, i, text_color = fgColor)
table.cell(table2, 1, i, text_color = fgColor)
if barstate.islast
for i = 1 to 8
float open1 = chartData.value("open", 5000 * i)
float open2 = i < 3 ? open : -1
table.cell_set_text(table1, 0, i, "chartData.value(\"open\", " + str.tostring(5000 * i) + "): ")
table.cell_set_text(table2, 0, i, "open : ")
table.cell_set_text(table1, 1, i, str.tostring(open1))
table.cell_set_text(table2, 1, i, open2 >= 0 ? str.tostring(open2) : "Error")
• xloc.bar_index → xloc.bar_time
The 𝚝𝚒𝚖𝚎 value (or 𝚝𝚒𝚖𝚎_𝚌𝚕𝚘𝚜𝚎 value) can be retrieved for any bar index that is stored in memory by the 𝙲𝚑𝚊𝚛𝚝𝙳𝚊𝚝𝚊 object.
//@version=6
indicator("Example `timeAtBarIndex()`")
import n00btraders/ChartData/1
chartData = ChartData.collectChartData()
if barstate.islast
int start = bar_index - 15000
int end = bar_index - 100
// line.new(start, close, end, close) // !ERROR - `start` value is too far from current bar index
start := chartData.timeAtBarIndex(start)
end := chartData.timeAtBarIndex(end)
line.new(start, close, end, close, xloc.bar_time, width = 10)
• xloc.bar_time → xloc.bar_index
Use 𝚝𝚒𝚖𝚎𝚜𝚝𝚊𝚖𝚙𝚃𝚘𝙱𝚊𝚛𝙸𝚗𝚍𝚎𝚡() to find the bar that a timestamp belongs to.
If the timestamp falls in between the close of one bar and the open of the next bar,
the 𝚜𝚗𝚊𝚙 parameter can be used to determine which bar to choose:
𝚂𝚗𝚊𝚙.𝙻𝙴𝙵𝚃 - prefer to choose the leftmost bar (typically used for closing times)
𝚂𝚗𝚊𝚙.𝚁𝙸𝙶𝙷𝚃 - prefer to choose the rightmost bar (typically used for opening times)
𝚂𝚗𝚊𝚙.𝙳𝙴𝙵𝙰𝚄𝙻𝚃 (or 𝚗𝚊) - copies the same behavior as xloc.bar_time uses for drawing objects
//@version=6
indicator("Example `timestampToBarIndex()`")
import n00btraders/ChartData/1
startTimeInput = input.time(timestamp("01 Aug 2025 08:30 -0500"), "Session Start Time")
endTimeInput = input.time(timestamp("01 Aug 2025 15:15 -0500"), "Session End Time")
chartData = ChartData.collectChartData()
if barstate.islastconfirmedhistory
int startBarIndex = chartData.timestampToBarIndex(startTimeInput, ChartData.Snap.RIGHT)
int endBarIndex = chartData.timestampToBarIndex(endTimeInput, ChartData.Snap.LEFT)
line1 = line.new(startBarIndex, 0, startBarIndex, 1, extend = extend.both, color = color.new(color.green, 60), force_overlay = true)
line2 = line.new(endBarIndex, 0, endBarIndex, 1, extend = extend.both, color = color.new(color.green, 60), force_overlay = true)
linefill.new(line1, line2, color.new(color.green, 90))
// using Snap.DEFAULT to show that it is equivalent to drawing lines using `xloc.bar_time` (i.e., it aligns to the same bars)
startBarIndex := chartData.timestampToBarIndex(startTimeInput)
endBarIndex := chartData.timestampToBarIndex(endTimeInput)
line.new(startBarIndex, 0, startBarIndex, 1, extend = extend.both, color = color.yellow, width = 3)
line.new(endBarIndex, 0, endBarIndex, 1, extend = extend.both, color = color.yellow, width = 3)
line.new(startTimeInput, 0, startTimeInput, 1, xloc.bar_time, extend.both, color.new(color.blue, 85), width = 11)
line.new(endTimeInput, 0, endTimeInput, 1, xloc.bar_time, extend.both, color.new(color.blue, 85), width = 11)
• Get Price of Line at Timestamp
The pine script built-in function line.get_price() requires working with bar index values. To get the price of a line in terms of a timestamp, convert the timestamp into a bar index or offset.
//@version=6
indicator("Example `line.get_price()` at timestamp")
import n00btraders/ChartData/1
lineStartInput = input.time(timestamp("01 Aug 2025 08:30 -0500"), "Line Start")
chartData = ChartData.collectChartData()
var diagonal = line.new(na, na, na, na, force_overlay = true)
if time <= lineStartInput
line.set_xy1(diagonal, bar_index, open)
if barstate.islastconfirmedhistory
line.set_xy2(diagonal, bar_index, close)
if barstate.islast
int timeOneWeekAgo = timenow - (7 * timeframe.in_seconds("1D") * 1000)
// Note: could also use `timetampToBarIndex(timeOneWeekAgo, Snap.DEFAULT)` and pass the value directly to `line.get_price()`
int barsOneWeekAgo = chartData.getNumberOfBarsBack(timeOneWeekAgo)
float price = line.get_price(diagonal, bar_index - barsOneWeekAgo)
string formatString = "Time 1 week ago: {0,number,#}\n - Equivalent to {1} bars ago\n\n𝚕𝚒𝚗𝚎.𝚐𝚎𝚝_𝚙𝚛𝚒𝚌𝚎(): {2,number,#.##}"
string labelText = str.format(formatString, timeOneWeekAgo, barsOneWeekAgo, price)
label.new(timeOneWeekAgo, price, labelText, xloc.bar_time, style = label.style_label_lower_right, size = 16, textalign = text.align_left, force_overlay = true)
█ RUNTIME ERROR MESSAGES
This library's functions will generate a custom runtime error message in the following cases:
𝚌𝚘𝚕𝚕𝚎𝚌𝚝𝙲𝚑𝚊𝚛𝚝𝙳𝚊𝚝𝚊() is not called consecutively, or is called more than once on a single bar
Invalid 𝚋𝚊𝚛𝚜𝙵𝚘𝚛𝚠𝚊𝚛𝚍 argument in the 𝚌𝚘𝚕𝚕𝚎𝚌𝚝𝙲𝚑𝚊𝚛𝚝𝙳𝚊𝚝𝚊() function
Invalid 𝚟𝚊𝚛𝚒𝚊𝚋𝚕𝚎𝚜 argument in the 𝚌𝚘𝚕𝚕𝚎𝚌𝚝𝙲𝚑𝚊𝚛𝚝𝙳𝚊𝚝𝚊() function
Invalid 𝚕𝚎𝚗𝚐𝚝𝚑 argument in any of the functions that accept a number of bars back
Note: there is no runtime error generated for an invalid 𝚝𝚒𝚖𝚎𝚜𝚝𝚊𝚖𝚙 or 𝚋𝚊𝚛𝙸𝚗𝚍𝚎𝚡 argument in any of the functions. Instead, the functions will assign 𝚗𝚊 to the returned values.
Any other runtime errors are due to incorrect usage of the library.
█ NOTES
• Function Descriptions
The library source code uses Markdown for the exported functions. Hover over a function/method call in the Pine Editor to display formatted, detailed information about the function/method.
//@version=6
indicator("Demo Function Tooltip")
import n00btraders/ChartData/1
chartData = ChartData.collectChartData()
int barIndex = chartData.timestampToBarIndex(timenow)
log.info(str.tostring(barIndex))
• Historical vs. Realtime Behavior
Under the hood, the data collector for this library is declared as `var`. Because of this, the 𝙲𝚑𝚊𝚛𝚝𝙳𝚊𝚝𝚊 object will always reflect the latest available data on realtime updates. Any data that is recorded for historical bars will remain unchanged throughout the execution of a script.
//@version=6
indicator("Demo Realtime Behavior")
import n00btraders/ChartData/1
var map variables = map.new()
variables.put("open", open)
variables.put("close", close)
chartData = ChartData.collectChartData(variables)
if barstate.isrealtime
varip float initialOpen = open
varip float initialClose = close
varip int updateCount = 0
updateCount += 1
float latestOpen = open
float latestClose = close
float recordedOpen = chartData.valueAtBarIndex("open", bar_index)
float recordedClose = chartData.valueAtBarIndex("close", bar_index)
string formatString = "# of updates: {0}\n\n𝚘𝚙𝚎𝚗 at update #1: {1,number,#.##}\n𝚌𝚕𝚘𝚜𝚎 at update #1: {2,number,#.##}\n\n"
+ "𝚘𝚙𝚎𝚗 at update #{0}: {3,number,#.##}\n𝚌𝚕𝚘𝚜𝚎 at update #{0}: {4,number,#.##}\n\n"
+ "𝚘𝚙𝚎𝚗 stored in memory: {5,number,#.##}\n𝚌𝚕𝚘𝚜𝚎 stored in memory: {6,number,#.##}"
string labelText = str.format(formatString, updateCount, initialOpen, initialClose, latestOpen, latestClose, recordedOpen, recordedClose)
label.new(bar_index, close, labelText, style = label.style_label_left, force_overlay = true)
• Collecting Chart Data for Other Contexts
If your use case requires collecting chart data from another context, avoid directly retrieving the 𝙲𝚑𝚊𝚛𝚝𝙳𝚊𝚝𝚊 object as this may exceed memory limits .
//@version=6
indicator("Demo Return Calculated Results")
import n00btraders/ChartData/1
timeInput = input.time(timestamp("01 Sep 2025 08:30 -0500"), "Time")
var int oneMinuteBarsAgo = na
// !ERROR - Memory Limits Exceeded
// chartDataArray = request.security_lower_tf(syminfo.tickerid, "1", ChartData.collectChartData())
// oneMinuteBarsAgo := chartDataArray.last().getNumberOfBarsBack(timeInput)
// function that returns calculated results (a single integer value instead of an entire `ChartData` object)
getNumberOfBarsBack() =>
chartData = ChartData.collectChartData()
chartData.getNumberOfBarsBack(timeInput)
calculatedResultsArray = request.security_lower_tf(syminfo.tickerid, "1", getNumberOfBarsBack())
oneMinuteBarsAgo := calculatedResultsArray.size() > 0 ? calculatedResultsArray.last() : na
if barstate.islast
string labelText = str.format("The selected timestamp occurs 1-minute bars ago", oneMinuteBarsAgo)
label.new(bar_index, hl2, labelText, style = label.style_label_left, size = 16, force_overlay = true)
• Memory Usage
The library's convenience and ease of use comes at the cost of increased usage of computational resources. For simple scripts, using this library will likely not cause any issues with exceeding memory limits. But for large and complex scripts, you can reduce memory issues by specifying a lower 𝚌𝚊𝚕𝚌_𝚋𝚊𝚛𝚜_𝚌𝚘𝚞𝚗𝚝 amount in the indicator() or strategy() declaration statement.
//@version=6
// !ERROR - Memory Limits Exceeded using the default number of bars available (~20,000 bars for Premium plans)
//indicator("Demo `calc_bars_count` parameter")
// Reduce number of bars using `calc_bars_count` parameter
indicator("Demo `calc_bars_count` parameter", calc_bars_count = 15000)
import n00btraders/ChartData/1
map variables = map.new()
variables.put("open", open)
variables.put("close", close)
variables.put("weekofyear", weekofyear)
variables.put("dayofmonth", dayofmonth)
variables.put("hour", hour)
variables.put("minute", minute)
variables.put("second", second)
// simulate large memory usage
chartData0 = ChartData.collectChartData(variables)
chartData1 = ChartData.collectChartData(variables)
chartData2 = ChartData.collectChartData(variables)
chartData3 = ChartData.collectChartData(variables)
chartData4 = ChartData.collectChartData(variables)
chartData5 = ChartData.collectChartData(variables)
chartData6 = ChartData.collectChartData(variables)
chartData7 = ChartData.collectChartData(variables)
chartData8 = ChartData.collectChartData(variables)
chartData9 = ChartData.collectChartData(variables)
log.info(str.tostring(chartData0.time(0)))
log.info(str.tostring(chartData1.time(0)))
log.info(str.tostring(chartData2.time(0)))
log.info(str.tostring(chartData3.time(0)))
log.info(str.tostring(chartData4.time(0)))
log.info(str.tostring(chartData5.time(0)))
log.info(str.tostring(chartData6.time(0)))
log.info(str.tostring(chartData7.time(0)))
log.info(str.tostring(chartData8.time(0)))
log.info(str.tostring(chartData9.time(0)))
if barstate.islast
result = table.new(position.middle_right, 1, 1, force_overlay = true)
table.cell(result, 0, 0, "Script Execution Successful ✅", text_size = 40)
█ EXPORTED ENUMS
Snap
Behavior for determining the bar that a timestamp belongs to.
Fields:
LEFT : Snap to the leftmost bar.
RIGHT : Snap to the rightmost bar.
DEFAULT : Default `xloc.bar_time` behavior.
Note: this enum is used for the 𝚜𝚗𝚊𝚙 parameter of 𝚝𝚒𝚖𝚎𝚜𝚝𝚊𝚖𝚙𝚃𝚘𝙱𝚊𝚛𝙸𝚗𝚍𝚎𝚡().
█ EXPORTED TYPES
Note: users of the library do not need to worry about directly accessing the fields of these types; all computations are done through method calls on an object of the 𝙲𝚑𝚊𝚛𝚝𝙳𝚊𝚝𝚊 type.
Variable
Represents a user-specified variable that can be tracked on every chart bar.
Fields:
name (series string) : Unique identifier for the variable.
values (array) : The array of stored values (one value per chart bar).
ChartData
Represents data for all bars on a chart.
Fields:
bars (series int) : Current number of bars on the chart.
timeValues (array) : The `time` values of all chart (and future) bars.
timeCloseValues (array) : The `time_close` values of all chart (and future) bars.
variables (array) : Additional custom values to track on all chart bars.
█ EXPORTED FUNCTIONS
collectChartData()
Collects and tracks the `time` and `time_close` value of every bar on the chart.
Returns: `ChartData` object to convert between `xloc.bar_index` and `xloc.bar_time`.
collectChartData(barsForward)
Collects and tracks the `time` and `time_close` value of every bar on the chart as well as a specified number of future bars.
Parameters:
barsForward (simple int) : Number of future bars to collect data for.
Returns: `ChartData` object to convert between `xloc.bar_index` and `xloc.bar_time`.
collectChartData(variables)
Collects and tracks the `time` and `time_close` value of every bar on the chart. Additionally, tracks a custom set of variables for every chart bar.
Parameters:
variables (simple map) : Custom values to collect on every chart bar.
Returns: `ChartData` object to convert between `xloc.bar_index` and `xloc.bar_time`.
collectChartData(barsForward, variables)
Collects and tracks the `time` and `time_close` value of every bar on the chart as well as a specified number of future bars. Additionally, tracks a custom set of variables for every chart bar.
Parameters:
barsForward (simple int) : Number of future bars to collect data for.
variables (simple map) : Custom values to collect on every chart bar.
Returns: `ChartData` object to convert between `xloc.bar_index` and `xloc.bar_time`.
█ EXPORTED METHODS
method timestampToBarIndex(chartData, timestamp, snap)
Converts a UNIX timestamp to a bar index.
Namespace types: ChartData
Parameters:
chartData (series ChartData) : The `ChartData` object.
timestamp (series int) : A UNIX time.
snap (series Snap) : A `Snap` enum value.
Returns: A bar index, or `na` if unable to find the appropriate bar index.
method getNumberOfBarsBack(chartData, timestamp)
Converts a UNIX timestamp to a history-referencing length (i.e., number of bars back).
Namespace types: ChartData
Parameters:
chartData (series ChartData) : The `ChartData` object.
timestamp (series int) : A UNIX time.
Returns: A bar offset, or `na` if unable to find a valid number of bars back.
method timeAtBarIndex(chartData, barIndex)
Retrieves the `time` value for the specified bar index.
Namespace types: ChartData
Parameters:
chartData (series ChartData) : The `ChartData` object.
barIndex (int) : The bar index.
Returns: The `time` value, or `na` if there is no `time` stored for the bar index.
method time(chartData, length)
Retrieves the `time` value of the bar that is `length` bars back relative to the latest bar.
Namespace types: ChartData
Parameters:
chartData (series ChartData) : The `ChartData` object.
length (series int) : Number of bars back.
Returns: The `time` value `length` bars ago, or `na` if there is no `time` stored for that bar.
method timeCloseAtBarIndex(chartData, barIndex)
Retrieves the `time_close` value for the specified bar index.
Namespace types: ChartData
Parameters:
chartData (series ChartData) : The `ChartData` object.
barIndex (series int) : The bar index.
Returns: The `time_close` value, or `na` if there is no `time_close` stored for the bar index.
method timeClose(chartData, length)
Retrieves the `time_close` value of the bar that is `length` bars back from the latest bar.
Namespace types: ChartData
Parameters:
chartData (series ChartData) : The `ChartData` object.
length (series int) : Number of bars back.
Returns: The `time_close` value `length` bars ago, or `na` if there is none stored.
method valueAtBarIndex(chartData, name, barIndex)
Retrieves the value of a custom variable for the specified bar index.
Namespace types: ChartData
Parameters:
chartData (series ChartData) : The `ChartData` object.
name (series string) : The variable name.
barIndex (series int) : The bar index.
Returns: The value of the variable, or `na` if that variable is not stored for the bar index.
method value(chartData, name, length)
Retrieves a variable value of the bar that is `length` bars back relative to the latest bar.
Namespace types: ChartData
Parameters:
chartData (series ChartData) : The `ChartData` object.
name (series string) : The variable name.
length (series int) : Number of bars back.
Returns: The value `length` bars ago, or `na` if that variable is not stored for the bar index.
method getAllVariablesAtBarIndex(chartData, barIndex)
Retrieves all custom variables for the specified bar index.
Namespace types: ChartData
Parameters:
chartData (series ChartData) : The `ChartData` object.
barIndex (series int) : The bar index.
Returns: Map of all custom variables that are stored for the specified bar index.
method getEarliestStoredData(chartData)
Gets all values from the earliest bar data that is currently stored in memory.
Namespace types: ChartData
Parameters:
chartData (series ChartData) : The `ChartData` object.
Returns: A tuple:
method getLatestStoredData(chartData, futureData)
Gets all values from the latest bar data that is currently stored in memory.
Namespace types: ChartData
Parameters:
chartData (series ChartData) : The `ChartData` object.
futureData (series bool) : Whether to include the future data that is stored in memory.
Returns: A tuple:

SPX Gamma Pin DetectorUnlock the power of gamma pinning in the S&P 500 (SPX) with this essential overlay indicator, designed for day traders and options enthusiasts. The SPX Gamma Pin Detector highlights key gamma strike levels where market makers and large positions create "sticky" price action, often leading to mean reversion and intraday pins. Based on advanced options flow insights (like those from SpotGamma transcripts), it plots critical support/resistance zones to help you anticipate reversals around high-gamma strikes—such as the 99th percentile levels that stabilize or propel SPX moves.
Key Features:
Visual Gamma Levels: Automatically plots the primary pin strike (e.g., 6475), upper gamma target (e.g., 6550), and lower risk-off support (e.g., 6400). These are customizable via inputs for real-time adaptation to market conditions.
Pin Alert Zone: A dynamic background highlight (yellow) activates when SPX is within 0.1% of the pin strike, signaling potential mean reversion opportunities—perfect for entering 0DTE call flies or put hedges pre-NFP or OPEX.
Buy Dip Alert: Generates TradingView alerts on crossovers above the lower tolerance (e.g., 0.5% below pin), with a message like "SPX near gamma pin - Enter fly!" to catch dip-buying flows from zero-DTE algos.
Vol Crush Filter (Beta): Includes a basic VIX threshold input (default <15) to boost signal strength during low-IV environments, where realized vol contracts and upside is cheap.
How It Works:
This Pine Script v5 indicator overlays horizontal lines and conditional backgrounds on your SPX (or ES1! futures) chart. It uses simple math tolerances to detect proximity to gamma hotspots, mimicking the "sticky gamma" dynamics from options positioning data. For example:
If SPX drifts toward the pin level post-data release (e.g., ADP/NFP), the alert fires to prompt bullish structures like the 6525/6550/6575 call fly (net debit ~$2.25 for $25 max profit).
Negative gamma voids below support warn of slippage risks, aligning with charm effects that support closes near 6465-6475.
Backtest it against historical pins (e.g., Tuesday's 6400 reversal with 5B delta buy) to see 70-80% hit rates in stable regimes. Ideal for our GrokPHDTrading day trading show—pair with transcript parses for edge in low-vol setups (VIX ~15, ATM IV 10-11%).
Usage Tips for Traders:
Setup: Add to a 1-min or 5-min SPX chart. Adjust strikes based on daily gamma maps (e.g., from SpotGamma or our tools).
Entry Signals: Alert triggers? Scale into mean-reversion plays—buy the dip if holds support, target pin for 3-5x ROI.
Risk Management: Stop below risk-off level; hedge with OTM put flies (~$0.30 debit) for tail risks like VIX spikes to 19+.
Customization: Tweak tolerances for ES or SPY equivalents (e.g., SPY 645 for SPX 6465). Add VIX plot for vol confirmation.
Training Integration: Use in our Phase 2: Setup Execution modules—simulates gamma edges for 80% win-rate drills.
Disclaimer: This indicator is for educational and informational purposes only. It draws from public options analysis but does not provide financial advice. Always backtest, use proper risk management, and consult a professional. Past performance isn't indicative of future results. Not affiliated with SpotGamma—purely inspired by their methodologies for our AI-driven trading tools at GrokPHDTrading.com.
Invite to Community: Love gamma trading? Subscribe to our show for live NFP breakdowns and affiliate links to premium flow tools. Questions? Drop in the comments or join our Discord for Pine tweaks!

% of Average Volume% of Average Volume (RVOL)
What it is
This indicator measures cumulative volume during pre market and separately during the first 10 minutes of trading and compares it to the average 30 day volume. This matters as a high ratio of volume within the premarket and then during the first 10 minutes of trading can correlate to a stock that has a higher probability of trending in that direction throughout the day.
What it’s meant to do
Identify abnormally high or low participation early in the day.
Normalize volume by time of session, so 9:40 volume is compared to past 9:40 volume—not to the full-day total.
Provide consistent RVOL across 1–5–15–60 minute charts (the same market state yields similar readings).
Handle pre-market cleanly (optional) without inflating RVOL.
How it works (plain English)
Cumulative Intraday Volume: Adds up all bars from the session (or pre-market, if enabled) up to “now.”
Time-Matched Baseline: For each prior day in your lookback, it accumulates only up to the same intraday minute and averages those values.
RVOL %: RVOL = (Today cumulative / Average cumulative at same time) × 100.
This “like-for-like” approach prevents the classic mistakes that overstate RVOL in pre-market or make it drift with timeframe changes.
Works best on
Intraday charts: 1, 2, 3, 4, 5, 10, 15, 30, 45, 60 min
Regular & extended hours: NYSE/Nasdaq equities, futures, ETFs
Daily/weekly views are supported for reference, but the edge comes from intraday time-matched analysis.
Tip: For thin names or very early pre-market, expect more variability—lower liquidity increases noise.
Customization (Inputs → Settings)
Lookback Sessions (e.g., 20): How many prior trading days to build the average.
Include Pre-Market (on/off): If on, RVOL accumulates from pre-market start and compares to historical pre-market at the same time; if off, it begins at the regular session open only.
Session Timezone / Exchange Hours: Choose the session definition that matches your market (e.g., NYSE) so “time-matched” means the same thing every day.
Cutoff Minute (Optional): Fix a reference minute (e.g., 6:40 a.m. PT / 9:40 a.m. ET) to evaluate RVOL at a standard check-in time.
Smoothing (Optional): Apply a short moving average to the RVOL line to reduce jitter.
Thresholds & Colors: Set levels (e.g., 150%, 300%) to color the plot/labels and trigger alerts.
Show Labels/Debug: Toggle on-chart labels (current RVOL%, baseline vols) for quick audits.
On-chart visuals & alerts
RVOL% Line/Histogram: Color-coded by thresholds (e.g., >300% “exceptional”, >150% “elevated”).
Session Markers: Optional vertical lines for pre-market/regular open.
Alerts:
RVOL Crosses Above X% (e.g., 150%, 300%)
RVOL Crosses Below X%
RVOL Rising/Falling (slope-based, optional)
Good defaults to start
Lookback: 20 sessions
Pre-market: Off for large caps, On for momentum screens
Thresholds: 150% (notable), 300% (exceptional)
Smoothing: 0–3 bars (or off for fastest response)
Notes & best practices
Timeframe consistency: Because calculations are time-matched, RVOL should remain directionally consistent across intraday timeframes. If you see divergences, confirm your session hours & timezone match your instrument’s exchange.
Holiday/half days: These are included in history; you can shorten lookback or exclude such sessions if your workflow prefers.
Low-float names: Consider a slightly longer lookback to reduce outlier effects.
TL;DR
A time-matched RVOL that treats pre-market correctly, stays stable across intraday timeframes, and is fully customizable for your exchange hours, thresholds, and alerts—so you can spot real participation when it matters.

Martingale Strategy Simulator [BackQuant]Martingale Strategy Simulator
Purpose
This indicator lets you study how a martingale-style position sizing rule interacts with a simple long or short trading signal. It computes an equity curve from bar-to-bar returns, adapts position size after losing streaks, caps exposure at a user limit, and summarizes risk with portfolio metrics. An optional Monte Carlo module projects possible future equity paths from your realized daily returns.
What a martingale is
A martingale sizing rule increases stake after losses and resets after a win. In its classical form from gambling, you double the bet after each loss so that a single win recovers all prior losses plus one unit of profit. In markets there is no fixed “even-money” payout and returns are multiplicative, so an exact recovery guarantee does not exist. The core idea is unchanged:
Lose one leg → increase next position size
Lose again → increase again
Win → reset to the base size
The expectation of your strategy still depends on the signal’s edge. Sizing does not create positive expectancy on its own. A martingale raises variance and tail risk by concentrating more capital as a losing streak develops.
What it plots
Equity – simulated portfolio equity including compounding
Buy & Hold – equity from holding the chart symbol for context
Optional helpers – last trade outcome, current streak length, current allocation fraction
Optional diagnostics – daily portfolio return, rolling drawdown, metrics table
Optional Monte Carlo probability cone – p5, p16, p50, p84, p95 aggregate bands
Model assumptions
Bar-close execution with no slippage or commissions
Shorting allowed and frictionless
No margin interest, borrow fees, or position limits
No intrabar moves or gaps within a bar (returns are close-to-close)
Sizing applies to equity fraction only and is capped by your setting
All results are hypothetical and for education only.
How the simulator applies it
1) Directional signal
You pick a simple directional rule that produces +1 for long or −1 for short each bar. Options include 100 HMA slope, RSI above or below 50, EMA or SMA crosses, CCI and other oscillators, ATR move, BB basis, and more. The stance is evaluated bar by bar. When the stance flips, the current trade ends and the next one starts.
2) Sizing after losses and wins
Position size is a fraction of equity:
Initial allocation – the starting fraction, for example 0.15 means 15 percent of equity
Increase after loss – multiply the next allocation by your factor after a losing leg, for example 2.00 to double
Reset after win – return to the initial allocation
Max allocation cap – hard ceiling to prevent runaway growth
At a high level the size after k consecutive losses is
alloc(k) = min( cap , base × factor^k ) .
In practice the simulator changes size only when a leg ends and its PnL is known.
3) Equity update
Let r_t = close_t / close_{t-1} − 1 be the symbol’s bar return, d_{t−1} ∈ {+1, −1} the prior bar stance, and a_{t−1} the prior bar allocation fraction. The simulator compounds:
eq_t = eq_{t−1} × (1 + a_{t−1} × d_{t−1} × r_t) .
This is bar-based and avoids intrabar lookahead. Costs, slippage, and borrowing costs are not modeled.
Why traders experiment with martingale sizing
Mean-reversion contexts – if the signal often snaps back after a string of losses, adding size near the tail of a move can pull the average entry closer to the turn
Behavioral or microstructure edges – some rules have modest edge but frequent small whipsaws; size escalation may shorten time-to-recovery when the edge manifests
Exploration and stress testing – studying the relationship between streaks, caps, and drawdowns is instructive even if you do not deploy martingale sizing live
Why martingale is dangerous
Martingale concentrates capital when the strategy is performing worst. The main risks are structural, not cosmetic:
Loss streaks are inevitable – even with a 55 percent win rate you should expect multi-loss runs. The probability of at least one k-loss streak in N trades rises quickly with N.
Size explodes geometrically – with factor 2.0 and base 10 percent, the sequence is 10, 20, 40, 80, 100 (capped) after five losses. Without a strict cap, required size becomes infeasible.
No fixed payout – in gambling, one win at even odds resets PnL. In markets, there is no guaranteed bounce nor fixed profit multiple. Trends can extend and gaps can skip levels.
Correlation of losses – losses cluster in trends and in volatility bursts. A martingale tends to be largest just when volatility is highest.
Margin and liquidity constraints – leverage limits, margin calls, position limits, and widening spreads can force liquidation before a mean reversion occurs.
Fat tails and regime shifts – assumptions of independent, Gaussian returns can understate tail risk. Structural breaks can keep the signal wrong for much longer than expected.
The simulator exposes these dynamics in the equity curve, Max Drawdown, VaR and CVaR, and via Monte Carlo sketches of forward uncertainty.
Interpreting losing streaks with numbers
A rough intuition: if your per-trade win probability is p and loss probability is q=1−p , the chance of a specific run of k consecutive losses is q^k . Over many trades, the chance that at least one k-loss run occurs grows with the number of opportunities. As a sanity check:
If p=0.55 , then q=0.45 . A 6-loss run has probability q^6 ≈ 0.008 on any six-trade window. Across hundreds of trades, a 6 to 8-loss run is not rare.
If your size factor is 1.5 and your base is 10 percent, after 8 losses the requested size is 10% × 1.5^8 ≈ 25.6% . With factor 2.0 it would try to be 10% × 2^8 = 256% but your cap will stop it. The equity curve will still wear the compounded drawdown from the sequence that led to the cap.
This is why the cap setting is central. It does not remove tail risk, but it prevents the sizing rule from demanding impossible positions
Note: The p and q math is illustrative. In live data the win rate and distribution can drift over time, so real streaks can be longer or shorter than the simple q^k intuition suggests..
Using the simulator productively
Parameter studies
Start with conservative settings. Increase one element at a time and watch how the equity, Max Drawdown, and CVaR respond.
Initial allocation – lower base reduces volatility and drawdowns across the board
Increase factor – set modestly above 1.0 if you want the effect at all; doubling is aggressive
Max cap – the most important brake; many users keep it between 20 and 50 percent
Signal selection
Keep sizing fixed and rotate signals to see how streak patterns differ. Trend-following signals tend to produce long wrong-way streaks in choppy ranges. Mean-reversion signals do the opposite. Martingale sizing interacts very differently with each.
Diagnostics to watch
Use the built-in metrics to quantify risk:
Max Drawdown – worst peak-to-trough equity loss
Sharpe and Sortino – volatility and downside-adjusted return
VaR 95 percent and CVaR – tail risk measures from the realized distribution
Alpha and Beta – relationship to your chosen benchmark
If you would like to check out the original performance metrics script with multiple assets with a better explanation on all metrics please see
Monte Carlo exploration
When enabled, the forecast draws many synthetic paths from your realized daily returns:
Choose a horizon and a number of runs
Review the bands: p5 to p95 for a wide risk envelope; p16 to p84 for a narrower range; p50 as the median path
Use the table to read the expected return over the horizon and the tail outcomes
Remember it is a sketch based on your recent distribution, not a predictor
Concrete examples
Example A: Modest martingale
Base 10 percent, factor 1.25, cap 40 percent, RSI>50 signal. You will see small escalations on 2 to 4 loss runs and frequent resets. The equity curve usually remains smooth unless the signal enters a prolonged wrong-way regime. Max DD may rise moderately versus fixed sizing.
Example B: Aggressive martingale
Base 15 percent, factor 2.0, cap 60 percent, EMA cross signal. The curve can look stellar during favorable regimes, then a single extended streak pushes allocation to the cap, and a few more losses drive deep drawdown. CVaR and Max DD jump sharply. This is a textbook case of high tail risk.
Strengths
Bar-by-bar, transparent computation of equity from stance and size
Explicit handling of wins, losses, streaks, and caps
Portable signal inputs so you can A–B test ideas quickly
Risk diagnostics and forward uncertainty visualization in one place
Example, Rolling Max Drawdown
Limitations and important notes
Martingale sizing can escalate drawdowns rapidly. The cap limits position size but not the possibility of extended adverse runs.
No commissions, slippage, margin interest, borrow costs, or liquidity limits are modeled.
Signals are evaluated on closes. Real execution and fills will differ.
Monte Carlo assumes independent draws from your recent return distribution. Markets often have serial correlation, fat tails, and regime changes.
All results are hypothetical. Use this as an educational tool, not a production risk engine.
Practical tips
Prefer gentle factors such as 1.1 to 1.3. Doubling is usually excessive outside of toy examples.
Keep a strict cap. Many users cap between 20 and 40 percent of equity per leg.
Stress test with different start dates and subperiods. Long flat or trending regimes are where martingale weaknesses appear.
Compare to an anti-martingale (increase after wins, cut after losses) to understand the other side of the trade-off.
If you deploy sizing live, add external guardrails such as a daily loss cut, volatility filters, and a global max drawdown stop.
Settings recap
Backtest start date and initial capital
Initial allocation, increase-after-loss factor, max allocation cap
Signal source selector
Trading days per year and risk-free rate
Benchmark symbol for Alpha and Beta
UI toggles for equity, buy and hold, labels, metrics, PnL, and drawdown
Monte Carlo controls for enable, runs, horizon, and result table
Final thoughts
A martingale is not a free lunch. It is a way to tilt capital allocation toward losing streaks. If the signal has a real edge and mean reversion is common, careful and capped escalation can reduce time-to-recovery. If the signal lacks edge or regimes shift, the same rule can magnify losses at the worst possible moment. This simulator makes those trade-offs visible so you can calibrate parameters, understand tail risk, and decide whether the approach belongs anywhere in your research workflow.
