Oscillator Volume Profile [Trendoscope®]The Oscillator Volume Profile indicator is designed to construct a volume profile based on predefined oscillator levels. It integrates volume data with oscillator readings to offer a unique perspective on market dynamics.
🎲 Selectable Oscillators:
Users can select from an array of oscillator options for the basis of the volume profile, including:
Relative Strength Index (RSI)
Chande Momentum Oscillator (CMO)
Center of Gravity (COG)
Money Flow Index (MFI)
Rate of Change (ROC)
Commodity Channel Index (CCI)
Stochastic Oscillator (Stoch)
True Strength Index (TSI)
Williams %R (WPR)
The length parameters - Length, Fast Length, Slow Length allows users to define the period over which the chosen oscillator is calculated, tailoring the sensitivity of the indicator to their trading strategy.
🎲 Dynamic Overbought/Oversold Ranges:
This indicator enhances traditional concepts by introducing dynamic overbought and oversold levels. These adaptable thresholds are calculated using various methods, including:
🎯 Highest/Lowest Range Method : This method establishes the range based on the highest and lowest values of the oscillator within the last N bars.
🎯 Moving Average Range Method : The range is derived from a moving average of the oscillator, providing a smoothed threshold that reflects more recent market conditions.
In addition to these methods, the indicator incorporates a unique 'Sticky Border' feature:
🎯 Sticky Border: With this option enabled, the dynamic ranges maintain their levels until the oscillator breaks out of the range. Once a breakout occurs, the levels are recalculated and updated. This mechanism ensures that the borders remain consistent and relevant, only adjusting to significant market movements that warrant a recalculation.
Users can select their preferred method for determining dynamic ranges, allowing for a customized approach that aligns with their analysis and trading strategy. The sticky border feature further refines this functionality, offering continuity until a decisive market move occurs.
🎲 Volume Profile Calculation Parameters:
🎯 Trend Filter: The indicator provides a versatile trend filter with four selectable options:
Uptrend: The volume profile is calculated when the oscillator indicates an uptrend.
Downtrend: The volume profile is calculated when the oscillator indicates a downtrend.
Any: The volume profile is calculated regardless of the trend.
External: Users can input values from an external indicator. The volume profile is then calculated only when the external indicator's value is non-zero, integrating external analysis into the volume profile construction.
🎯 Precision: Users have the option to define the precision for calculating the volume profile, which is crucial due to the varying scales of different oscillators (e.g., some oscillators range from 0 to 100, while others from -1 to 1). Selecting an appropriate precision ensures that the volume profile is accurately aligned with the minimal price range significant to the chosen oscillator. This setting requires user intervention for optimal configuration, as automatic calculation is not feasible due to the diverse nature of oscillator ranges.
🎯 Number of Bars: Users can select a specific number of bars for volume profile calculation, or opt to include all available historical bars for a comprehensive profile.
🎲 Selecting the right precision:
Users must select the right precision based on their choice of indicator. For example, RSI values range from 0-100. Hence, the default precision of 1 work fine on RSI as the volume profiles are plotted from 0 to 100 at the interval of 0.1
But, the default precision of 1 will not be ok on TSI because TSI values range from -1 to 1. Hence, using 1 as precision will result in very less volume profile lines as shown below.
Due to this, it is necessary to increase the precision for oscillators such as TSI where the range between highest and lowest value is far less. Once we set the precision to 2, we can see more appropriate volume profile division.
🎲 Note of thanks:
This publication uses polyline feature for drawing volume profiles. The advantage of using polyline is that we can overcome max 500 lines issue that we face by using the regular line objects. More details of polyline can be found in the tradingview blog post
Further, using polyline for display of volume profiles is inspired by the publications of fikira and KioseffTrading
ค้นหาในสคริปต์สำหรับ "美股标普500指数基金中国"

Webby's Quick & Grateful Dead RSWebby's Quick & Grateful Dead RS combines a Relative Strength Line and Moving Averages to help traders hold a core position in a winning stock by identifying moments of strength and weakness in a stocks advance.
The Relative Strength (RS) line is something many investors are familiar with. It is used to measure a stocks performance versus the S&P 500 (default setting) and is typically calculated by dividing the closing price of the stock by the closing price of the S&P. This means if a stock moves up and the S&P moves down or the stock moves up more than the S&P the RS line will increase, if the stock moves down while the S&P moves up the line will decrease.
While the RS Line by itself is a powerful tool, adding moving averages to the RS line can help better understand trends. This work was done by Mike Webster (Webby) as he tried to reverse engineer how William O'Neil was able to hold some of his biggest winning positions.
This indicator plots the RS line along with two moving averages and clearly labels and alerts the 3 signals shared by Webby:
Quick Break - RS line crosses below the fast moving average
Quicksand - RS line moves lower than it was at the time of the Quick Break
Grateful Dead Break - RS line crosses below the slow moving average
To ensure your chart doesn't get skewed, please use the multiplier in the setting to adjust the vertical offset of the RS line and moving averages.

Polyline PlusThis library introduces the `PolylinePlus` type, which is an enhanced version of the built-in PineScript `polyline`. It enables two features that are absent from the built-in type:
1. Developers can now efficiently add or remove points from the polyline. In contrast, the built-in `polyline` type is immutable, requiring developers to create a new instance of the polyline to make changes, which is cumbersome and incurs a significant performance penalty.
2. Each `PolylinePlus` instance can theoretically hold up to ~1M points, surpassing the built-in `polyline` type's limit of 10K points, as long as it does not exceed the memory limit of the PineScript runtime.
Internally, each `PolylinePlus` instance utilizes an array of `line`s and an array of `polyline`s. The `line`s array serves as a buffer to store lines formed by recently added points. When the buffer reaches its capacity, it flushes the contents and converts the lines into polylines. These polylines are expected to undergo fewer updates. This approach is similiar to the concept of "Buffered I/O" in file and network systems. By connecting the underlying lines and polylines, this library achieves an enhanced polyline that is dynamic, efficient, and capable of surpassing the maximum number of points imposed by the built-in polyline.
🔵 API
Step 1: Import this library
import algotraderdev/polylineplus/1 as pp
// remember to check the latest version of this library and replace the 1 above.
Step 2: Initialize the `PolylinePlus` type.
var p = pp.PolylinePlus.new()
There are a few optional params that developers can specify in the constructor to modify the behavior and appearance of the polyline instance.
var p = pp.PolylinePlus.new(
// If true, the drawing will also connect the first point to the last point, resulting in a closed polyline.
closed = false,
// Determines the field of the chart.point objects that the polyline will use for its x coordinates. Either xloc.bar_index (default), or xloc.bar_time.
xloc = xloc.bar_index,
// Color of the polyline. Default is blue.
line_color = color.blue,
// Style of the polyline. Default is line.style_solid.
line_style = line.style_solid,
// Width of the polyline. Default is 1.
line_width = 1,
// The maximum number of points that each built-in `polyline` instance can contain.
// NOTE: this is not to be confused with the maximum of points that each `PolylinePlus` instance can contain.
max_points_per_builtin_polyline = 10000,
// The number of lines to keep in the buffer. If more points are to be added while the buffer is full, then all the lines in the buffer will be flushed into the poylines.
// The higher the number, the less frequent we'll need to // flush the buffer, and thus lead to better performance.
// NOTE: the maximum total number of lines per chart allowed by PineScript is 500. But given there might be other places where the indicator or strategy are drawing lines outside this polyline context, the default value is 50 to be safe.
lines_bffer_size = 50)
Step 3: Push / Pop Points
// Push a single point
p.push_point(chart.point.now())
// Push multiple points
chart.point points = array.from(p1, p2, p3) // Where p1, p2, p3 are all chart.point type.
p.push_points(points)
// Pop point
p.pop_point()
// Resets all the points in the polyline.
p.set_points(points)
// Deletes the polyline.
p.delete()
🔵 Benchmark
Below is a simple benchmark comparing the performance between `PolylinePlus` and the native `polyline` type for incrementally adding 10K points to a polyline.
import algotraderdev/polylineplus/2 as pp
var t1 = 0
var t2 = 0
if bar_index < 10000
int start = timenow
var p = pp.PolylinePlus.new(xloc = xloc.bar_time, closed = true)
p.push_point(chart.point.now())
t1 += timenow - start
start := timenow
var polyline pl = na
var points = array.new()
points.push(chart.point.now())
if not na(pl)
pl.delete()
pl := polyline.new(points)
t2 += timenow - start
if barstate.islast
log.info('{0} {1}', t1, t2)
For this benchmark, `PolylinePlus` took ~300ms, whereas the native `polyline` type took ~6000ms.
We can also fine-tune the parameters for `PolylinePlus` to have a larger buffer size for `line`s and a smaller buffer for `polyline`s.
var p = pp.PolylinePlus.new(xloc = xloc.bar_time, closed = true, lines_buffer_size = 500, max_points_per_builtin_polyline = 1000)
With the above optimization, it only took `PolylinePlus` ~80ms to process the same 10K points, which is ~75x the performance compared to the native `polyline`.

Leading Economic Indicator (LEI)The Leading Economic Indicator (LEI) is a groundbreaking technical indicator designed to serve as a comprehensive measure of the prevailing direction of economic trends in the United States. This unique index combines two key economic indicators: the Composite Leading Indicator (CLI) from the Organization for Economic Co-operation and Development (OECD) and the Purchasing Managers' Index (PMI) from the Institute for Supply Management (ISM).
The OECD Composite Leading Indicator (CLI) is a globally recognized indicator that assesses the future direction of economic trends by analyzing various leading economic factors. The ISM PMI, on the other hand, provides insights into the business activities of both the manufacturing and services sectors. LEI merges these critical indicators into a single, holistic indicator that empowers traders and investors to grasp the broader economic outlook and the performance of essential economic sectors simultaneously.
By taking into account the CLI and PMI, LEI offers a distinctive perspective, enabling a more accurate assessment of the potential direction of US financial markets.
Usage:
To utilize LEI effectively, it is recommended to apply it on a monthly timeframe (TF Monthly). This extended timeframe is particularly beneficial for investors with a medium to long-term horizon. By focusing on longer-term trends and market stability, LEI becomes an invaluable tool in your investment strategy.
One of the primary applications of LEI is to gauge the risk of market corrections in US financial markets, including the S&P 500, Nasdaq, and Dow Jones indices. Analysts often observe the crossing of the 5-period Simple Moving Average (SMA) with the 10-period SMA. When the 5-period SMA falls below the 10-period SMA, it serves as a potential warning signal for an impending market correction. This feature provides traders with an opportunity to exercise caution and make well-informed investment decisions.
LEI, with its unique blend of the OECD CLI and ISM PMI, provides a reliable tool for assessing the US economic climate, identifying trends, and making informed decisions in the financial markets. It stands as a reference indicator, capturing the essence of economic trends and providing valuable insights to traders and investors.
Sources:
- OECD Composite Leading Indicator (CLI): www.data.oecd.org
- Purchasing Managers' Index: ISM Report on Business (PMI) www.ismworld.org

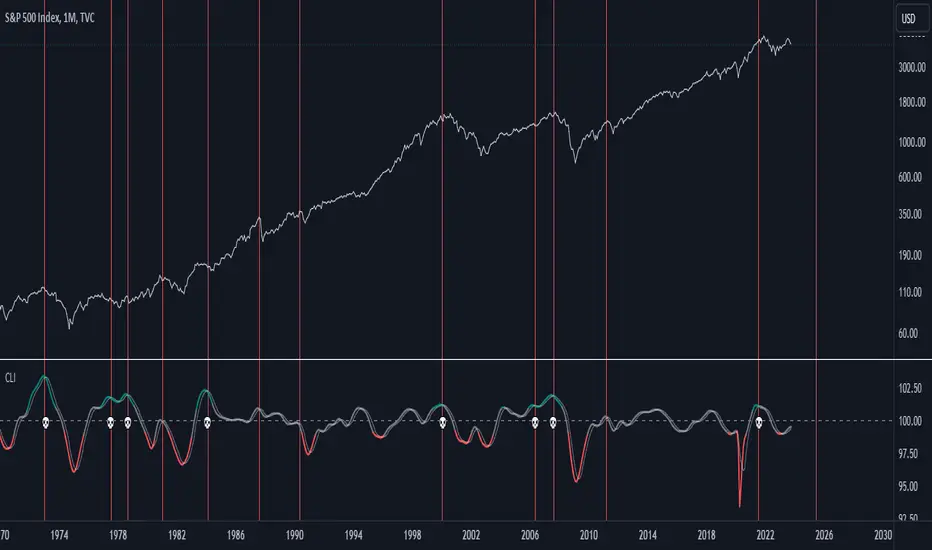
US Composite Leading Indicator (CLI)The US Composite Leading Indicator (CLI), normalized for the United States, closely mirrors the Conference Board "Leading Economic Index" (LEI). It offers unique insights into economic and financial dynamics.
The Composite Leading Indicator (CLI) is an economic tool designed to anticipate economic developments. It is created by aggregating and normalizing a wide range of economic and financial data from various sources.
The normalized data is then aggregated, and a composite indicator is calculated by taking a weighted average of individual indicators.
The CLI is used to provide early insights into the state of the economy and to anticipate future economic trends. It is particularly valuable for predicting economic downturns, including recessions.
The CLI is an essential tool for economists, governments, businesses, and investors seeking to understand economic trends and make informed decisions.
Key Features:
1. Early Warning: Just like its counterpart, the CLI indicator excels at offering early warnings about significant economic events, particularly economic crises. This makes it an indispensable asset for analysts and investors.
2. Recession Indicators: The moving average serves as an early warning system for potential economic recessions. When it crosses the indicator line from the bottom to the top while surpassing a predefined threshold (e.g., 101), it signals a potential crisis.
3. Market Impact: The CLI indicator provides valuable insights into the performance of financial markets, offering cues about indices such as the S&P 500, Nasdaq, Dow Jones, and more.
Why It Matters:
Understanding the US Composite Leading Indicator (CLI) indicator, normalized for the United States, is crucial for anticipating economic shifts and preparing for changes in financial markets. By analyzing a diverse array of economic factors, it provides a holistic view of economic well-being. Whether you're an investor or economist, this indicator can be an invaluable resource for staying informed about market trends and major economic developments.
Source:
www.data.oecd.org
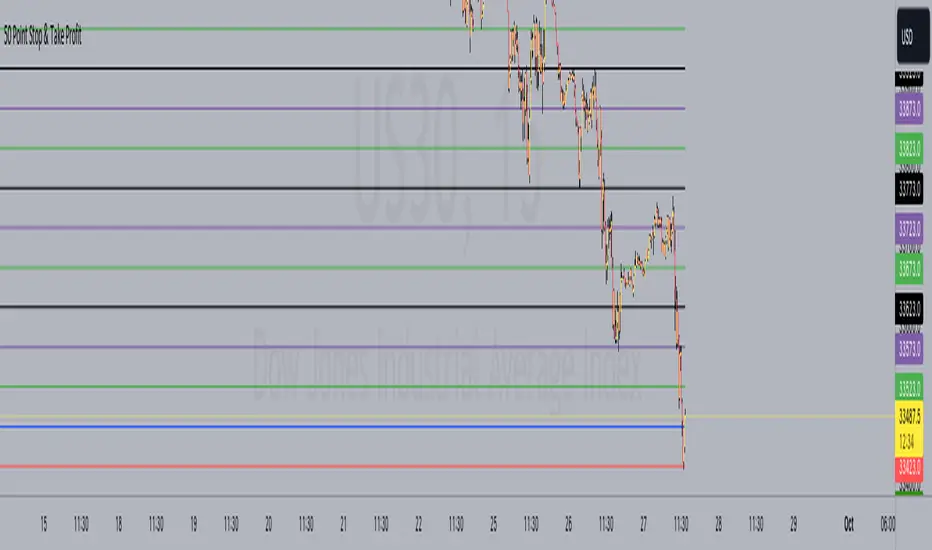
50 Point Stop & Take Profit**50 Point Stop & Take Profit**
This custom TradingView indicator is designed for instruments like US30 or any asset following a point system. It assists traders in setting precise stop-loss and take-profit levels based on different risk-reward ratios. It calculates and plots horizontal lines at various price levels above and below your specified entry price, with a 50-point difference between each ratio.
**How It Benefits Your Strategy:**
- Each risk-reward ratio, whether it's 1:1, 2:1, 3:1, and so on, is separated by precisely 50 points. This deliberate spacing is tailored to provide you with clear and consistent reference points for managing trades in instruments using a point-based system.
- The 50-point increments make it easy to adjust your positions, ensuring that your risk and reward levels align with your trading strategy and objectives.
**Usage:**
1. Set your desired entry price using the "Entry Price" input.
2. The indicator is ideally suited for instruments like US30, where each point represents a distinct price movement. It will automatically calculate and plot multiple lines at the following levels, both for Long (L) and Short (S) positions:
- 1:1 Risk-Reward Ratio (±50 points)
- 2:1 Risk-Reward Ratio (±100 points)
- 3:1 Risk-Reward Ratio (±150 points)
- 4:1 Risk-Reward Ratio (±200 points)
- 5:1 Risk-Reward Ratio (±250 points)
- 6:1 Risk-Reward Ratio (±300 points)
- 7:1 Risk-Reward Ratio (±350 points)
- 8:1 Risk-Reward Ratio (±400 points)
- 9:1 Risk-Reward Ratio (±450 points)
- 10:1 Risk-Reward Ratio (±500 points)
**Customization Options:**
- **Alerts:** You can set alerts for each level to receive notifications when the price reaches a specific risk-reward ratio.
- **Color Customization:** Customize the colors of the plotted lines to suit your chart preferences.
- **Toggle Ratios:** Easily toggle on/off different risk-reward ratios to focus on specific levels that align with your trading strategy.
**How to Use:**
- Use the plotted lines as reference points for setting stop-loss and take-profit orders at your preferred risk-reward ratios.
- The blue horizontal line represents your specified entry price.
This indicator simplifies your trading strategy by providing clear visual cues for managing risk and reward levels, with each level thoughtfully spaced 50 points apart to cater to your strategy's precision.
*Note: Always use risk management and proper trade sizing in your trading strategy.*
**Version:** Pine Script version 5
Divergences RefurbishedJust as "a butterfly can flap its wings over a flower in China and cause a hurricane in the Caribbean" (Edward Lorenz), small divergences in markets can signal big trading opportunities.
█Introduction
This is a script forked from LonesomeTheBlue's Divergence for Many Indicators v4.
It is a script that checks for divergence between price and many indicators.
In this version, I added more indicators and also added 40 symbols to check for divergences.
More info on the original script can be found here:
█ Improvements
The following improvements have been implemented over v4:
1. Added parameters to customize indicators.
2. Added new indicators:
- Stoch RSI
- Volume Oscillator
- PVT (Price Volume Trend)
- Ultimate Oscillator
- Fisher Transform
- Z-Score/T-Score
3. Now there is the possibility of using 2 external indicators.
4. New option to show tooltips inside labels.
This allows you to save space on the screen if you choose the option to only show the number of divergences or just the abbreviations.
5. New option to show additional text next to the indicator name.
This allows for grouping of indicators and symbols and better visualization, whether through emojis, for example.
6. Added 40 customizable symbols to check for divergences.
7. Option "show only the first letter" of the indicator replaced by: "show the abbreviation of the indicator".
Reason: the indicator abbreviation is more informative and easier to read.
8. Script converted to PineScript version 5.
█ CONCEPTS
Below I present a brief description of the available indicators.
1. Moving Average Convergence/Divergence (MACD):
Shows the difference between short-term and long-term exponential moving averages.
2. MACD Histogram:
Shows the difference between MACD and its signal line.
3. Relative Strength Index (RSI):
Measures the relative strength of recent price gains to recent price losses of an asset.
4. Stochastic Oscillator (Stoch):
Compares the current price of an asset to its price range over a specified time period.
5. Stoch RSI:
Stochastic of RSI.
6. Commodity Channel Index (CCI):
Measures the relationship between an asset's current price and its moving average.
7. Momentum: Shows the difference between the current price and the price a few periods ago.
Shows the difference between the current price and the price of a certain period in the past.
8. Chaikin Money Flow (CMF):
A variation of A/D that takes into account the daily price variation and weighs trading volume accordingly. Accumulation/Distribution (A/D) identifies buying and selling pressure by tracking the flow of money into and out of an asset based on volume patterns.
9. On-Balance Volume (OBV):
Identify divergences between trading volume and an asset's price.
Sum of trading volume when the price rises and subtracts volume when the price falls.
10. Money Flow Index (MFI):
Measures volume pressure in a range of 0 to 100.
Calculates the ratio of volume when the price goes up and when the price goes down.
11. Volume Oscillator (VO):
Identify divergences between trading volume and an asset's price. Ratio of change of volume, from a fast period in relation to a long period.
12. Price-Volume Trend (PVT):
Identify the strength of an asset's price trend based on its trading volume. Cumulative change in price with volume factor. The PVT calculation is similar to the OBV calculation, but it takes into account the percentage price change multiplied by the current volume, plus the previous PVT value.
13. Ultimate Oscillator (UO):
Combines three different time periods to help identify possible reversal points.
14. Fisher Transform (FT):
Normalize prices into a Gaussian normal distribution.
15. Z-Score/T-Score: Shows the difference between the current price and the price a few periods ago. I is a statistical measurement that indicates how many standard deviations a data point is from the mean of a data set.
When to use t-score instead of z-score? When the sample size is small (length < 30).
Here, the use of z-score or t-score is chosen automatically based on the length parameter.
█ What to look for
The operation is simple. The script checks for divergences between the price and the selected indicators.
Now with the possibility of using multiple symbols, it is possible to check divergences between different assets.
A well-described view on divergences can be found in this cheat sheet:
◈ Examples with SPY ETF versus indicators:
1. Regular bullish divergence with external indicator:
1. Regular bearish divergence with Fisher Transform:
1. Positive hidden divergence with Momentum indicator:
1. Negative hidden divergence with RSI:
◈ Examples with SPY ETF versus other symbols:
1. Regular bearish divergence with European Stoch Market:
2. Regular bearish divergence with DXY inverted:
3. Regular bullish divergence with Taiwan Dollar:
4. Regular bearish divergence with US10Y (10-Year US Treasury Note):
5. Regular bullish divergence with QQQ ETF (Nasdaq 100):
6. Regular bullish divergence with ARKK ETF (ARK Innovation):
7.Positive hidden divergence with RSP ETF (S&P 500 Equal Weight):
8. Negative hidden divergence with EWZ ETF (Brazil):
◈ Examples with BTCUSD versus other symbols:
1. Regular bearish divergence with BTCUSDLONGS from Bitfinex:
2. Regular bearish divergence with BLOK ETF (Amplify Transformational Data Sharing):
3. Negative hidden divergence with NATGAS (Natural Gas):
4. Positive hidden divergence with TOTALDEFI (Total DeFi Market Cap):
█ Conclusion
The symbols available to check divergences were chosen in such a way as to cover the main markets, in the most generic way possible.
You can adjust them according to your needs.
A trader in the American market, for example, could add more ETFs, American stocks, and sectoral indices, such as the XLF (Financial Select Sector SPDR Fund), the XLK (Technology Select Sector SPDR), etc.
On the other hand, a cryptocurrency trader could add more currency pairs and sector indicators, such as BTCUSDSHORTS (Bitfinex), USDT.D (Tether Dominance), etc.
If the chart becomes too cluttered, you can use the option to show only the number of divergences or only the indicator abbreviations.
Or even disable certain indicators and symbols, if they are not of interest to you.
I hope this script is useful.
Don't forget to support LonesomeTheBlue's work too.

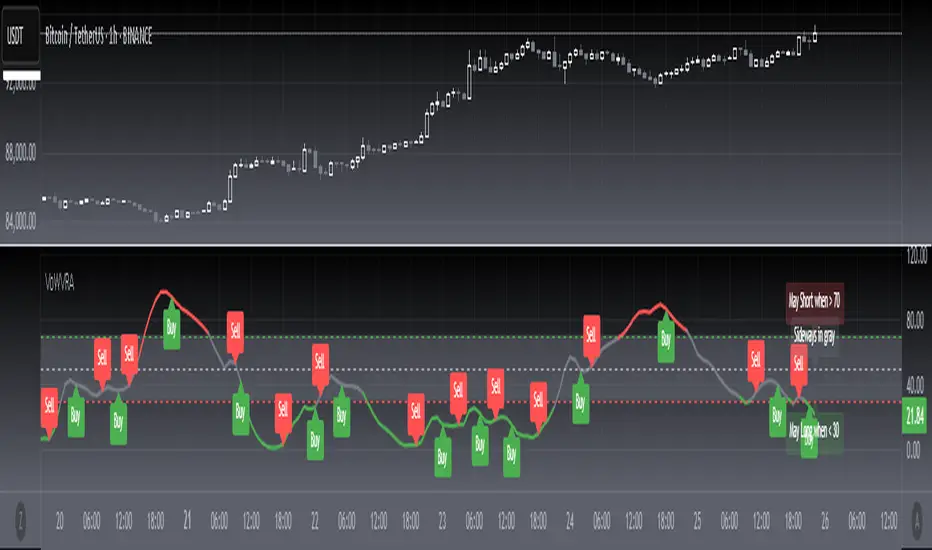
[blackcat] L2 Votatility of Williams VixFix Risk AssessmentHey there! I previously wrote an article about the Larry Williams ViX Fix technical indicator. Soon after, friends from the TradingView community told me that this indicator could be combined with the Risk Assessment indicator I wrote about earlier to determine when to go long or short. At the time, I found it a bit cumbersome to use both indicators together, so I came up with a solution: to merge them. This way, we can use one technical indicator to visually see whether we should go long or short. Isn't that cool? The indicator has a very common name: ** L2 Votatility of Williams VixFix Risk Assessment, or VoWVRA for short.**
This TradingView Pine Script is a custom indicator based on the Larry Williams ViX Fix technical indicator, designed to help traders with risk assessment and trading decisions. The Larry Williams ViX Fix indicator is derived from the volatility of the S&P 500 index and is mainly used to display changes in current market sentiment. The indicator determines market volatility by calculating the distance between the highest price, the lowest price, and the closing price. The higher the value of the indicator, the more tense the market sentiment, and the higher the market volatility; conversely, the lower the value, the more stable the market sentiment and the lower the market volatility.
The VoWVRA indicator is based on the Larry Williams ViX Fix indicator, combined with technical indicators such as Bollinger Bands and EMA, to assess market risk. The indicator can be customized with input parameters to suit different markets and investor needs. Using the VoWVRA indicator can help traders make wiser choices in risk control and trading decisions.
In addition, this TradingView Pine Script also includes a risk assessment indicator. The indicator calculates a series of values and then applies the exponential moving average (EMA) to the percentage change between the closing price and the highest and lowest prices within a certain range to determine the safety level. The safety level is then compared to different thresholds to determine the market's risk level. The risk assessment indicator can be customized with input parameters such as risk length, safety length, and EMA length to suit different market conditions and investor preferences. Using the risk assessment indicator can help traders make wiser decisions in risk management and trading strategies.
By using the VoWVRA and risk assessment indicators, traders can more accurately assess market risk and make wiser choices in trading decisions.
Cycles: 4x dual inputs: Swing / Time Cycles projected forward//Purpose/Premise:
To project forward vertical 'cycle' lines based on user-input anchor points, and to search for confluence.
The idea being that if several well-anchored cycles agree (i.e. we see multiple bunched vertical line confluence in the future), then this may add support to an already existing trade idea, or may indicate an increased likelihood of a shift in direction.
//Usage & notes:
~In the above chart I've anchored to obvious swing lows and swing highs in Btc/Usd from 2020-2022. You could also use fixed time-based cycles from a favored start anchor point. Bars per cycle are printed at the top of each cycle box if your're interested in time cycles. I.e. for 1, 2, 3 month cycles: for BTC you could use 30, 60, 90 bars on daily; for S&P you could use 20, 40, 60 bars on daily.
~On first loading the indicator you will be asked select 'start date', and 'end date' for each of 4 sessions (8x clicks on chart). After this you can easily reset points by clicking the indicator display line three dots>> reset points. Or you can simply drag the vertical box edges (purple lines) to change your cycle anchor points.
~Be sure the start anchor point is before the end anchor point or box/lines won't appear.
~When you drop down to low timeframes you might get bar_index error due to history available: you need then to click the three dots on indicator display line >> reset points >> 8x clicks on the chart.
~Vertical projected lines will match the color of the cycle box they origninate from.
~Lines will project into the future as far as is allowed by tradingview (500 bars max)
//Inputs:
~Time start and end dates for each cycle (change these as described above, or input manually)
~Show/hide each cycle (default is show all 4)
~Formatting options: color of forward projected lines, line width, line style, line / box / text color.
~Box transparancy: Set to 100 to make boxes invisible & declutter the chart. Set to 0 for maximum opacity. Default is 80.
thanks to @Sathyamurthie for his ideas on cycle confluence which caused me to write this.

Paytience DistributionPaytience Distribution Indicator User Guide
Overview:
The Paytience Distribution indicator is designed to visualize the distribution of any chosen data source. By default, it visualizes the distribution of a built-in Relative Strength Index (RSI). This guide provides details on its functionality and settings.
Distribution Explanation:
A distribution in statistics and data analysis represents the way values or a set of data are spread out or distributed over a range. The distribution can show where values are concentrated, values are absent or infrequent, or any other patterns. Visualizing distributions helps users understand underlying patterns and tendencies in the data.
Settings and Parameters:
Main Settings:
Window Size
- Description: This dictates the amount of data used to calculate the distribution.
- Options: A whole number (integer).
- Tooltip: A window size of 0 means it uses all the available data.
Scale
- Description: Adjusts the height of the distribution visualization.
- Options: Any integer between 20 and 499.
Round Source
- Description: Rounds the chosen data source to a specified number of decimal places.
- Options: Any whole number (integer).
Minimum Value
- Description: Specifies the minimum value you wish to account for in the distribution.
- Options: Any integer from 0 to 100.
- Tooltip: 0 being the lowest and 100 being the highest.
Smoothing
- Description: Applies a smoothing function to the distribution visualization to simplify its appearance.
- Options: Any integer between 1 and 20.
Include 0
- Description: Dictates whether zero should be included in the distribution visualization.
- Options: True (include) or False (exclude).
Standard Deviation
- Description: Enables the visualization of standard deviation, which measures the amount of variation or dispersion in the chosen data set.
- Tooltip: This is best suited for a source that has a vaguely Gaussian (bell-curved) distribution.
- Options: True (enable) or False (disable).
Color Options
- High Color and Low Color: Specifies colors for high and low data points.
- Standard Deviation Color: Designates a color for the standard deviation lines.
Example Settings:
Example Usage RSI
- Description: Enables the use of RSI as the data source.
- Options: True (enable) or False (disable).
RSI Length
- Description: Determines the period over which the RSI is calculated.
- Options: Any integer greater than 1.
Using an External Source:
To visualize the distribution of an external source:
Select the "Move to" option in the dropdown menu for the Paytience Distribution indicator on your chart.
Set it to the existing panel where your external data source is placed.
Navigate to "Pin to Scale" and pin the indicator to the same scale as your external source.
Indicator Logic and Functions:
Sinc Function: Used in signal processing, the sinc function ensures the elimination of aliasing effects.
Sinc Filter: A filtering mechanism which uses sinc function to provide estimates on the data.
Weighted Mean & Standard Deviation: These are statistical measures used to capture the central tendency and variability in the data, respectively.
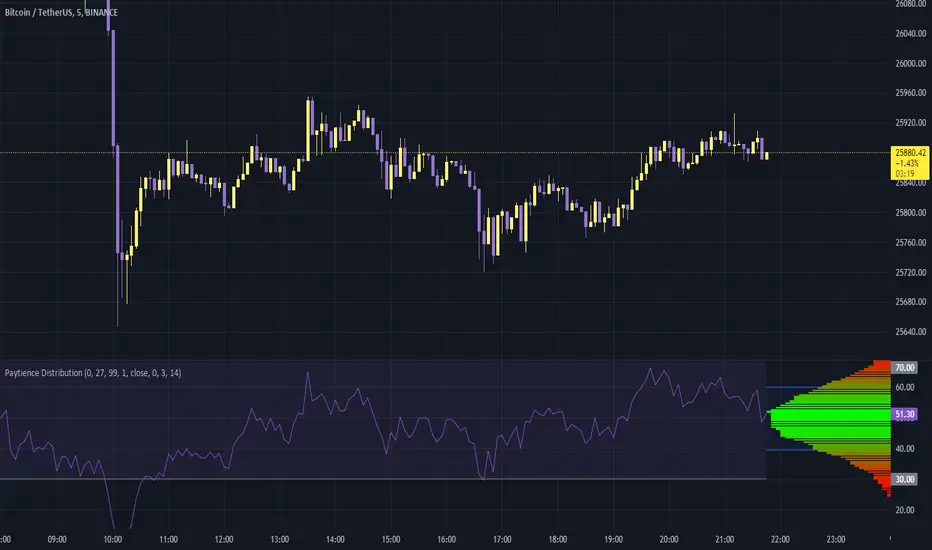
Output and Visualization:
The indicator visualizes the distribution as a series of colored boxes, with the intensity of the color indicating the frequency of the data points in that range. Additionally, lines representing the standard deviation from the mean can be displayed if the "Standard Deviation" setting is enabled.
The example RSI, if enabled, is plotted along with its common threshold lines at 70 (upper) and 30 (lower).
Understanding the Paytience Distribution Indicator
1. What is a Distribution?
A distribution represents the spread of data points across different values, showing how frequently each value occurs. For instance, if you're looking at a stock's closing prices over a month, you may find that the stock closed most frequently around $100, occasionally around $105, and rarely around $110. Graphically visualizing this distribution can help you see the central tendencies, variability, and shape of your data distribution. This visualization can be essential in determining key trading points, understanding volatility, and getting an overview of the market sentiment.
2. The Rounding Mechanism
Every asset and dataset is unique. Some assets, especially cryptocurrencies or forex pairs, might have values that go up to many decimal places. Rounding these values is essential to generate a more readable and manageable distribution.
Why is Rounding Needed? If every unique value from a high-precision dataset was treated distinctly, the resulting distribution would be sparse and less informative. By rounding off, the values are grouped, making the distribution more consolidated and understandable.
Adjusting Rounding: The `Round Source` input allows users to determine the number of decimal places they'd like to consider. If you're working with an asset with many decimal places, adjust this setting to get a meaningful distribution. If the rounding is set too low for high precision assets, the distribution could lose its utility.
3. Standard Deviation and Oscillators
Standard deviation is a measure of the amount of variation or dispersion of a set of values. In the context of this indicator:
Use with Oscillators: When using oscillators like RSI, the standard deviation can provide insights into the oscillator's range. This means you can determine how much the oscillator typically deviates from its average value.
Setting Bounds: By understanding this deviation, traders can better set reasonable upper and lower bounds, identifying overbought or oversold conditions in relation to the oscillator's historical behavior.
4. Resampling
Resampling is the process of adjusting the time frame or value buckets of your data. In the context of this indicator, resampling ensures that the distribution is manageable and visually informative.
Resample Size vs. Window Size: The `Resample Resolution` dictates the number of bins or buckets the distribution will be divided into. On the other hand, the `Window Size` determines how much of the recent data will be considered. It's crucial to ensure that the resample size is smaller than the window size, or else the distribution will not accurately reflect the data's behavior.
Why Use Resampling? Especially for price-based sources, setting the window size around 500 (instead of 0) ensures that the distribution doesn't become too overloaded with data. When set to 0, the window size uses all available data, which may not always provide an actionable insight.
5. Uneven Sample Bins and Gaps
You might notice that the width of sample bins in the distribution is not uniform, and there can be gaps.
Reason for Uneven Widths: This happens because the indicator uses a 'resampled' distribution. The width represents the range of values in each bin, which might not be constant across bins. Some value ranges might have more data points, while others might have fewer.
Gaps in Distribution: Sometimes, there might be no data points in certain value ranges, leading to gaps in the distribution. These gaps are not flaws but indicate ranges where no values were observed.
In conclusion, the Paytience Distribution indicator offers a robust mechanism to visualize the distribution of data from various sources. By understanding its intricacies, users can make better-informed trading decisions based on the distribution and behavior of their chosen data source.
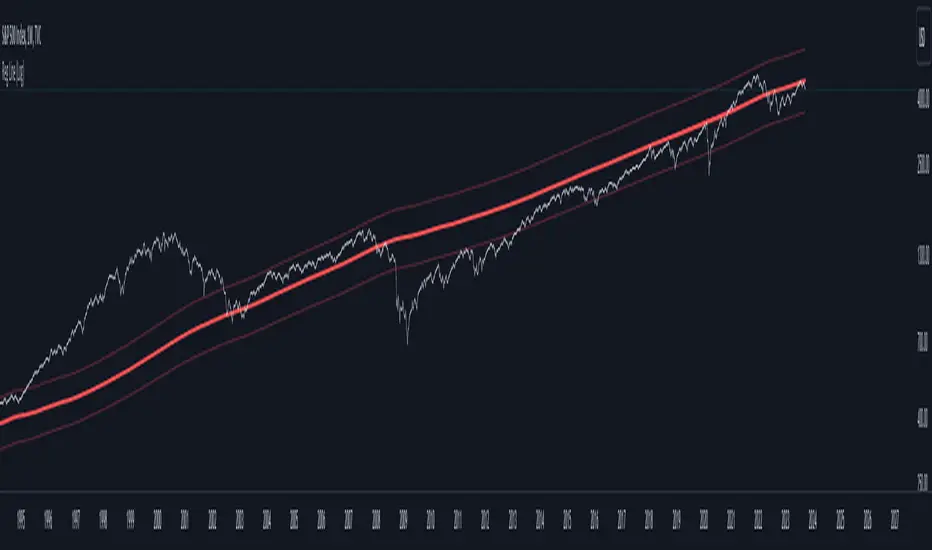
Regression Line (Log)This indicator is based on the "Linear Regression Channel (Log)," which, in turn, is derived from TradingView's "Linear Regression Channel."
The "Regression Line (Log)" indicator is a valuable tool for traders and investors seeking to gain insights into long-term market trends. This indicator is personally favored for its ability to provide a comprehensive view of price movements over extended periods. It offers a unique perspective compared to traditional linear regression lines and moving averages, making it a valuable addition to the toolkit of experienced traders and investors.
Indicator Parameters:
Before delving into the details, it's worth noting that the chosen number of periods (2870) is a personal preference. This specific value is utilized for the S&P 500 index due to its alignment with various theories regarding the beginning of the modern economic era in the stock market. Different analysts propose different starting points, such as the 1950s, 1970s, or 1980s. However, users are encouraged to adjust this parameter to suit their specific needs and trading strategies.
How It Works:
The "Regression Line (Log)" indicator operates by transforming the closing price data into a logarithmic scale. This transformation can make the linear regression more suitable for data with exponential trends or rapid growth. Here's a breakdown of its functioning and why it can be advantageous for long-term trend analysis:
1. Logarithmic Transformation : The indicator begins by applying a logarithmic transformation to the closing price. This transformation helps capture price movements proportionally, making it especially useful for assets that exhibit exponential or rapid growth. This transformation can render linear regression more suitable for data with exponential or fast-paced trends.
2. Linear Regression on Log Scale : After the logarithmic transformation, the indicator calculates a linear regression line (lrc) on this log-transformed data. This step provides a smoother representation of long-term trends compared to a linear regression line on a linear scale.
3. Exponential Reversion : To present the results in a more familiar format, the indicator reverts the log-transformed regression line back to a linear scale using the math.exp function. This final output is the "Linear Regression Curve," which can be easily interpreted on standard price charts.
Advantages:
- Long-Term Trend Clarity : The logarithmic scale better highlights long-term trends and exponential price movements, making it a valuable tool for investors seeking to identify extended trends.
- Smoothing Effect : The logarithmic transformation and linear regression on a log scale smooth out price data, reducing noise and providing a clearer view of underlying trends.
- Adaptability : The indicator allows traders and investors to customize the number of periods (length) to align with their preferred historical perspective or trading strategy.
- Complementary to Other Tools : While not meant to replace other technical indicators, the "Regression Line (Log)" indicator complements traditional linear regression lines and moving averages, offering an alternative perspective for more comprehensive analysis.
Conclusion:
In summary, the "Regression Line (Log)" indicator is a versatile tool that can enhance your ability to analyze long-term market trends. Its logarithmic transformation provides a unique perspective on price data, particularly suited for assets with exponential growth patterns. While the choice of the number of periods is a personal one, it can be adapted to fit various historical viewpoints. This indicator is best utilized as part of a well-rounded trading strategy, in conjunction with other technical tools, to aid in informed decision-making.
[GTH decimals heatmap] (wide screen advised)Preface
I share my personal general view on indicators below; skip ahead to the Description below if you are not interested.
It is my personal conviction that most - if not all - indicators rely mainly on trader's belief that they work, and in a feedback system like free markets they might become a self-fulfilling prophecy as a result, if (!) a big part of the traders believes in it, because some famous trader releases an indicator, or such person's public statement goes viral.
One of those voodoo indicators is the famous "follow-through day". There is zero statistical evidence for its validity, beyond the validity of a statement like "If it's bright at day it's usually the sun shining". The uselessness was proven exactly on its inventor's YT channel, Investors Business Daily. According to the examiner, its inventor William J. O'Neil himself could not explain the values used for this indicator. It might have been an incidental observation at some point without general validity. A.k.a "curve fitting". Still, it's being used by many today.
Another one of those indicators is the three points reversal on the S&P 500 Volatility Index (VIX) which allegedly might potentially maybe indicate a possible shift in trend. Both indicators share an immediately problematic feature: They use absolute values. Nothing is ever absolute in a highly subjective and emotionally driven game like the markets where a lot of money can be made and lost.
Most indicators can not produce additional information since they can only re-pack price/volume action. Many times an interpretion of the distance between price and a moving average and/or the slope of a moving average deliver very similar - if not better - results than MACD, RSI etc., especially with standard settings, the origin of which are usually unknown (always a warning sign). Very few indicators can deliver information which is otherwise hard to quantify, e. g. market noise (Kaufman's Efficiency Ratio or Price Density) or volatility, standard deviation etc.
It is common knowledge that trading the markets is a game of probability. No indicator works all the time (or at all, see above). In order to make decisions based on any indicator, the probability for its validity and the conditions under which validity seemed to have occurred, must be known. Otherwise it is just coffee grounds reading under the illusion of adding to the edge, when in fact it is only adding to the trees, making it even harder to see the forest.
Description
A common belief is that whole or half-dollar prices tend to be attraction points in price action, so a number of traders include those into decision making. But are they really...?
Spoiler Alert:
Generally, it is safe to say that for the big majority of stocks there is very thin evidence for it. It depends vastly on the asset, the timeframe used and the market period (pre/post/main trading times). If at all, there seems to be an above random but still thin evidence for whole prices being significant attraction points. Interesting/surprising patterns are visible on many stocks/timeframes/session periods, though.
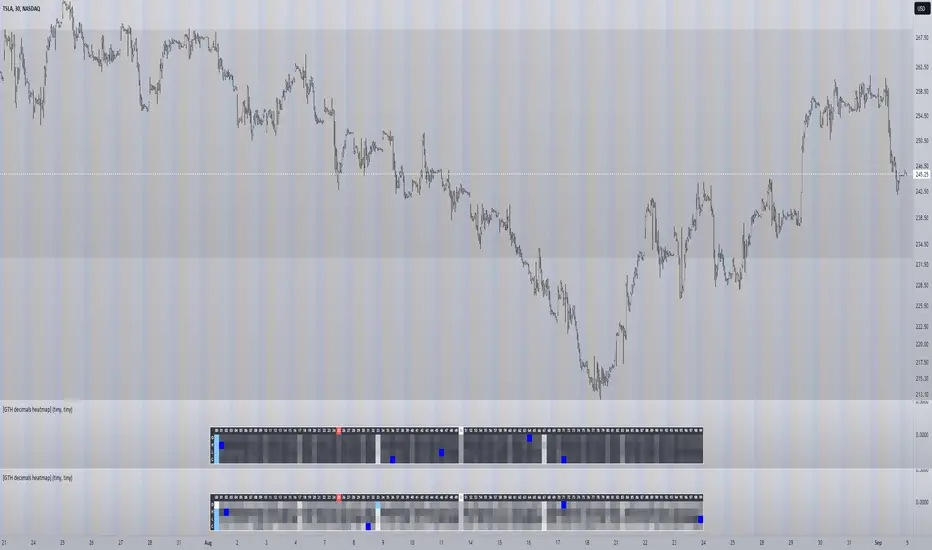
The screenshot shows TSLA, 30m timeframe, two heatmaps added. The top one shows pre/post-market data only, the bottom one main market data only. The cyan fields indicate the strongest occurrence, the dark blue fields indicate the weakest occurrence of open/high/low/close prices at the respective decimal. The red field indicates the current/last price decimal.
Clearly, TSLA displays a strong pre-market attraction for .00, followed by .33 and .67 and .50. This pattern of thirds seems to be a unique feature of TSLA. In the main trading session it is being diluted by a more random distribution.
Other interesting equities to examine:
SPY: No significant pattern on any timeframe!
META: Generally weak patterns on all timeframes, but interestingly on the 1D there is evidence for less randomness on O and H, more on L and most on C.
AAPL: 1D, foggy attraction areas around .35 and .12. Whole price is no attraction area at all! Very weak attraction around .73.
AMD: Strong pattern on D, W, M, attraction areas around 1/16th intervals. No patterns on lower timeframes.
AMZN: Significant differences between pre/post and main session. Strong 1/16th pattern below D in pre/post.
TAOP: Strong 1/5th pattern on all timeframes.
Read the tool tips and go explore!
Are stop orders making money? [yohtza]Who is this indicator for and what does it do?
This is an indicator that helps price action traders in determining the strength of the trend and potential counter trend traps that present themselves during the move. It highlights the background of the bar at which counter trend traders that trade with stop orders (breakout entries) were able to achieve the same amount of reward as was their risk for that trade.
What is it based on?
When there is a strong trend in effect, the counter trend traders are unable to buy above(in bear trend) or sell below (in bull trend) a bar with a stop order and get an equal reward for the risk they are taking.
The first time counter trend traders are able to buy and make money in bear or sell and make money in bull it is a warning sign that market is likely transitioning into trading range phase of the market cycle.
Another application of the indicator is for discovering potential traps. If market comes very close to the take profit level of counter trend traders and reverses, they will usually try to get out with as much profit or as small of a loss as possible and that will often create a fast move (also called giving up) and a good with trend entry.
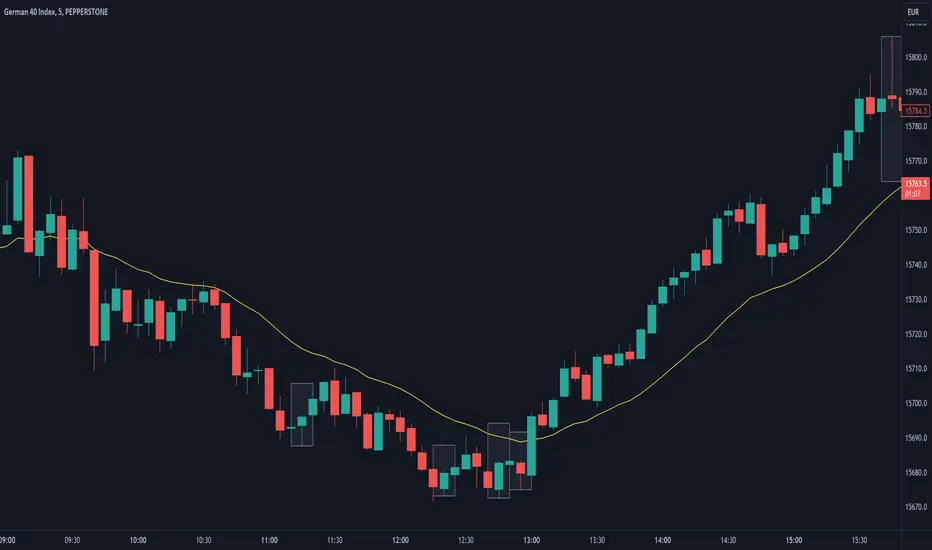
How does it work?
The indicator is using exponential moving average as a filter for when the market is trending and then scans for signals where counter trend traders enter. Next it looks if the stoploss or profit target was hit for that trade. If the profit target was hit it draws a box around the bar on which the traders entered, the box height is based on stoploss and profit target price levels.
Indicator inputs
- Scan for doji signal bars
When this option is selected, bars that have small bodies (less than 50% of their height) are also included as bars on which counter traders enter. If the option is not selected it only looks for bull trend bars (bodies are greater than 50% of their height) below the moving average and bear trend bars above the moving average.
- Border and background colors and border style
It is possible to select different colors and chose between solid, dashed and dotted borders
- Ema period
Default setting is 20 bar exponential moving average but feel free to use which you prefer
- Tick value
This is the value of the minimal movement of the chart you are trading on. For example for S&P 500 E-mini futures the value is 0.25 and that is the default setting.
Momentum Probability Oscillator [SS]This is the momentum based probability indicator.
What it does?
This takes the average of MFI, Stochastics and RSI and plots it out as an independent oscillator.
It then tracks bullish vs bearish instances. Bullish is defined as a greater move from open to high than open to low and inverse for bearish.
It stores this data and these averages and plots these levels as a graph.
The graph depicts the max bullish values at the top, the min bearish values at the bottom and the averages in between:
It will plot the average "threshold" value in yellow:
The threshold value is key. A ticker trading above the threshold is generally bullish. Below is bearish.
The threshold value frequently acts as support and resistance levels (see below):
Resistance:
Support:
The indicator also shows you the amount of time a ticker has spent in each region, over a defined lookback period (defaulted to 500):
When you see that cumulatively, more time has been spent in a bullish range or a bearish range, it can help you ascertain the prevailing sentiment at that time.
The indicator will also calculate the average price range based on the underlying oscillator value. It does this through use of ATR based techniques, as its not usually possible to calculate a price from an oscillator:
This is intended as a general reference and not a precise target, as it is using ATR as opposed to the actual technical value itself.
As this is an oscillator, you can use it to look for divergences as well. The advantage to having it formulated in this way is:
a) You get the power of all 3 indicators (stochastics, MFI and RSI) in one and
b) You are adding context to the underlying technical reading. The indicator is plotting out the average, max and min ranges for the selected ticker and performing assessments based on these ranges that add context to the current PA.
You also have the ability to see the specific technical levels associated with each specific technical indicator. If you open up the settings menu and select "Show Table", this will appear:
This will show you the exact values of each of the technicals the indicator is using in its range assessment.
And that is basically the bulk of the indicator!
I use this predominately on the smaller timeframes, especially when there is a lot of chop, to ascertain the overall sentiment.
I also will reference it on the 1 hour to see what the prevailing sentiment is and whether the stock is at an area of technical resistance or support. For example, here is what I referenced on SPY today:
QUICK NOTE:
It works best with RTH (regular trading hours) turned on and ETH (extended trading hours) turned off!
That's it!
Hopefully you like it and leave your comments and suggestions below!

Variation from Opening📈 Purpose: This script provides traders with a clear visualization of the percentage variation from the opening price for two major futures contracts: ES1! (S&P 500 futures) and NQ1! (Nasdaq 100 futures).
🔑 Key Features:
Real-Time Price Retrieval: Fetches the latest opening prices for ES1! and NQ1! contracts.
Percentage Variation Computation: Determines the percentage change from the opening price, offering traders an immediate view of market dynamics.
Clear Visualization: Plots the percentage variation for both contracts in distinct colors (red for ES1! and blue for NQ1!) for easy differentiation.
💡 Benefits:
Informed Trading: Understand intraday price movements to make better trading decisions.
Versatility: While tailored for ES1! and NQ1!, the script can be adapted for other securities.
Clean Display: A focused, clutter-free chart ensures traders can quickly gauge market movements.
🎯 Ideal For: Traders looking to monitor intraday price shifts of major futures contracts.
Equip yourself with the "Variation from Opening" script and enhance your trading insights!

Pivotal MomentsPivotal Moments draws lines for each of up to 500 pivot high and pivot low levels that have never been revisited at the present moment in time. After the Pivotal Moments indicator has been loaded onto chart and any of the subsequent realtime bars that are formed touch or cross a pivot level it is deleted. The duration for how long any touched or crossed pivot levels remain on chart before deletion may be extended by N bars or N units of time.
There are user selectable options for the following:
• Pivot Bars Left : the number of lower highs or higher lows that must be formed before a possible pivot bar can occur.
• Right : the number of lower highs or higher lows that must be formed after potential pivot to validate a pivot bar.
• Lines Show As : the choice of line style to use for the drawn pivot levels includes Dashed, Dotted, or Solid.
• Wide : the number of lines wide for how thick the drawn pivot levels are desired to be on the chart.
• Delay Removal : the number of units that touched or crossed pivot levels will persist on chart.
• Units : the choice of which delay unit type includes nBars, nSecs, nMins, nHrs, or nDays.
• Extend Right : the number of bars right of current bar to extend drawn pivot levels.
• Show : the number of maximum recent drawn pivot levels to keep on chart.
• Colors Used : the colors used for pivots high, low, and dual pivot bars.
• Show Price Labels : the choice whether to show prices for levels.
• On Right : the choice to move prices to right of pivot levels.
• Show Pivot Bars : the choice to colorize pivot bars.
If desired, alerts can be received for whenever new touches or crosses occur for both pivot highs and pivot lows by creating a single Alert. Note that these alerts are triggered by realtime bars which by their very nature are repainting prices, thus the alert creation window will warn of this with an orange exclamation symbol. For an illustration of how to create alerts for this indicator click the chart below:
Credit: this indicator was originally built for @Luckshury, who has graciously given me permission to publish it publicly.
NOTICE: This is an example script and not meant to be used as an actual strategy. By using this script or any portion thereof, you acknowledge that you have read and understood that this is for research purposes only and I am not responsible for any financial losses you may incur by using this script!

Expected Move from RSI [SS]Publishing this experimental indicator.
What it does:
The indicator uses a user-defined lookback period on a user-defined timeframe to lookback at all instances of RSI. It breaks RSI down as follows:
RSI between
0 - 10
10 - 20
20 - 30
30 - 40
40 - 50
50 - 60
60 - 70
70 - 80
80 - 90
90 - 100
From there, it stores the ticker's move from open to high and open to low. It will then use this data to look at the current RSI based on the specified timeframe and plot the expected move based on the average move the ticker does with a similar RSI reading.
It will plot the expected range, with the high range being plotted in green and the low range being plotted in red.
It will also display an infographic that dictates the current RSI based on the selected time frame, the anticipated up move and the anticipated down move. This infographic will also tell you the strength of the relationship (correlation) RSI has with the ticker's high or low price:
From there the user can determine whether this RSI reading is traditionally bullish or bearish for the ticker. A greater down move indicates that the RSI traditionally elicits a bearish response. A greater up move indicates the inverse.
The user can also view a chart of a breakdown of the anticipated moves based on RSI. If the option to "Show Expected Move Table" is select in the settings menu, the following table will appear:
From here you can see the average up move and down move a ticker does based on its corresponding RSI reading.
NOTE: When using the table, please adjust your chart timeframe to the selected timeframe on the indicator. Thus, if you are looking at the 1 hour levels, please adjust your chart to the 1 hour timeframe to use the chart.
Additional Note: When using the table, an "NaN" means that there are no instances of the ticker being at that RSI level within the designated timeframe period. You can extend your lookback period to up to 500 candles to see if it finds additional instances of similar RSI. Otherwise, you can adjust the selected timeframe.
Uses:
The indicator can be used on all timeframes. It can help give you an idea as to whether the RSI indicates a bearish or bullish sentiment.
It can signal a potential reversal or continuation. It can also help you with determining target prices for day trades and scalp trades.
And that is the indicator. Its pretty straight forward. It is experimental and new, so feel free to play around with it and let me know your thoughts.
Safe trades everyone and thank you for reading!

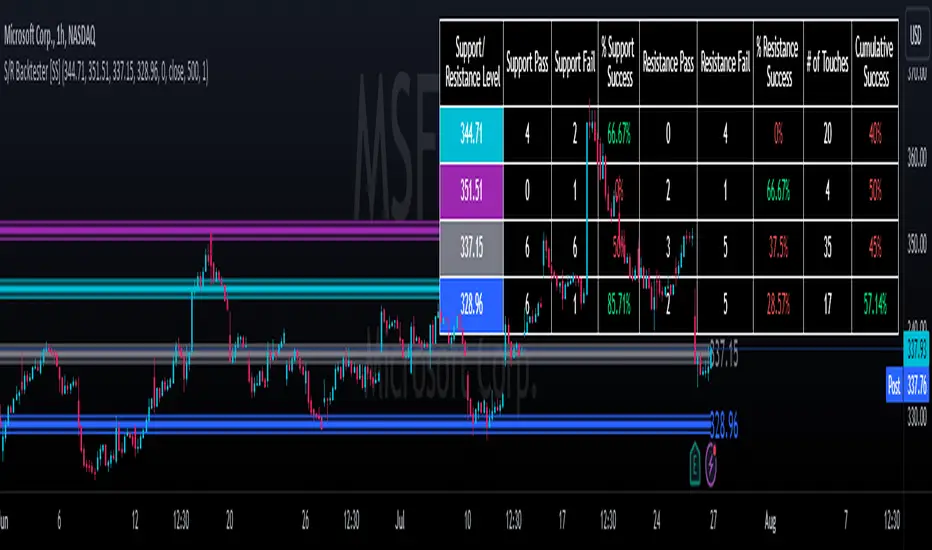
Support and Resistance Backtester [SS]Hey everyone,
Excited to release this indicator I have been working on.
I conceptualized it as an idea a while ago and had to nail down the execution part of it. I think I got it to where I am happy with it, so let me tell you about it!
What it does?
This provides the user with the ability to quantify support and resistance levels. There are plenty of back-test strategies for RSI, stochastics, MFI, any type of technical based indicator. However, in terms of day traders and many swing traders, many of the day traders I know personally do not use or rely on things like RSI, stochastics or MFI. They actually just play the support and resistance levels without attention to anything else. However, there are no tools available to these people who want to, in a way, objectively test their identified support and resistance levels.
For me personally, I use support and resistance levels that are mathematically calculated and I am always curious to see which levels:
a) Have the most touches,
b) Have provided the most support,
c) Have provided the most resistance; and,
d) Are most effective as support/resistance.
And, well, this indicator answers all four of those questions for you! It also attempts to provide some way to support and resistance traders to quantify their levels and back-test the reliability and efficacy of those levels.
How to use:
So this indicator provides a lot of functionality and I think its important to break it down part by part. We can do this as we go over the explanation of how to use it. Here is the step by step guide of how to use it, which will also provide you an opportunity to see the options and functionality.
Step 1: Input your support and resistance levels:
When we open up the settings menu, we will see the section called "Support and Resistance Levels". Here, you have the ability to input up to 5 support and resistance levels. If you have less, no problem, simply leave the S/R level as 0 and the indicator will automatically omit this from the chart and data inclusion.
Step 2: Identify your threshold value:
The threshold parameter extends the range of your support and resistance level by a desired amount. The value you input here should be the value in which you would likely stop out of your position. So, if you are willing to let the stock travel $1 past your support and resistance level, input $1 into this variable. This will extend the range for the assessment and permit the stock to travel +/- your threshold amount before it counts it as a fail or pass.
Step 3: Select your source:
The source will tell the indicator what you want to assess. If you want to assess close, it will look at where the ticker closes in relation to your support and resistance levels. If you want to see how the highs and lows behave around the S/R levels, then change the source to High or Low.
It is recommended to leave at close for optimal results and reliability however.
Step 4: Determine your lookback length:
The lookback length will be the number of candles you want the indicator to lookback to assess the support and resistance level. This is key to get your backtest results.
The recommendation is on timeframes 1 hour or less, to look back 300 candles.
On the daily, 500 candles is recommended.
Step 5: Plot your levels
You will see you have various plot settings available to you. The default settings are to plot your support and resistance levels with labels. This will look as follows:
This will plot your basic support and resistance levels for you, so you do not have to manually plot them.
However, if you want to extend the plotted support and resistance level to visually match your threshold values, you can select the "Plot Threshold Limits" option. This will extend your support and resistance areas to match the designated threshold limits.
In this case on MSFT, I have the threshold limit set at $1. When I select "Plot Threshold Limits", this is the result:
Plotting Passes and Fails:
You will notice at the bottom of the settings menu is an option to plot passes and plot fails. This will identify, via a label overlaid on the chart, where the support and resistance failures and passes resulted. I recommend only selecting one at a time as the screen can get kind of crowded with both on. here is an example on the MSFT chart:
And on the larger timeframe:
The chart
The chart displays all of the results and counts of your support and resistance results. Some things to pay attention to use the chart are:
a) The general success rate as support vs resistance
Rationale: Support levels may act as resistance more often than they do support or vice versa. Let's take a look at MSFT as an example:
The chart above shows the 334.07 level has acted as very strong support. It has been successful as support almost 82% of the time. However, as resistance, it has only been successful 33% of the time. So we could say that 334 is a strong key support level and an area we would be comfortable longing at.
b) The number of touches:
Above you will see the number of touches pointed out by the blue arrow.
Rationale: The number of touches differs from support and resistance. It counts how many times and how frequently a ticker approaches your support and/or resistance area and the duration of time spent in that area. Whereas support and resistance is determined by a candle being either above or below a s/r area, then approaching that area and then either failing or bouncing up/down, the number of touches simply assesses the time spent (in candles) around a support or resistance level. This is key to help you identify if a level has frequent touches/consolidation vs other levels and can help you filter out s/r levels that may not have a lot of touches or are infrequently touched.
Closing comments:
So this is pretty much the indicator in a nutshell. Hopefully you find it helpful and useful and enjoy it.
As always let me know your questions/comments and suggestions below.
As always I appreciate all of you who check out, try out and read about my indicators and ideas. I wish you all the safest trades and good luck!
US Sector strengthThis indicator is designed to normalize the S&P 500 by sector. You can choose to normalize using the Z-score, DEMA, or MinMax. When using the Z-score or DEMA, a level line is displayed.

Volume ValueWhen VelocityTitle: Volume ValueWhen Velocity Trading Strategy
▶ Introduction:
The " Volume ValueWhen Velocity " trading strategy is designed to generate long position signals based on various technical conditions, including volume thresholds, RSI (Relative Strength Index), and price action relative to the Simple Moving Average (SMA). The strategy aims to identify potential buy opportunities when specific criteria are met, helping traders capitalize on potential bullish movements.
▶ How to use and conditions
★ Important : Only on Spot Binance BINANCE:BTCUSDT
Name: Volume ValueWhen Velocity
Operating mode: Long on Spot BINANCE BINANCE:BTCUSDT
Timeframe: Only one hour
Market: Crypto
currency: Bitcoin only
Signal type: Medium or short term
Entry: All sections in the Technical Indicators and Conditions section must be saved to enter (This is explained below)
Exit: Based on loss limit and profit limit It is removed in the settings section
Backtesting:
⁃ Exchange: BINANCE BINANCE:BTCUSDT
⁃ Pair: BTCUSDT
⁃ Timeframe:1h
⁃ Fee: 0.1%
- Initial Capital: 1,000 USDT
- Position sizing: 500 usdt
-Trading Range: 2022-07-01 11:30 ___ 2023-07-21 14:30
▶ Strategy Settings and Parameters:
1. `strategy(title='Volume ValueWhen Velocity', ...`: Sets the strategy title, initial capital, default quantity type, default quantity value, commission value, and trading currency.
↬ Stop-Loss and Take-Profit Settings:
1. long_stoploss_value and long_stoploss_percentage : Define the stop-loss percentage for long positions.
2. long_takeprofit_value and long_takeprofit_percentage : Define the take-profit percentage for long positions.
↬ ValueWhen Occurrence Parameters:
1. occurrence_ValueWhen_1 and occurrence_ValueWhen_2 : Control the occurrences of value events.
2. `distance_value`: Specifies the minimum distance between occurrences of ValueWhen 1 and ValueWhen 2.
↬ RSI Settings:
1. rsi_over_sold and rsi_length : Define the oversold level and RSI length for RSI calculations.
↬ Volume Thresholds:
1. volume_threshold1 , volume_threshold2 , and volume_threshold3 : Set the volume thresholds for multiple volume conditions.
↬ ATR (Average True Range) Settings:
1. atr_small and atr_big : Specify the periods used to calculate the Average True Range.
▶ Date Range for Back-Testing:
1. start_date, end_date, start_month, end_month, start_year, and end_year : Define the date range for back-testing the strategy.
▶ Technical Indicators and Conditions:
1. rsi: Calculates the Relative Strength Index (RSI) based on the defined RSI length and the closing prices.
2. was_over_sold: Checks if the RSI was oversold in the last 10 bars.
3. getVolume and getVolume2 : Custom functions to retrieve volume data for specific bars.
4. firstCandleColor : Evaluates the color of the first candle based on different timeframes.
5. sma : Calculates the Simple Moving Average (SMA) of the closing price over 13 periods.
6. numCandles : Counts the number of candles since the close price crossed above the SMA.
7. atr1 : Checks if the ATR_small is less than ATR_big for the specified security and timeframe.
8. prevClose, prevCloseBarsAgo, and prevCloseChange : ValueWhen functions to calculate the change in the close price between specific occurrences.
9. atrval: A condition based on the ATR_value3.
▶ Buy Signal Condition:
Condition: A combination of multiple volume conditions.
buy_signal: The final buy signal condition that considers various technical conditions and their interactions.
▶ Long Strategy Execution:
1. The strategy will enter a long position (buy) when the buy_signal condition is met and within the specified date range.
2. A stop-loss and take-profit will be set for the long position to manage risk and potential profits.
▶ Conclusion:
The " Volume ValueWhen Velocity " trading strategy is designed to identify long position opportunities based on a combination of volume conditions, RSI, and price action. The strategy aims to capitalize on potential bullish movements and utilizes a stop-loss and take-profit mechanism to manage risk and optimize potential returns. Traders can use this strategy as a starting point for their own trading systems or further customize it to suit their preferences and risk appetite. It is crucial to thoroughly back-test and validate any trading strategy before deploying it in live markets.
↯ Disclaimer:
Risk Management is crucial, so adjust stop loss to your comfort level. A tight stop loss can help minimise potential losses. Use at your own risk.
How you or we can improve? Source code is open so share your ideas!
Leave a comment and smash the boost button!

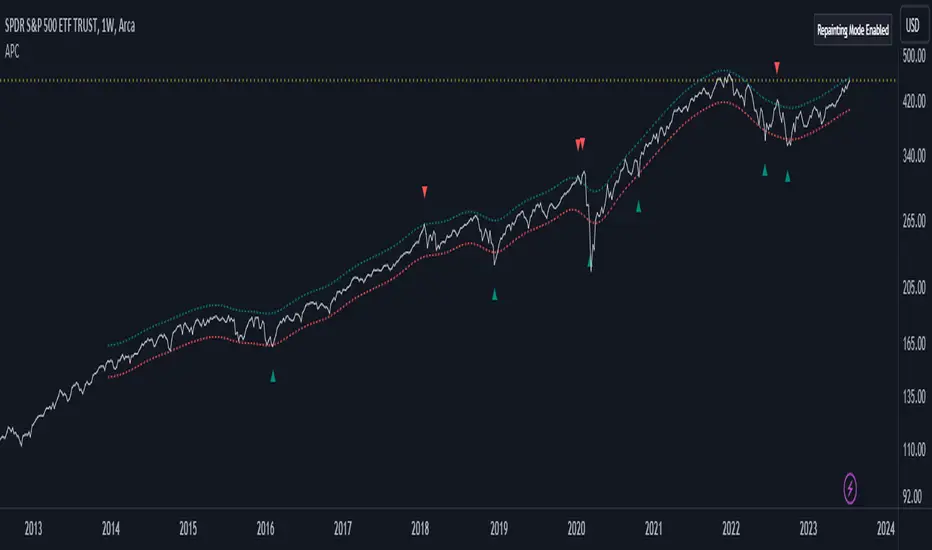
Adaptive Price Channel (log scale)The field of technical analysis is consistently expanding, with numerous indicators used for market forecasting. Amongst them, a novel indicator dubbed the Adaptive Price Channel (log scale), inspired by the renowned Nadaraya-Watson Envelope (LuxAlgo) from LuxAlgo, is gaining traction for its distinctive features and versatility. Unlike its predecessor, the Adaptive Price Channel (log scale) is applicable on a logarithmic scale, thereby allowing it to be utilized on both smaller and larger timeframes.
1. Key Features
The Adaptive Price Channel (log scale) is founded on the trading view Pinescript language, version 5, with its primary aim to maximize the versatility and scalability of trading indicators. It allows traders to adapt it according to their preferred timeframe, thereby making it applicable for a wide range of trading strategies.
Its bandwidth can be adjusted through the input parameters, offering traders the flexibility to manipulate the indicator according to their strategic requirements. Furthermore, it provides an option for repainting smoothing. This option enables users to control the repainting effect in which the historical output of the indicator may change over time. When disabled, the indicator provides the endpoints of the calculations, ensuring consistency in historical values.
Moreover, the Adaptive Price Channel (log scale) allows for color customization, thereby improving visibility and user-friendliness. The colors of the indicator's upward and downward directions can be changed according to the user's preference.
2. Working Mechanism
The Adaptive Price Channel (log scale) uses the logarithm of the source, which is typically the closing price of a trading instrument. It leverages a Gaussian function that exponentially decreases the further the price moves away from the mean, accounting for both positive and negative values. The bandwidth of the Gaussian function can be adjusted to adapt to different market conditions.
Additionally, the Adaptive Price Channel (log scale) features an array of 500 lines for each bar, which helps in defining the boundaries or envelope for price movements. The calculations are executed using the Nadaraya-Watson estimator, which uses kernel regression for non-parametric analysis.
The calculated values for the upper and lower bounds of the envelope are then converted back from the logarithmic scale using the exponential function. This calculation process continues for each bar until the last bar in the data set.
To ensure optimal performance, the Adaptive Price Channel (log scale) uses dynamic repainting. If the repainting mode is enabled, it adjusts the smoothing of the indicator for the entire historical data, making the results more accurate.
3. Visualization and Alerts
The Adaptive Price Channel (log scale) offers an array of visual aids, including labels and plots. The upper and lower bounds of the envelope are plotted, and the indicator triggers labels at points where the closing price crosses these boundaries. These labels serve as alerts for potential trading opportunities.
4. Conclusion
The Adaptive Price Channel (log scale) is an innovative and adaptable trading indicator, drawing inspiration from its predecessor but introducing unique features to increase its versatility. By providing a repainting option, it ensures consistent historical values, thereby enhancing the reliability of the indicator. Furthermore, the capability to operate on a logarithmic scale broadens its usability for different timeframes. The Adaptive Price Channel (log scale) is a powerful tool for any trader, facilitating a better understanding of market dynamics, and enabling more informed decision-making.
Fair Value Gap ChartThe Fair Value Gap chart is a new charting method that displays fair value gap imbalances as Japanese candlesticks, allowing traders to quickly see the evolution of historical market imbalances.
The script is additionally able to compute an exponential moving average using the imbalances as input.
🔶 USAGE
The Fair Value Gap chart allows us to quickly display historical fair value gap imbalances. This also allows for filtering out potential noisy variations, showing more compact trends.
Most like other charting methods, we can draw trendlines/patterns from the displayed results, this can be helpful to potentially predict future imbalances locations.
Users can display an exponential moving average computed from the detected fvg's imbalances. Imbalances above the ema can be indicative of an uptrend, while imbalances under the ema are indicative of a downtrend.
Note that due to pinescript limitations a maximum of 500 lines can be displayed, as such displaying the EMA prevent candle wicks from being displayed.
🔶 DETAILS
🔹 Candle Structure
The Fair Value Gap Chart is constructed by keeping a record of all detected fair value gaps on the chart. Each fvg is displayed as a candlestick, with the imbalance range representing the body of the candle, and the range of the imbalance interval being used for the wicks.
🔹 EMA Source Input
The exponential moving average uses the imbalance range to get its input source, the extremity of the range used depends on whether the fvg is bullish or bearish.
When the fvg is bullish, the maximum of the imbalance range is used as ema input, else the minimum of the fvg imbalance is used.

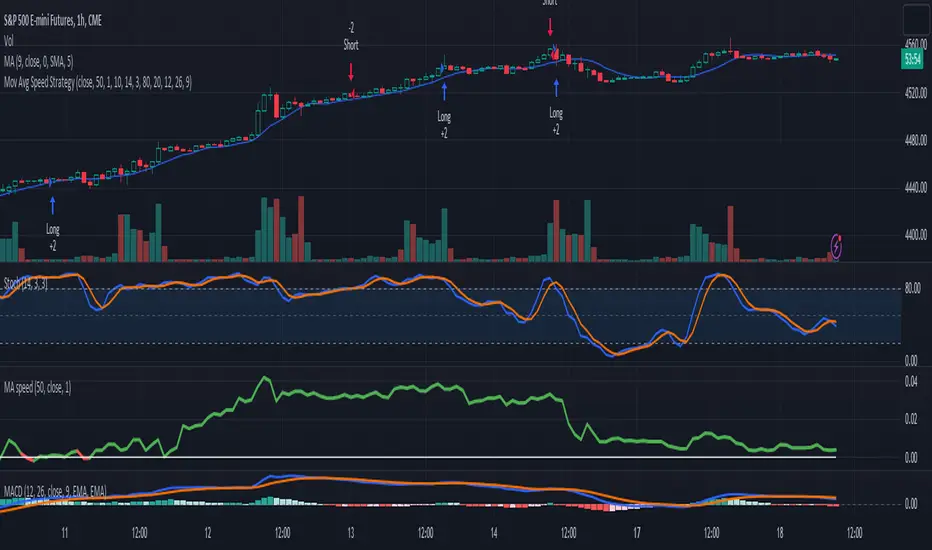
3-Signal Directional Trend Strategy for E-MinisThis is a conceptual strategy intended for E-mini S&P 500 futures with hourly bars.
It uses three signals, going long or short when two or more change in the same direction.
First is MACD. A positive oscillator is considered a bullish signal and a falling oscillator is interpreted bearishly.
Next, stochastics are used as an overbought/oversold indicator. Overbought conditions are considered bearish and oversold readings are viewed as bullish.
Third is a custom indicator based on our Moving Average Speed script. It takes the rate of change of the 50-hour simple moving average (SMA), and then smooths it using a 10-period average. This provides a directional signal.
Traders may want to experiment with different settings for moving average speed.
Note: This is intended for use with stock index futures, which have round-the clock price data to populate the data in the indicators. It may not yield good results with stocks or ETFs.
TradeStation has, for decades, advanced the trading industry, providing access to stocks, options, futures and cryptocurrencies. See our Overview for more.
Important Information
TradeStation Securities, Inc., TradeStation Crypto, Inc., and TradeStation Technologies, Inc. are each wholly owned subsidiaries of TradeStation Group, Inc., all operating, and providing products and services, under the TradeStation brand and trademark. TradeStation Crypto, Inc. offers to self-directed investors and traders cryptocurrency brokerage services. It is neither licensed with the SEC or the CFTC nor is it a Member of NFA. When applying for, or purchasing, accounts, subscriptions, products, and services, it is important that you know which company you will be dealing with. Please click here for further important information explaining what this means.
This content is for informational and educational purposes only. This is not a recommendation regarding any investment or investment strategy. Any opinions expressed herein are those of the author and do not represent the views or opinions of TradeStation or any of its affiliates.
Investing involves risks. Past performance, whether actual or indicated by historical tests of strategies, is no guarantee of future performance or success. There is a possibility that you may sustain a loss equal to or greater than your entire investment regardless of which asset class you trade (equities, options, futures, or digital assets); therefore, you should not invest or risk money that you cannot afford to lose. Before trading any asset class, first read the relevant risk disclosure statements on the Important Documents page, found here: www.tradestation.com .